公告本公司董事會決議辦理收回限制員工權利新股註銷減資事宜
Bull 0
Bear 0
Routine
6472.TW
|
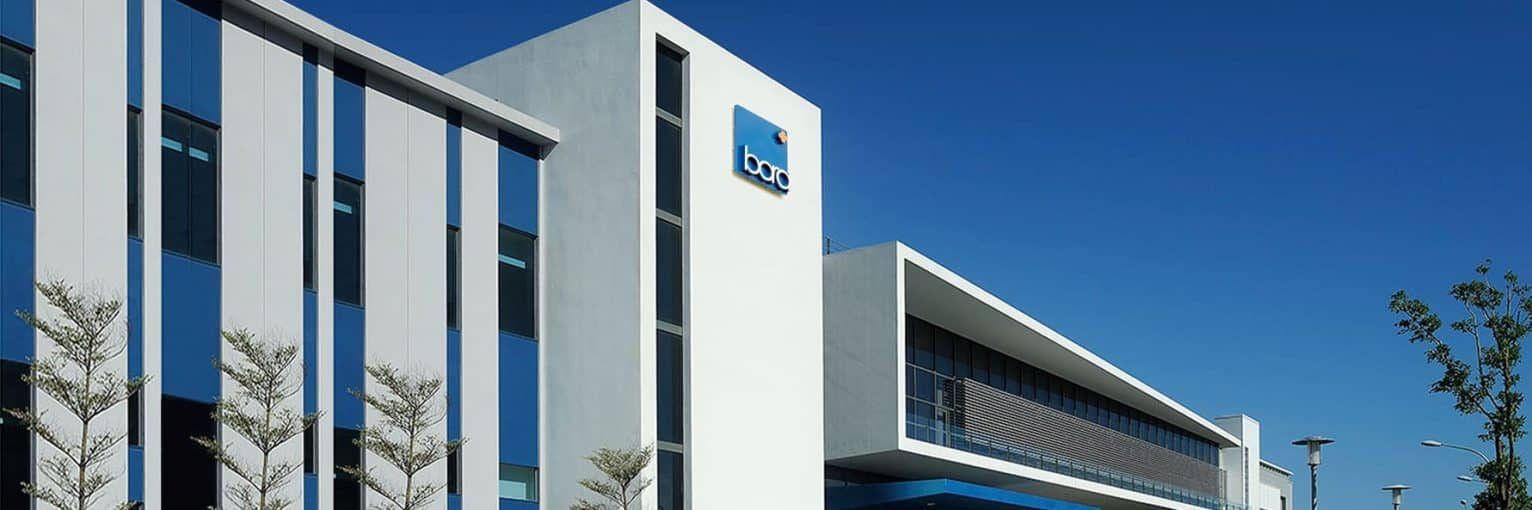
Bora Pharmaceuticals is a pharmaceutical services provider operating under a dual-engine model that integrates contract development and manufacturing organization (CDMO) services with commercial pharmaceutical sales. The company specializes in formulation development, clinical and commercial manufacturing, and packaging for complex oral solid dose, liquid, semi-solid, biologic, and sterile injectable products. Its CDMO operations are supported by sites in North America and Asia, serving pharmaceutical and biotech partners globally. The commercial segment includes Upsher-Smith Laboratories, which manufactures and markets brand and generic pharmaceutical products in the U.S., and SunWay Biotech, which focuses on consumer healthcare solutions derived from microbial technologies. Bora also holds a strategic investment in Tanvex for biosimilar CDMO services and acquired MacroGenics’ GMP manufacturing operations in Maryland. Founded in 2007, the company serves markets in North America, Asia, and Europe, with a focus on niche and rare disease therapies in the U.S. market. Summarised from the company's own disclosures, fiscal year ended Oct 2026 |
Industry Drug Manufacturers - Specialty & Generic | Homepage bora-corp.com |
| Sector Healthcare | IR page bora-corp.com/investors | |
|
Tags
cdmo, oral solid dose, sterile injectables, biologics, generic pharmaceuticals, consumer healthcare, biosimilars, rare disease, formulation development, packaging, Upsher-Smith Laboratories, SunWay Biotech, Bora Biologics, Eden Biologics, Yuta Health, TWi, Tanvex, MacroGenics, Lexapro, Lendormin, Dexlansoprazole DR, JAQBO
|
Press page — |
Metrics
| Valuation | |
|---|---|
| Market cap | NT$ 39.674B |
| Market cap (USD) | $ 1.204B |
| P/E | 26.07 |
| PEG | 0.90 |
| P/BV | 2.51 |
| P/S | 1.87 |
| P/OCF | 40.45 |
| P/FCF | — |
| Dividend yield | — |
| Turnover / mcap | — |
| Returns | |
|---|---|
| ROE | 21.1% |
| ROI | 19.4% |
| ROIC | 18.0% |
| Profit margin | 15.7% |
| Growth | |
|---|---|
| Revenue growing | No |
| Profits growing | No |
| Revenue up 3y | No |
| Revenue up 5y | No |
| Earnings growth 3y (net profit CAGR) | 28.9% |
| Quality | |
|---|---|
| Profitable | Yes |
| Margin expanding | No |
| Buying back stock | No |
| Diluting (TTM) | Yes |
| Debt/Equity | — |
| Podcast bulls (TTM) | Sign up |
| Podcast bears (TTM) | Sign up |
| Podcast sentiment (TTM) | Sign up |
| Podcast sentiment % (TTM) | Sign up |
| News sentiment (TTM) | 0 |
| Quality score | -25.0% |
| Insiders | |
|---|---|
| Buys, 1w | Sign up |
| Buys, 1m | Sign up |
| Buys, 1y | Sign up |
| Sells, 1w | Sign up |
| Sells, 1m | Sign up |
| Sells, 1y | Sign up |
Sign up to see this company's insider trades
| Figure | FY 2025 | FY 2024 | FY 2023 | FY 2022 | FY 2021 | FY 2020 | FY 2019 | FY 2018 | FY 2017 | FY 2016 | FY 2015 | FY 2014 |
|---|---|---|---|---|---|---|---|---|---|---|---|---|
| Revenue | 19.014B | 19.246B | 14.2B | 10.494B | 4.9B | 1.8B | 1.529B | 1.372B | 357.823M | 283.256M | 237.652M | 217.958M |
| Net profit | 2.981B | 3.939B | 3.03B | 1.392B | 749.736M | 578.426M | 305.031M | 442.843M | 14.019M | 24.571M | 33.655M | 16.601M |
| Figure | FY 2025 | FY 2024 | FY 2023 | FY 2022 | FY 2021 | FY 2020 | FY 2019 | FY 2018 | FY 2017 | FY 2016 | FY 2015 | FY 2014 |
|---|---|---|---|---|---|---|---|---|---|---|---|---|
| Share price | 488 | 752 | 639 | — | — | — | — | — | — | — | — | — |
| Price performance 12m | -0.35 | 0.18 | — | — | — | — | — | — | — | — | — | — |
Sign up to see institutional holdings
Sign UpPodcast Mentions
Sign up to see podcast mentions and sentiment
Sign UpMaterial information published on MOPS, newest first, subjects as filed in Chinese, guarantee and loan balance notices and routine equipment purchases included. The link opens the company's material information on MOPS. Press releases from the company's own website, newest first.














Prompts
Click prompts to add them under the company line, click again to take one out, then copy the result into your AI chat. Shared by Asian Century Stocks and Uncovered Thai Stocks. Thank you.
Bora Pharmaceuticals Co., LTD. (ticker 6472.TW), listed in Taiwan.
Copied
ETFs Holding Bora Pharmaceuticals Co., LTD.
Exchange-traded funds whose newest published daily portfolio holds one of the company's listings, largest weight first.
| ETF | Weight in ETF | Shares | Market value | As of |
|---|---|---|---|---|
| RFEM | 0.20% | 13,228 | $ 156.555K | Jul 31, 2026 |
| AVEE | 0.06% | 7,000 | $ 76.715K | Nov 16, 2026 |
| DEXC | 0.02% | 5,000 | $ 60.814K | Nov 12, 2026 |
| DFSE | 0.01% | 6,799 | $ 82.695K | Nov 12, 2026 |
| DFEM | 0.01% | 88,309 | $ 1.074M | Nov 12, 2026 |
| DFEV | 0.01% | 11,000 | $ 133.79K | Nov 12, 2026 |
| DFAX | 0.00% | 43,456 | $ 528.545K | Nov 12, 2026 |
| AVEM | 0.00% | 8,572 | $ 93.943K | Nov 16, 2026 |