說明2026年11月14日媒體報導
Bull 0
Bear 0
Routine
6415.TW
|
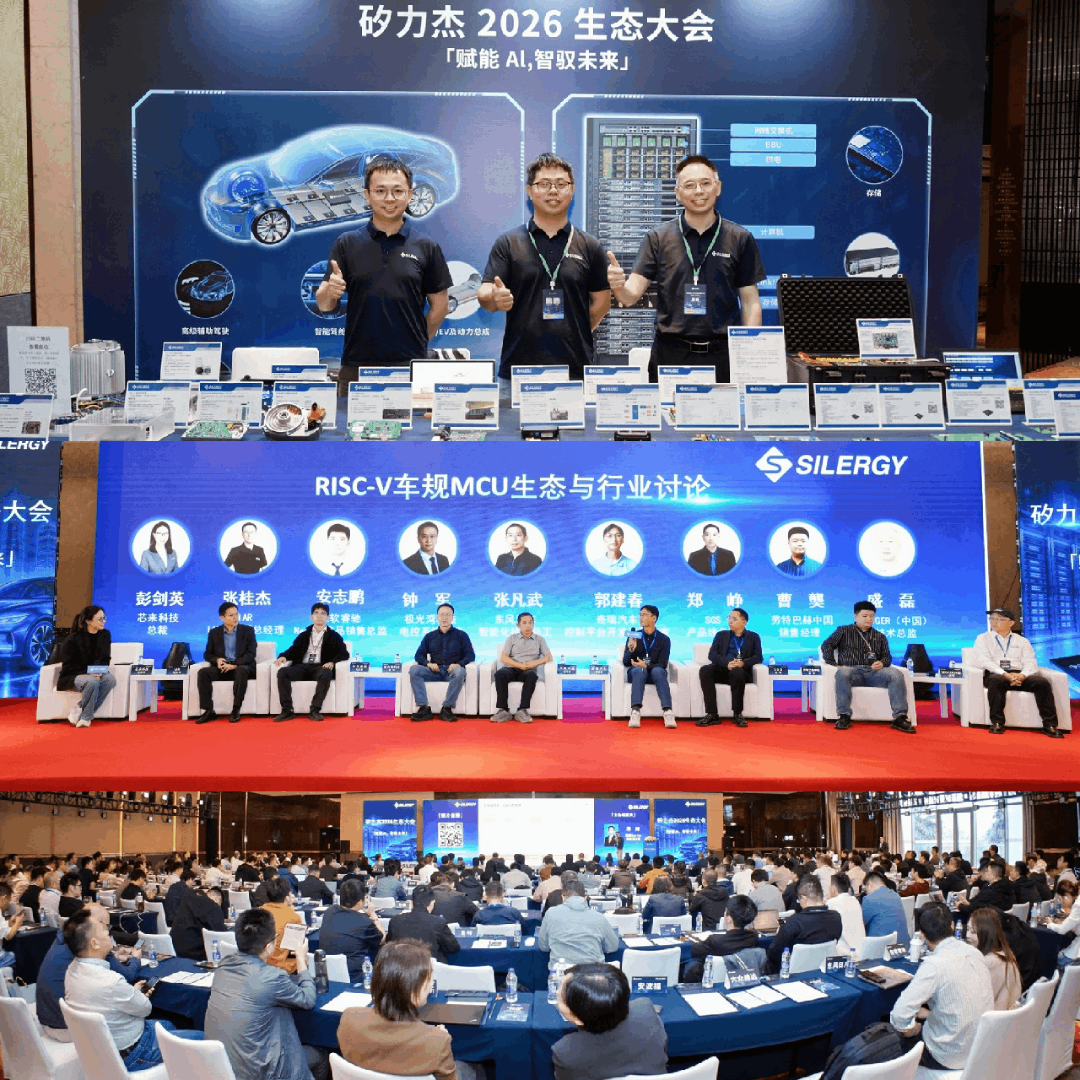
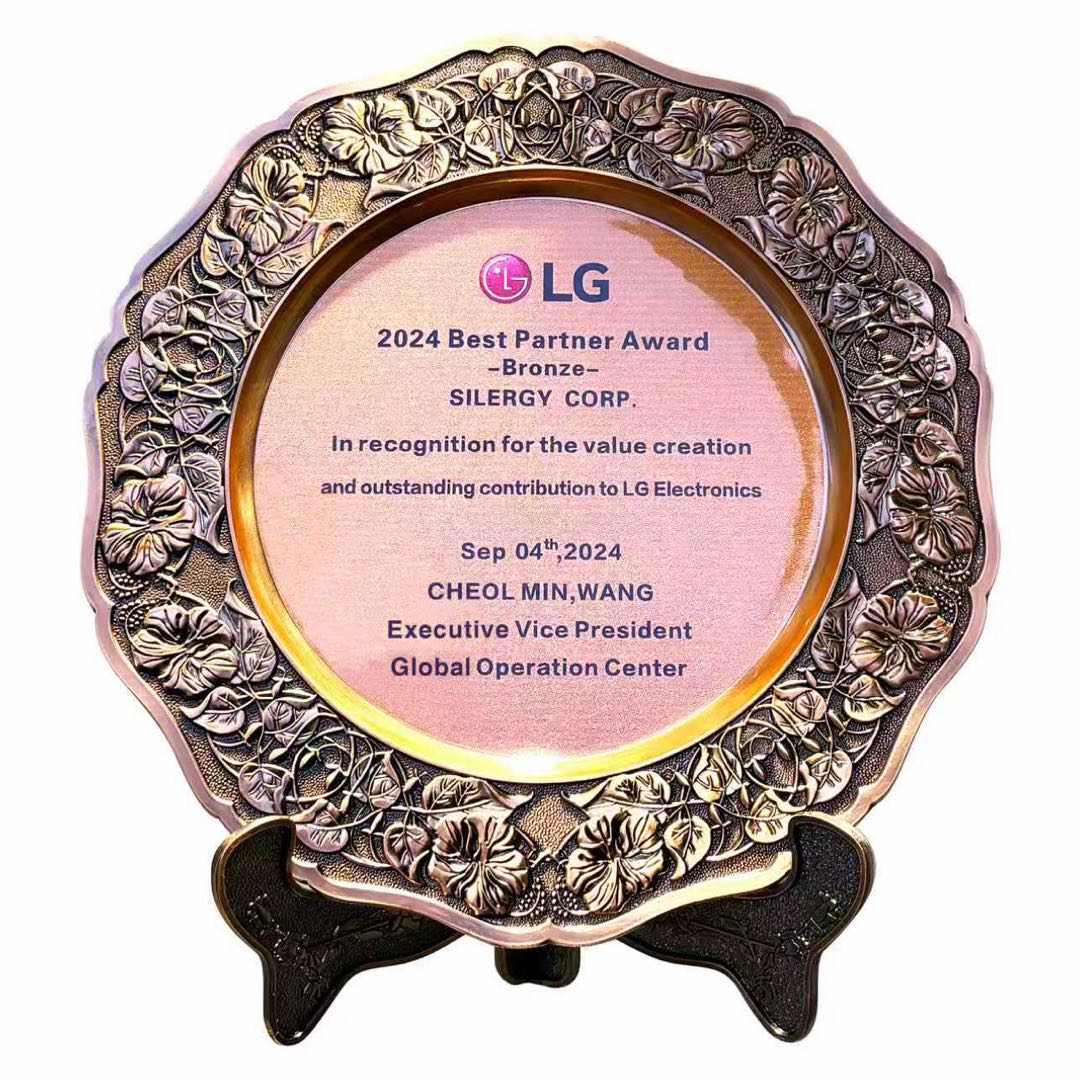
Silergy Corp. is a semiconductor company providing analog, power, and signal chain solutions. Founded in 2008, the company develops products including DC/DC and AC/DC converters, power management ICs, LED lighting solutions, battery management systems, motor drivers, audio power amplifiers, power modules, protection switches, energy measurement, metering, microcontrollers, and signal chain components. Its portfolio includes specific product lines such as SY5800A, SY5804A, Brushed DC and Brushless DC motor drivers, Smart Power Stages, PFC & LLC Combo Controllers, Power over Ethernet ICs, Non-isolated Power Modules, Battery Monitors and Balancers, Microcontrollers, Digital Isolators, and Analog-to-digital Converters. Silergy serves customers in automotive, industrial, consumer, computing, and telecom equipment markets. The company acquired Yuntu Semiconductor to strengthen its automotive MCU and HPU capabilities and has received partner awards from LG Electronics. Summarised from the company's own disclosures, fiscal year ended Oct 2026 |
Industry Semiconductors | Homepage silergy.com |
| Sector Technology | IR page silergy.com/news/investors | |
|
Tags
power management, analog ics, automotive electronics, motor drivers, battery management, microcontrollers, led drivers, signal chain, power over ethernet, industrial control, SY5800A, SY5804A, Yuntu Semiconductor
|
Press page — |
Metrics
| Valuation | |
|---|---|
| Market cap | NT$ 120.051B |
| Market cap (USD) | $ 3.644B |
| P/E | 29.47 |
| PEG | — |
| P/BV | 2.87 |
| P/S | 5.11 |
| P/OCF | 47.22 |
| P/FCF | — |
| Dividend yield | — |
| Turnover / mcap | — |
| Returns | |
|---|---|
| ROE | 6.8% |
| ROI | 6.6% |
| ROIC | 5.5% |
| Profit margin | 13.2% |
| Growth | |
|---|---|
| Revenue growing | Yes |
| Profits growing | Yes |
| Revenue up 3y | No |
| Revenue up 5y | No |
| Earnings growth 3y (net profit CAGR) | -25.7% |
| Quality | |
|---|---|
| Profitable | Yes |
| Margin expanding | No |
| Buying back stock | No |
| Diluting (TTM) | No |
| Debt/Equity | — |
| Podcast bulls (TTM) | Sign up |
| Podcast bears (TTM) | Sign up |
| Podcast sentiment (TTM) | Sign up |
| Podcast sentiment % (TTM) | Sign up |
| News sentiment (TTM) | 0 |
| Quality score | -5.9% |
| Insiders | |
|---|---|
| Buys, 1w | Sign up |
| Buys, 1m | Sign up |
| Buys, 1y | Sign up |
| Sells, 1w | Sign up |
| Sells, 1m | Sign up |
| Sells, 1y | Sign up |
Sign up to see this company's insider trades
| Figure | FY 2025 | FY 2024 | FY 2023 | FY 2022 | FY 2021 | FY 2020 | FY 2019 | FY 2018 | FY 2017 | FY 2016 | FY 2015 | FY 2014 | FY 2013 | FY 2012 | FY 2011 |
|---|---|---|---|---|---|---|---|---|---|---|---|---|---|---|---|
| Revenue | 18.812B | 18.455B | 15.427B | 23.511B | 21.506B | 13.876B | 10.778B | 9.414B | 8.599B | 7.139B | 4.701B | 3.273B | 2.087B | 1.371B | 479.003M |
| Net profit | 2.478B | 2.286B | 746.004M | 6.039B | 5.734B | 3.278B | 2.326B | 1.83B | 1.808B | 1.47B | 1.201B | 800.73M | 530.301M | 387.674M | -82.579M |
| Figure | FY 2025 | FY 2024 | FY 2023 | FY 2022 | FY 2021 | FY 2020 | FY 2019 | FY 2018 | FY 2017 | FY 2016 | FY 2015 | FY 2014 | FY 2013 | FY 2012 | FY 2011 |
|---|---|---|---|---|---|---|---|---|---|---|---|---|---|---|---|
| Share price | 191.5 | 403.5 | 500 | 436.5 | 5.025K | 2.41K | — | — | — | — | — | — | — | — | — |
| Price performance 12m | -0.53 | -0.19 | 0.15 | -0.91 | 1.09 | — | — | — | — | — | — | — | — | — | — |
Sign up to see institutional holdings
Sign UpPodcast Mentions
Sign up to see podcast mentions and sentiment
Sign UpMaterial information published on MOPS, newest first, subjects as filed in Chinese, guarantee and loan balance notices and routine equipment purchases included. The link opens the company's material information on MOPS. Press releases from the company's own website, newest first.
公告本公司董事會通過115年度第三季合併財務報告
Bull 0
Bear 0
Routine
本公司受邀參加J.P. Morgan 2026 APAC Technology, Innovation and Growth Conference
Bull 0
Bear 0
Routine







Prompts
Click prompts to add them under the company line, click again to take one out, then copy the result into your AI chat. Shared by Asian Century Stocks and Uncovered Thai Stocks. Thank you.
Silergy Corp. (ticker 6415.TW), listed in Taiwan.
Copied
ETFs Holding Silergy Corp.
Exchange-traded funds whose newest published daily portfolio holds one of the company's listings, largest weight first.
| ETF | Weight in ETF | Shares | Market value | As of |
|---|---|---|---|---|
| DINT | 1.99% | 464,000 | $ 5.779M | Jul 31, 2026 |
| DWLD | 1.21% | 596,000 | $ 7.423M | Jul 31, 2026 |
| MEMS | 1.00% | 12,000 | $ 225.26K | Jun 30, 2026 |
| EMSF | 0.70% | 18,000 | $ 337.89K | Jun 30, 2026 |
| DFSE | 0.08% | 34,000 | $ 450.659K | Nov 12, 2026 |
| DFEV | 0.07% | 109,000 | $ 1.445M | Nov 12, 2026 |
| DFAE | 0.04% | 288,000 | $ 3.817M | Nov 12, 2026 |
| DEXC | 0.04% | 7,000 | $ 92.783K | Nov 12, 2026 |
| NTSE | 0.03% | 1,000 | $ 18.772K | Jun 30, 2026 |
| DFEM | 0.03% | 198,000 | $ 2.624M | Nov 12, 2026 |
| DFAX | 0.02% | 180,000 | $ 2.386M | Nov 12, 2026 |
| AVEM | 0.00% | 3,000 | $ 35.668K | Nov 16, 2026 |