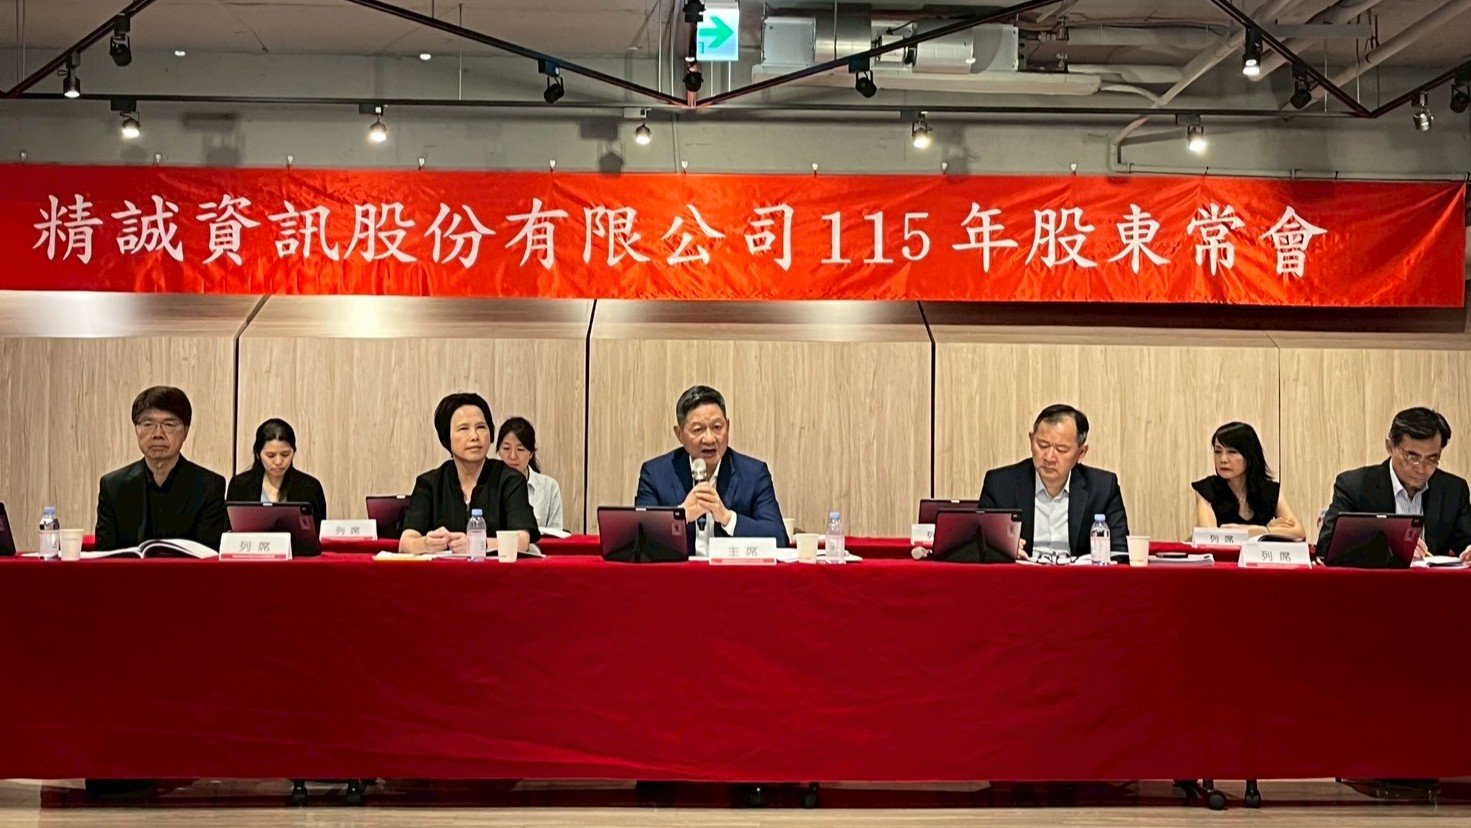
公告本公司董事會決議召開115年第一次股東臨時會相關事宜
Bull 0
Bear 0
Routine
6214.TW
|
Systex Corporation is an IT services and software development company that provides digital transformation solutions, cloud computing, cybersecurity, and data integration services. The company offers a range of services including AI-driven solutions, multi-cloud hybrid environments, and end-to-end cybersecurity mechanisms. Systex serves industries such as semiconductors, government, finance, healthcare, and manufacturing, with a focus on helping enterprises enhance operational efficiency and data security. The company has established strategic partnerships, including a joint venture with ITOCHU Techno-Solutions Corporation named CTC-SYSTEX, and a strategic alliance with ITOCHU Corporation to expand global IT services. Systex also operates SYSTEX Asia, a regional hub in Singapore serving Southeast Asian markets, and collaborates with Dun & Bradstreet to provide ESG and carbon management solutions through its Carbon EnVision platform. The company supports cross-border IT resilience and global supply chain deployment for enterprises expanding internationally. Summarised from the company's own disclosures |
Industry Information Technology Services | Homepage tw.systex.com |
| Sector Technology | IR page — | |
|
Tags
cloud computing, cybersecurity, data integration, ai solutions, digital transformation, esg management, carbon management, it consulting, software development, cross-border it services, CTC-SYSTEX, SYSTEX Asia, Carbon EnVision, Dun & Bradstreet, ITOCHU Techno-Solutions Corporation, ITOCHU Corporation
|
Press page — |
Metrics
| Valuation | |
|---|---|
| Market cap | NT$ 47.098B |
| Market cap (USD) | $ 1.43B |
| P/E | 17.53 |
| PEG | 0.69 |
| P/BV | 2.51 |
| P/S | 0.82 |
| P/OCF | -16.68 |
| P/FCF | — |
| Dividend yield | — |
| Turnover / mcap | — |
| Returns | |
|---|---|
| ROE | 12.0% |
| ROI | 11.8% |
| ROIC | 7.4% |
| Profit margin | 4.9% |
| Growth | |
|---|---|
| Revenue growing | Yes |
| Profits growing | Yes |
| Revenue up 3y | Yes |
| Revenue up 5y | Yes |
| Earnings growth 3y (net profit CAGR) | 25.3% |
| Quality | |
|---|---|
| Profitable | Yes |
| Margin expanding | No |
| Buying back stock | No |
| Diluting (TTM) | No |
| Debt/Equity | — |
| Podcast bulls (TTM) | Sign up |
| Podcast bears (TTM) | Sign up |
| Podcast sentiment (TTM) | Sign up |
| Podcast sentiment % (TTM) | Sign up |
| News sentiment (TTM) | 0 |
| Quality score | 31.3% |
| Insiders | |
|---|---|
| Buys, 1w | Sign up |
| Buys, 1m | Sign up |
| Buys, 1y | Sign up |
| Sells, 1w | Sign up |
| Sells, 1m | Sign up |
| Sells, 1y | Sign up |
Sign up to see this company's insider trades
| Figure | FY 2025 | FY 2024 | FY 2023 | FY 2022 | FY 2021 | FY 2020 | FY 2019 | FY 2018 | FY 2017 | FY 2016 | FY 2015 | FY 2014 | FY 2013 | FY 2012 | FY 2011 | FY 2010 |
|---|---|---|---|---|---|---|---|---|---|---|---|---|---|---|---|---|
| Revenue | 43.969B | 38.951B | 35.184B | 33.129B | 29.527B | 23.735B | 22.051B | 19.516B | 16.874B | 16.21B | 16.313B | 15.809B | 15.657B | 14.535B | 13.613B | 12.796B |
| Net profit | 2.149B | 1.957B | 1.494B | 1.091B | 1.214B | 1.666B | 1.808B | 1.051B | 1.178B | 1.108B | 564.274M | 744.717M | 830.54M | 298.449M | 145.798M | 1.042B |
| Figure | FY 2025 | FY 2024 | FY 2023 | FY 2022 | FY 2021 | FY 2020 | FY 2019 | FY 2018 | FY 2017 | FY 2016 | FY 2015 | FY 2014 | FY 2013 | FY 2012 | FY 2011 | FY 2010 |
|---|---|---|---|---|---|---|---|---|---|---|---|---|---|---|---|---|
| Share price | 118 | 144.5 | 112 | 69.5 | 84.8 | 87.7 | — | — | — | — | — | — | — | — | — | — |
| Price performance 12m | -0.18 | 0.29 | 0.61 | -0.18 | -0.03 | — | — | — | — | — | — | — | — | — | — | — |
Sign up to see institutional holdings
Sign UpPodcast Mentions
Sign up to see podcast mentions and sentiment
Sign UpMaterial information published on MOPS, newest first, subjects as filed in Chinese, guarantee and loan balance notices and routine equipment purchases included. The link opens the company's material information on MOPS. Press releases from the company's own website, newest first.


Prompts
Click prompts to add them under the company line, click again to take one out, then copy the result into your AI chat. Shared by Asian Century Stocks and Uncovered Thai Stocks. Thank you.
Systex Corporation (ticker 6214.TW), listed in Taiwan.
Copied
ETFs Holding Systex Corporation
Exchange-traded funds whose newest published daily portfolio holds one of the company's listings, largest weight first.
| ETF | Weight in ETF | Shares | Market value | As of |
|---|---|---|---|---|
| EYLD | 1.01% | 1,823,037 | $ 8.687M | Jul 31, 2026 |
| AVEE | 0.07% | 16,000 | $ 90.889K | Nov 16, 2026 |
| DFSE | 0.03% | 26,000 | $ 149.441K | Nov 12, 2026 |
| DFEV | 0.02% | 95,000 | $ 546.035K | Nov 12, 2026 |
| DFEM | 0.02% | 241,000 | $ 1.385M | Nov 12, 2026 |
| DEXC | 0.02% | 7,000 | $ 40.234K | Nov 12, 2026 |
| AVEM | 0.01% | 273,000 | $ 1.551M | Nov 16, 2026 |
| AVSE | 0.01% | 4,000 | $ 22.722K | Nov 16, 2026 |
| DFAE | 0.01% | 159,000 | $ 913.89K | Nov 12, 2026 |
| DFAX | 0.01% | 134,000 | $ 770.197K | Nov 12, 2026 |
| AVXC | 0.00% | 1,000 | $ 5,680.54 | Nov 16, 2026 |