公告本公司召開法人說明會相關資訊
Bull 0
Bear 0
Routine
6005.TW
|
Capital Securities Corporation is a securities broker that provides online account opening, diverse trading platforms, and mobile ordering applications. The company facilitates trading in Taiwan stocks, cross-border commissions for US, Hong Kong, and mainland China stocks, ETFs, funds, and futures. It offers investment advisory services, intelligent stock selection tools, and high-speed order execution capabilities to its clients. Summarised from the company's own disclosures |
Industry Capital Markets | Homepage capital.com.tw |
| Sector Financial Services | IR page dstock.capital.com.tw/AverInvest/index.do | |
|
Tags
securities brokerage, online trading, investment advisory, wealth management, retail trading, cross-border investment, Capital Securities Corporation
|
Press page — |
Metrics
| Valuation | |
|---|---|
| Market cap | NT$ 60.03B |
| Market cap (USD) | $ 1.822B |
| P/E | 5.13 |
| PEG | 0.06 |
| P/BV | 1.10 |
| P/S | 1.87 |
| P/OCF | -2.13 |
| P/FCF | — |
| Dividend yield | — |
| Turnover / mcap | — |
| Returns | |
|---|---|
| ROE | 13.1% |
| ROI | 12.6% |
| ROIC | 8.3% |
| Profit margin | 29.8% |
| Growth | |
|---|---|
| Revenue growing | Yes |
| Profits growing | Yes |
| Revenue up 3y | Yes |
| Revenue up 5y | No |
| Earnings growth 3y (net profit CAGR) | 89.7% |
| Quality | |
|---|---|
| Profitable | Yes |
| Margin expanding | Yes |
| Buying back stock | No |
| Diluting (TTM) | Yes |
| Debt/Equity | — |
| Podcast bulls (TTM) | Sign up |
| Podcast bears (TTM) | Sign up |
| Podcast sentiment (TTM) | Sign up |
| Podcast sentiment % (TTM) | Sign up |
| News sentiment (TTM) | 0 |
| Quality score | 50.0% |
| Insiders | |
|---|---|
| Buys, 1w | Sign up |
| Buys, 1m | Sign up |
| Buys, 1y | Sign up |
| Sells, 1w | Sign up |
| Sells, 1m | Sign up |
| Sells, 1y | Sign up |
Sign up to see this company's insider trades
| Figure | FY 2025 | FY 2024 | FY 2023 | FY 2022 | FY 2021 | FY 2020 | FY 2019 | FY 2018 | FY 2017 | FY 2016 | FY 2015 | FY 2014 | FY 2013 | FY 2012 | FY 2011 | FY 2010 |
|---|---|---|---|---|---|---|---|---|---|---|---|---|---|---|---|---|
| Revenue | 19.231B | 17.149B | 12.746B | 8.219B | 13.282B | 9.724B | 7.797B | 7.639B | 9.245B | 6.347B | 6.564B | 6.869B | 5.974B | 7.04B | 9.616B | 8.231B |
| Net profit | 5.736B | 4.884B | 4.132B | 840.04M | 5.25B | 3.57B | 2.567B | 1.409B | 2.894B | 1.197B | 1.549B | 2.025B | 1.472B | 1.054B | 814.398M | 1.646B |
| Figure | FY 2025 | FY 2024 | FY 2023 | FY 2022 | FY 2021 | FY 2020 | FY 2019 | FY 2018 | FY 2017 | FY 2016 | FY 2015 | FY 2014 | FY 2013 | FY 2012 | FY 2011 | FY 2010 |
|---|---|---|---|---|---|---|---|---|---|---|---|---|---|---|---|---|
| Share price | 23.95 | 24.65 | 16.35 | 10.85 | 16.95 | 13.55 | — | — | — | — | — | — | — | — | — | — |
| Price performance 12m | -0.03 | 0.51 | 0.51 | -0.36 | 0.25 | — | — | — | — | — | — | — | — | — | — | — |
Sign up to see institutional holdings
Sign UpPodcast Mentions
Sign up to see podcast mentions and sentiment
Sign UpMaterial information published on MOPS, newest first, subjects as filed in Chinese, guarantee and loan balance notices and routine equipment purchases included. The link opens the company's material information on MOPS. Press releases from the company's own website, newest first.



 證券
 複委託
 期貨
 信託
 融資融券
 雙向借券
 交割款借貸
 群益便利貸
 零股
 定期定額
 ETF
 權證
 當沖
 一戶通
 加開電子戶
 變更基本資料
 簽署同意書
 鷹速必備

 快速開戶小撇步
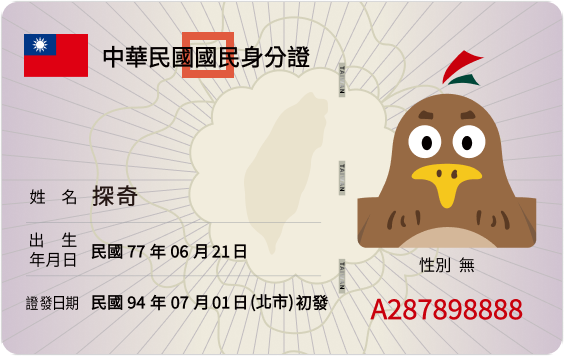


 專屬營業員的優質服務
 手機版登入
 手機版登入



Prompts
Click prompts to add them under the company line, click again to take one out, then copy the result into your AI chat. Shared by Asian Century Stocks and Uncovered Thai Stocks. Thank you.
Capital Securities Corporation (ticker 6005.TW), listed in Taiwan.
Copied
ETFs Holding Capital Securities Corporation
Exchange-traded funds whose newest published daily portfolio holds one of the company's listings, largest weight first.
| ETF | Weight in ETF | Shares | Market value | As of |
|---|---|---|---|---|
| AVEE | 0.13% | 218,698 | $ 174.536K | Nov 16, 2026 |
| DEXC | 0.04% | 130,065 | $ 108.093K | Nov 12, 2026 |
| DFEV | 0.04% | 942,123 | $ 782.971K | Nov 12, 2026 |
| DFEM | 0.03% | 3,275,111 | $ 2.722M | Nov 12, 2026 |
| AVES | 0.03% | 562,000 | $ 448.515K | Nov 16, 2026 |
| AVEM | 0.02% | 7,508,144 | $ 5.992M | Nov 16, 2026 |
| AVSE | 0.02% | 63,336 | $ 50.547K | Nov 16, 2026 |
| AVXC | 0.02% | 121,397 | $ 96.883K | Nov 16, 2026 |
| DFSE | 0.02% | 132,327 | $ 109.973K | Nov 12, 2026 |
| DFAE | 0.01% | 1,555,374 | $ 1.293M | Nov 12, 2026 |
| DFAX | 0.01% | 1,625,247 | $ 1.351M | Nov 12, 2026 |