公告本公司董事會通過115年第3季合併財務報告
Bull 0
Bear 0
Routine
5608.TW
|
Shih Wei Navigation Co., Ltd. is a shipping company engaged in vessel transport, shipping agency services, and the wholesale and retail of ships and their parts. The company operates a fleet consisting primarily of bulk carriers and one passenger ferry, with ship types including Ultramax, Handysize, Multi Purpose, Kamsarmax, and Panamax classes. Its business model focuses on dry bulk shipping, transporting bulk commodities such as grains, steel, coal, and ores on a non-scheduled basis. Routes and ports of call are determined by cargo destinations and charterers, serving a free-market environment with seasonal and one-way transport characteristics. The company operates on near and far ocean routes, offering transport services for new routes when appropriate returns are available. It evaluates plans to acquire new energy-efficient vessels to maintain fleet competitiveness and comply with environmental regulations regarding emissions and fuel usage. Summarised from the company's own disclosures, fiscal year ended Oct 2026 |
Industry Marine Shipping | Homepage swnav.com.tw |
| Sector Industrials | IR page swnav.com.tw/investors | |
|
Tags
dry bulk shipping, bulk carriers, shipping agency, vessel transport, ship wholesale, ship retail, commodity transport, grains, coal, steel, ores, ocean routes, SW Sunbright
|
Press page swnav.com.tw/news/news |
Metrics
| Valuation | |
|---|---|
| Market cap | NT$ 5.528B |
| Market cap (USD) | $ 167.79M |
| P/E | 13.79 |
| PEG | — |
| P/BV | 0.55 |
| P/S | 1.55 |
| P/OCF | 6.59 |
| P/FCF | — |
| Dividend yield | — |
| Turnover / mcap | — |
| Returns | |
|---|---|
| ROE | -0.51% |
| ROI | -0.52% |
| ROIC | -0.75% |
| Profit margin | -1.6% |
| Growth | |
|---|---|
| Revenue growing | No |
| Profits growing | Yes |
| Revenue up 3y | No |
| Revenue up 5y | No |
| Earnings growth 3y (net profit CAGR) | — |
| Quality | |
|---|---|
| Profitable | No |
| Margin expanding | No |
| Buying back stock | No |
| Diluting (TTM) | No |
| Debt/Equity | — |
| Podcast bulls (TTM) | Sign up |
| Podcast bears (TTM) | Sign up |
| Podcast sentiment (TTM) | Sign up |
| Podcast sentiment % (TTM) | Sign up |
| News sentiment (TTM) | 3 |
| Quality score | -37.5% |
| Insiders | |
|---|---|
| Buys, 1w | Sign up |
| Buys, 1m | Sign up |
| Buys, 1y | Sign up |
| Sells, 1w | Sign up |
| Sells, 1m | Sign up |
| Sells, 1y | Sign up |
Sign up to see this company's insider trades
| Figure | FY 2025 | FY 2024 | FY 2023 | FY 2022 | FY 2021 | FY 2020 | FY 2019 | FY 2018 | FY 2017 | FY 2016 | FY 2015 | FY 2014 | FY 2013 | FY 2012 | FY 2011 | FY 2010 |
|---|---|---|---|---|---|---|---|---|---|---|---|---|---|---|---|---|
| Revenue | 3.184B | 3.493B | 3.461B | 6.716B | 5.533B | 2.671B | 3.804B | 4.024B | 3.499B | 3.523B | 4.463B | 4.471B | 4.658B | 4.046B | 4.062B | 4.196B |
| Net profit | -49.519M | -269.253M | -476M | 2.029B | 2.003B | -912.015M | -352.868M | -151.002M | -2.034B | -1.093B | -50.429M | 224.974M | 353.6M | 657.078M | 908.495M | 1.135B |
| Figure | FY 2025 | FY 2024 | FY 2023 | FY 2022 | FY 2021 | FY 2020 | FY 2019 | FY 2018 | FY 2017 | FY 2016 | FY 2015 | FY 2014 | FY 2013 | FY 2012 | FY 2011 | FY 2010 |
|---|---|---|---|---|---|---|---|---|---|---|---|---|---|---|---|---|
| Share price | 17.6 | 16.7 | 20.55 | 25.1 | 45.2 | 13 | — | — | — | — | — | — | — | — | — | — |
| Price performance 12m | 0.05 | -0.19 | -0.18 | -0.44 | 2.48 | — | — | — | — | — | — | — | — | — | — | — |
Sign up to see institutional holdings
Sign UpPodcast Mentions
Sign up to see podcast mentions and sentiment
Sign UpMaterial information published on MOPS, newest first, subjects as filed in Chinese, guarantee and loan balance notices and routine equipment purchases included. The link opens the company's material information on MOPS. Press releases from the company's own website, newest first.
本公司受邀參加由富邦證券舉辦之法人說明會。
Bull 0
Bear 0
Routine
因本公司有價證券於集中交易市場達公布注意交易資訊標準 ,故公布相關財務業務等重大訊息,以利投資人區別瞭解。
Bull 6
Bear 0
Results



 ](
 ](
 ](
 ](
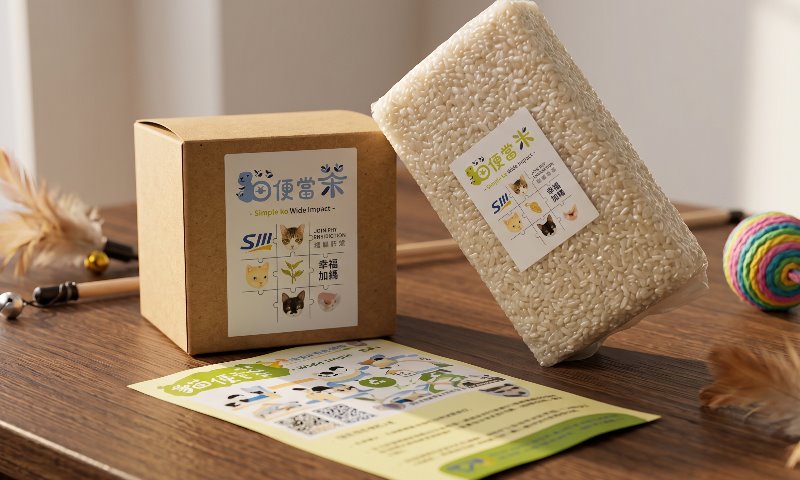 ](
 ](


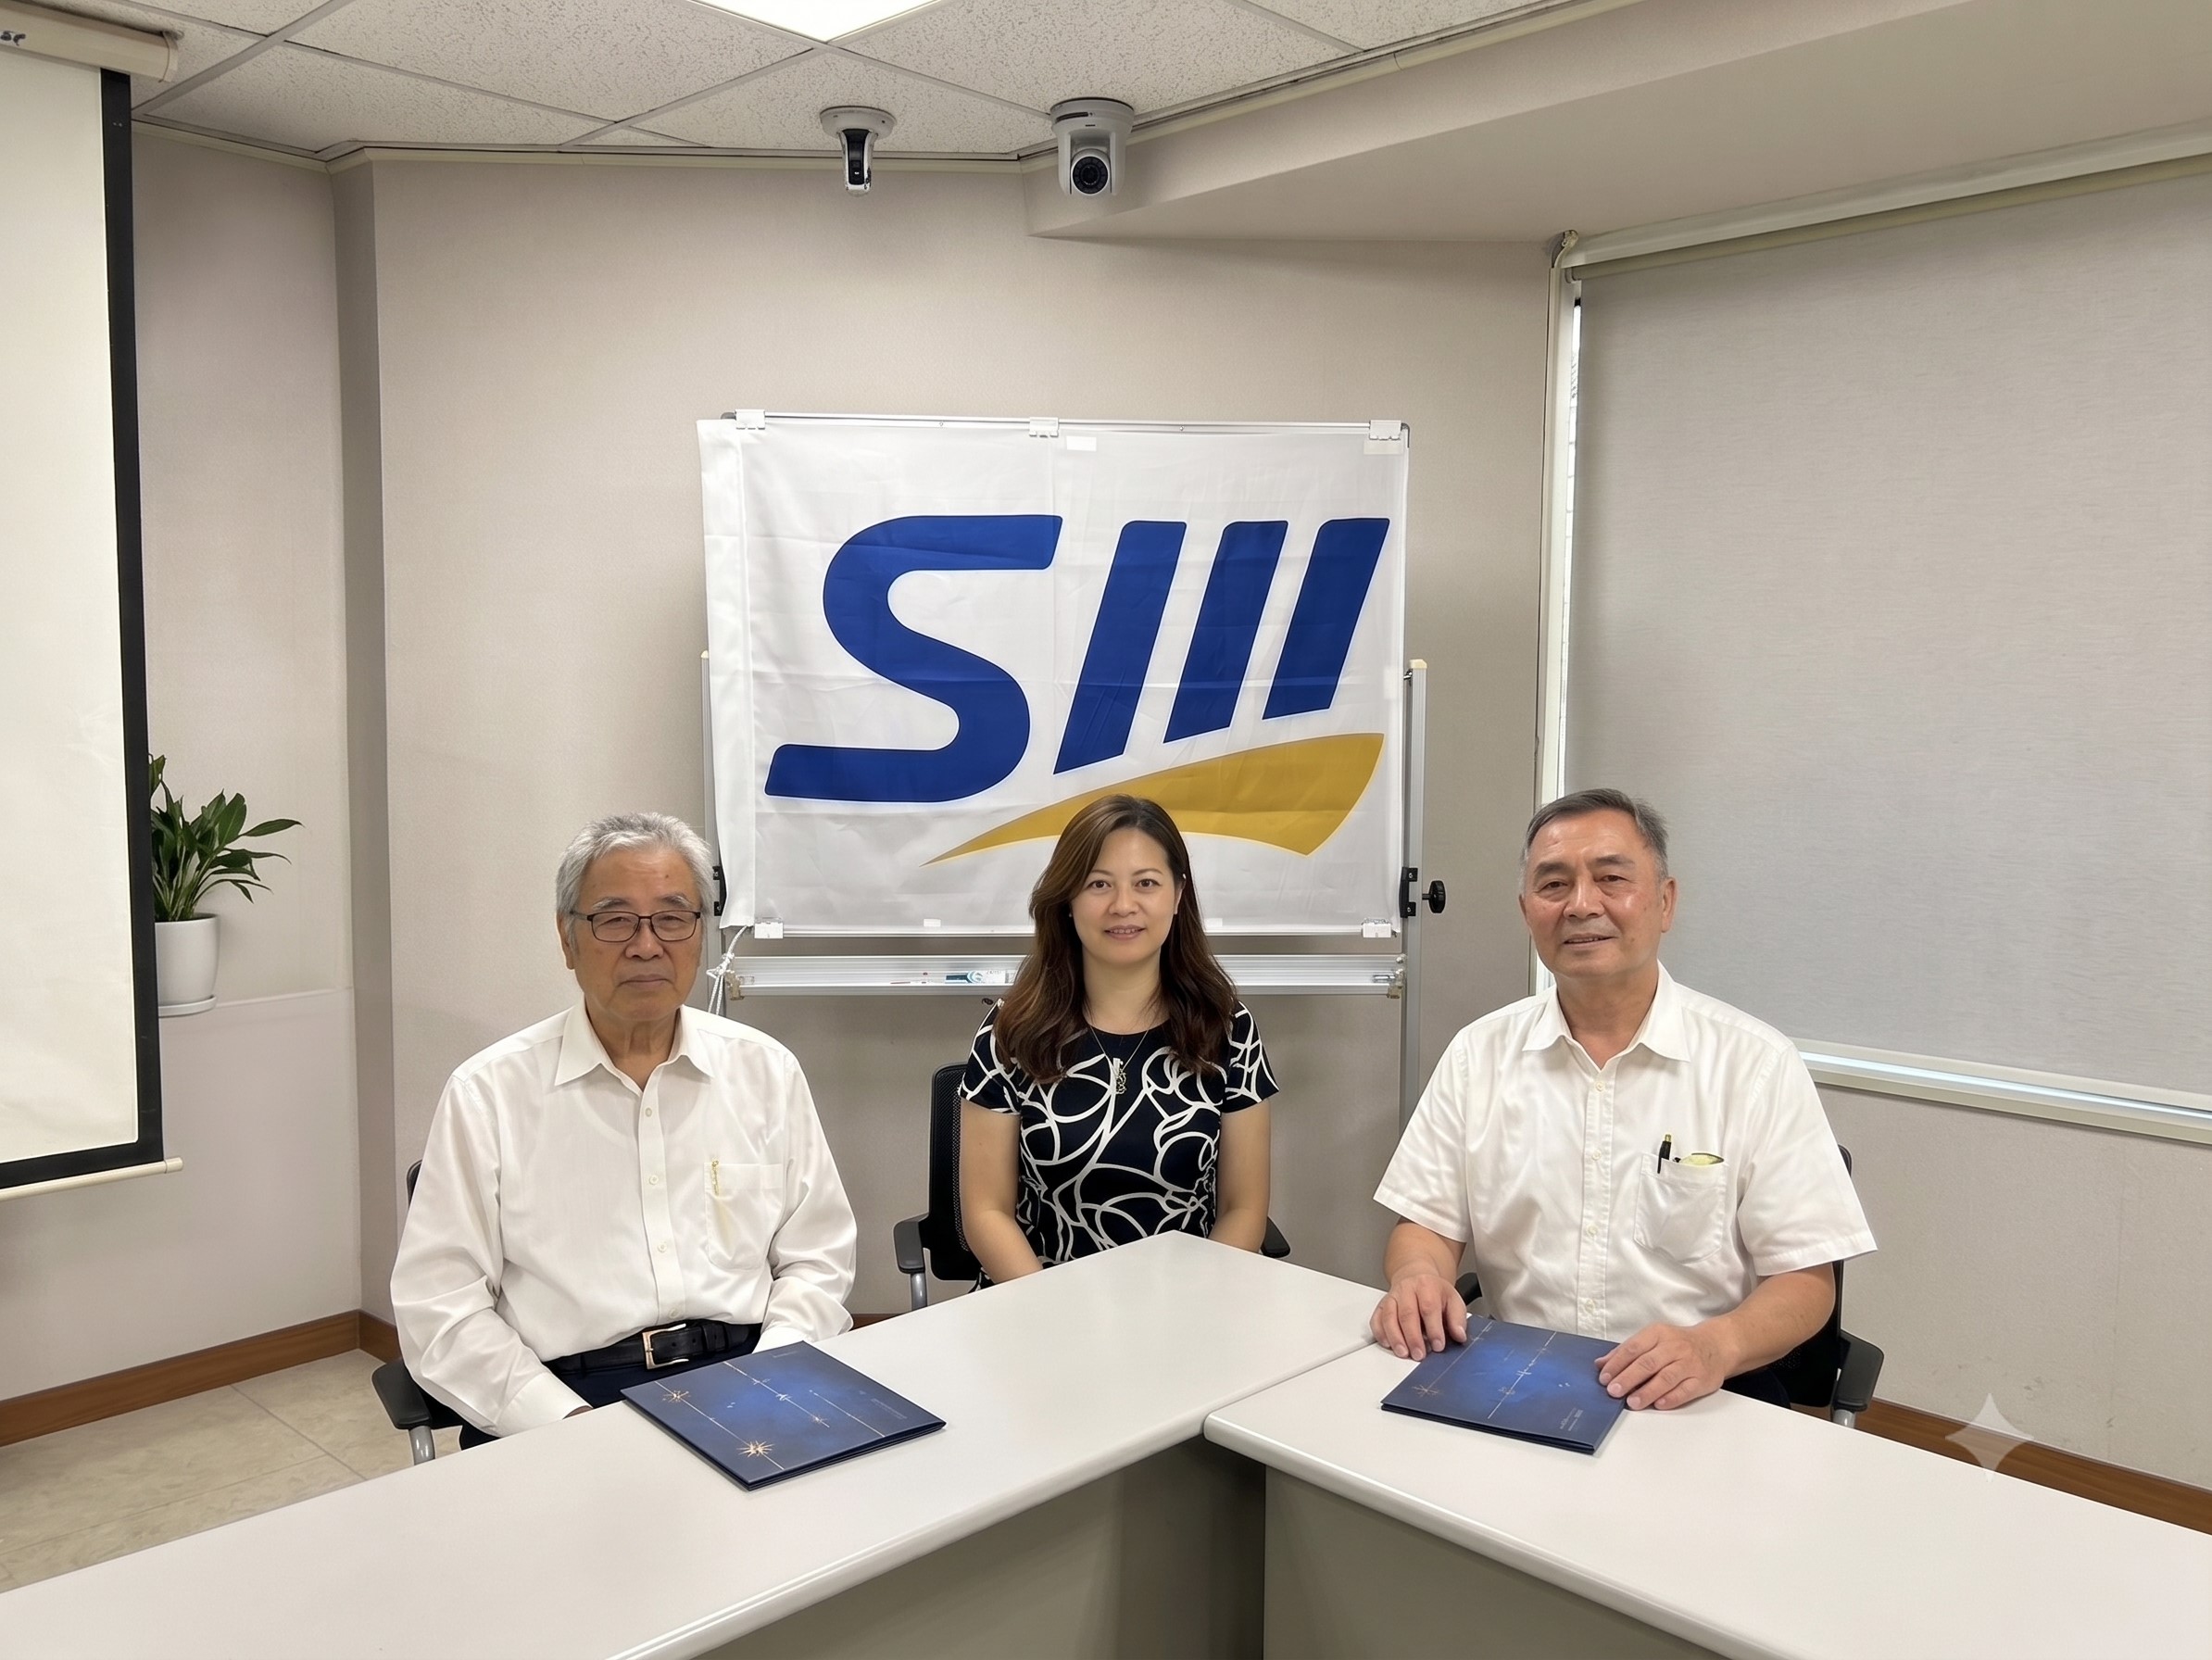
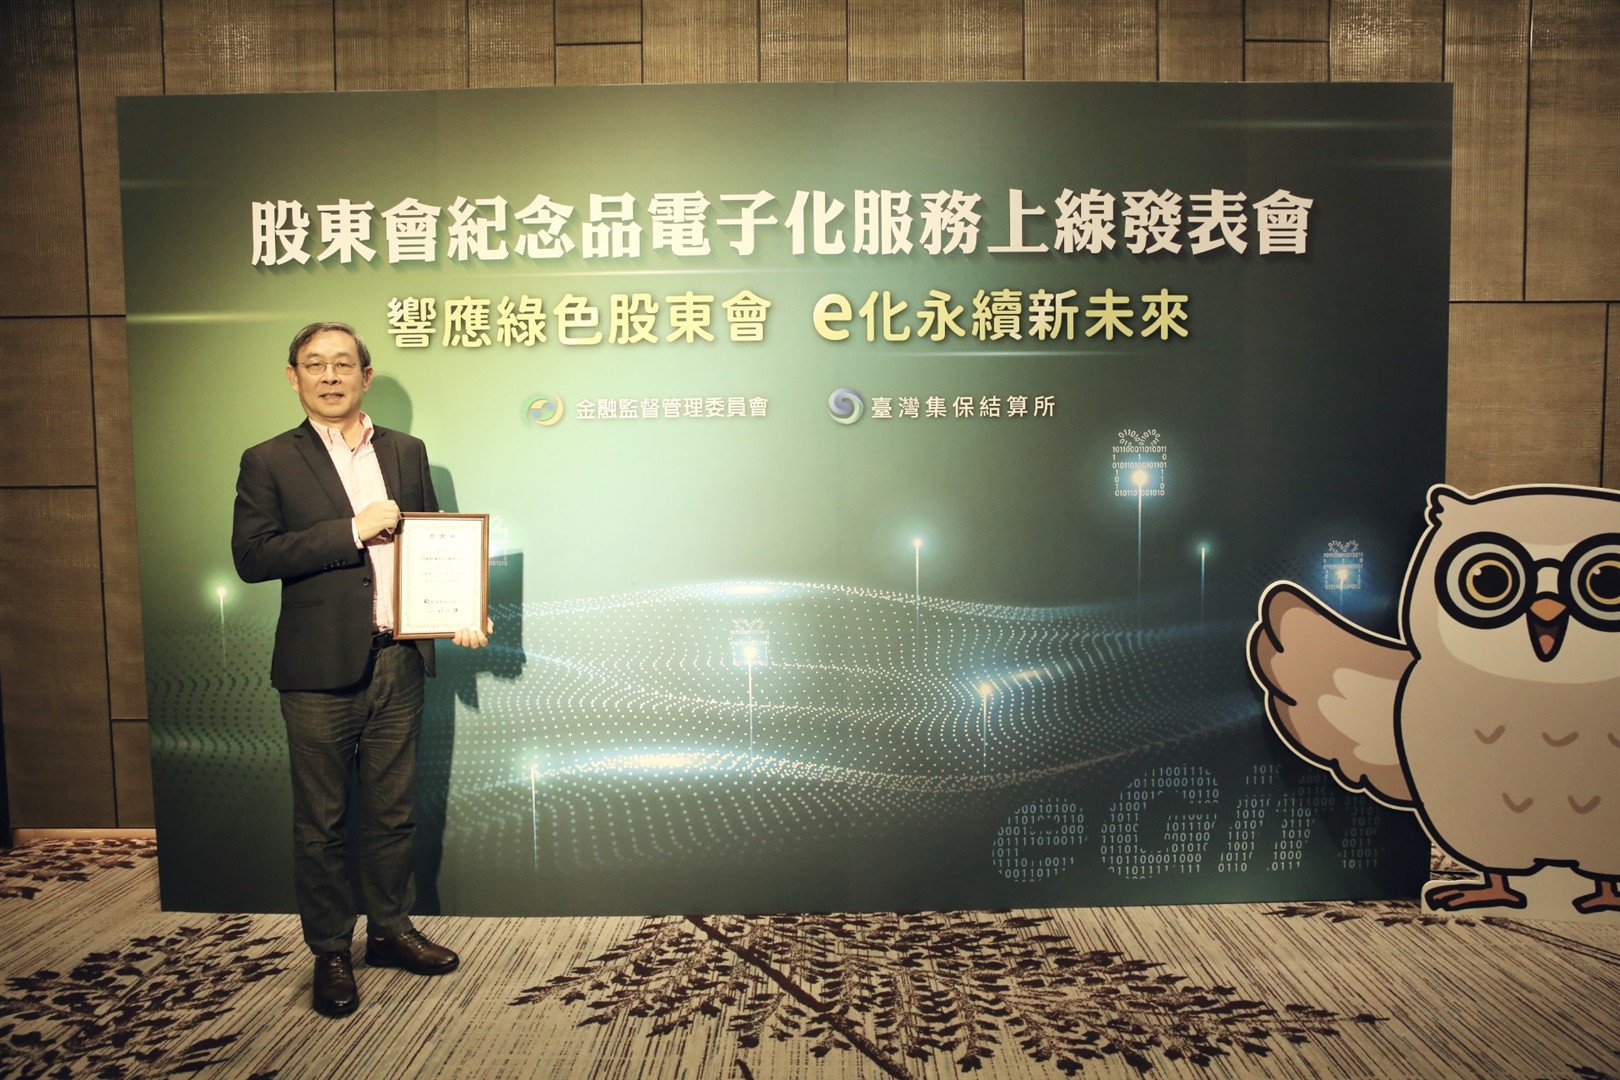
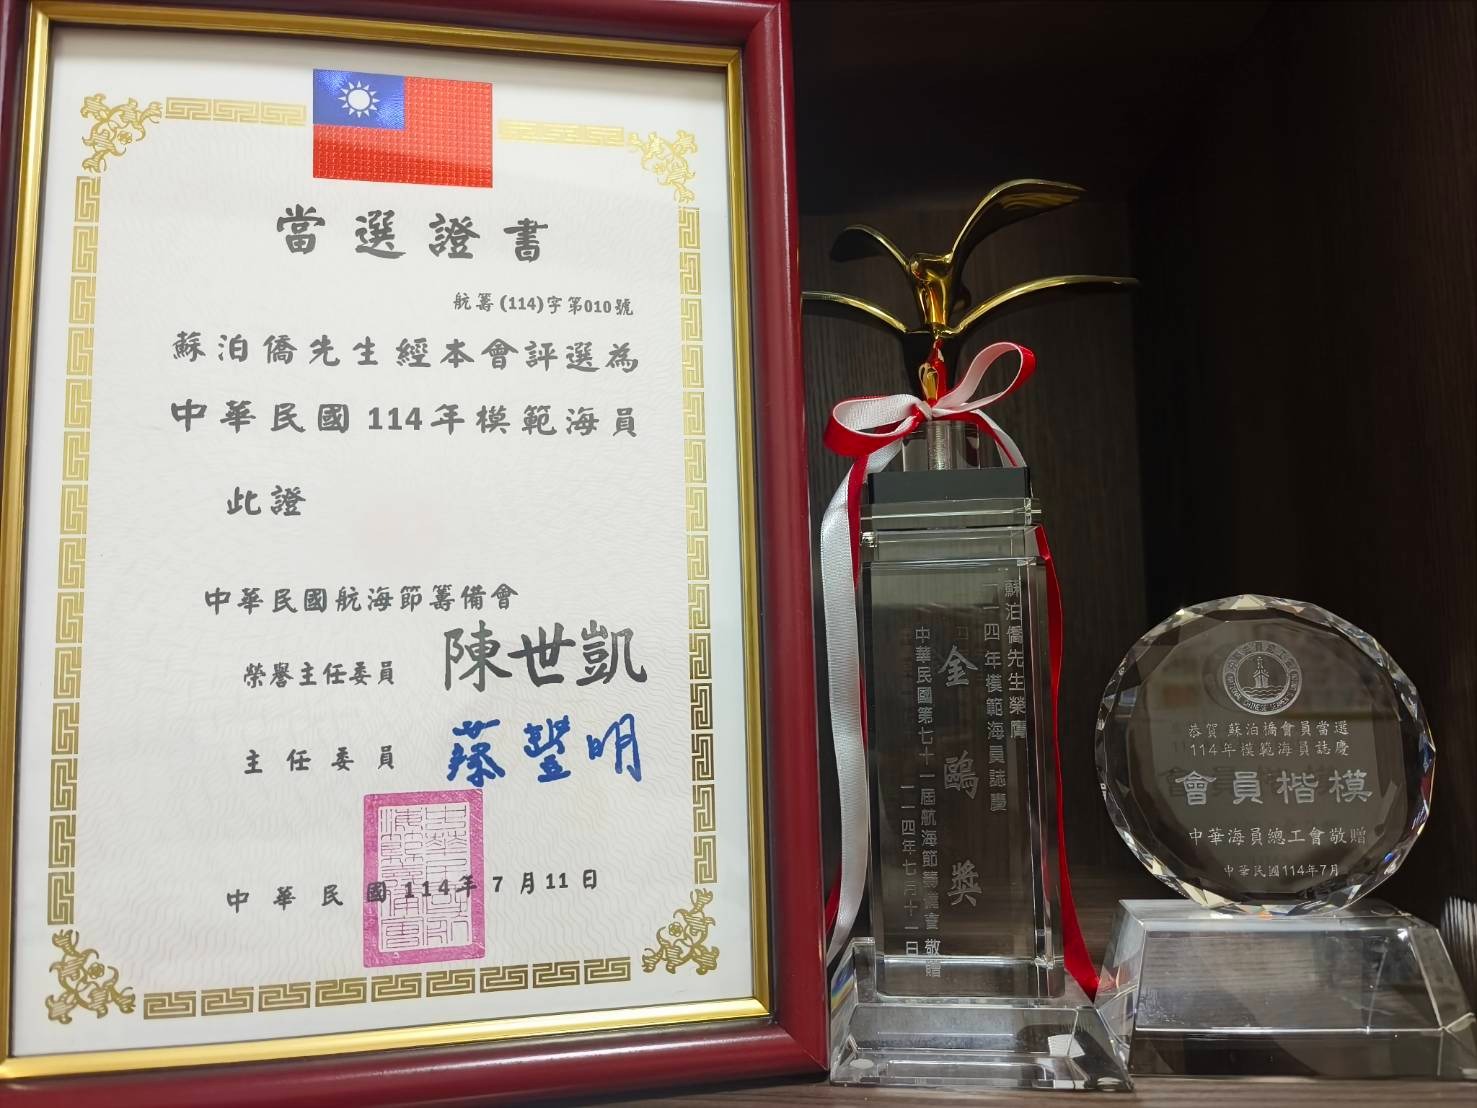

Prompts
Click prompts to add them under the company line, click again to take one out, then copy the result into your AI chat. Shared by Asian Century Stocks and Uncovered Thai Stocks. Thank you.
Shih Wei Navigation Co., Ltd. (ticker 5608.TW), listed in Taiwan.
Copied
ETFs Holding Shih Wei Navigation Co., Ltd.
Exchange-traded funds whose newest published daily portfolio holds one of the company's listings, largest weight first.
| ETF | Weight in ETF | Shares | Market value | As of |
|---|---|---|---|---|
| DEXC | 0.01% | 28,000 | $ 13.376K | Nov 12, 2026 |
| DFEV | 0.00% | 214,910 | $ 102.666K | Nov 12, 2026 |
| DFEM | 0.00% | 543,516 | $ 259.645K | Nov 12, 2026 |
| DFAE | 0.00% | 363,189 | $ 173.501K | Nov 12, 2026 |
| DFAX | 0.00% | 135,335 | $ 64.651K | Nov 12, 2026 |
| AVEM | 0.00% | 349,706 | $ 170.134K | Nov 16, 2026 |
| AVES | 0.00% | 133,773 | $ 65.081K | Nov 16, 2026 |
| AVSE | 0.00% | 8,000 | $ 3,892.04 | Nov 16, 2026 |
| AVEE | 0.00% | 4,000 | $ 1,946.02 | Nov 16, 2026 |
| AVXC | 0.00% | 13,000 | $ 6,324.57 | Nov 16, 2026 |