|
Chia Chang Co., Ltd. is a precision metal processing company established in 1985 that provides metal stamping, mold design, and electromechanical integration services. The company serves global customers in the optoelectronics, medical, telecommunications, and new energy sectors. Its product portfolio includes metal structural components for display backlights, internal and external components for network and server communication products, and medical device parts. Chia Chang offers secondary processing services such as anodizing, drilling, laser engraving, hairline finishing, etching, polishing, sandblasting, and printing. The company operates production facilities in Taiwan, Suzhou, Ningbo, and Nanjing, supporting a diverse range of industrial applications from consumer electronics to automotive displays. Summarised from the company's own disclosures, fiscal year ended Oct 2026 |
Industry Metal Fabrication | Homepage chiachang.com |
| Sector Industrials | IR page chiachang.com/tw/investment | |
|
Tags
metal stamping, precision machining, mold design, surface treatment, optoelectronics, medical devices, telecommunications, new energy, display components, server components
|
Press page — |
Metrics
| Valuation | |
|---|---|
| Market cap | NT$ 3.958B |
| Market cap (USD) | $ 120.135M |
| P/E | 14.79 |
| PEG | — |
| P/BV | 0.43 |
| P/S | 0.70 |
| P/OCF | 6.58 |
| P/FCF | — |
| Dividend yield | — |
| Turnover / mcap | — |
| Returns | |
|---|---|
| ROE | 4.8% |
| ROI | 4.8% |
| ROIC | 4.5% |
| Profit margin | 7.2% |
| Growth | |
|---|---|
| Revenue growing | Yes |
| Profits growing | No |
| Revenue up 3y | No |
| Revenue up 5y | No |
| Earnings growth 3y (net profit CAGR) | -12.3% |
| Quality | |
|---|---|
| Profitable | Yes |
| Margin expanding | No |
| Buying back stock | No |
| Diluting (TTM) | No |
| Debt/Equity | — |
| Podcast bulls (TTM) | Sign up |
| Podcast bears (TTM) | Sign up |
| Podcast sentiment (TTM) | Sign up |
| Podcast sentiment % (TTM) | Sign up |
| News sentiment (TTM) | 0 |
| Quality score | 0% |
| Insiders | |
|---|---|
| Buys, 1w | Sign up |
| Buys, 1m | Sign up |
| Buys, 1y | Sign up |
| Sells, 1w | Sign up |
| Sells, 1m | Sign up |
| Sells, 1y | Sign up |
Sign up to see this company's insider trades
| Figure | FY 2025 | FY 2024 | FY 2023 | FY 2022 | FY 2021 | FY 2020 | FY 2019 | FY 2018 | FY 2017 | FY 2016 | FY 2015 | FY 2014 | FY 2013 | FY 2012 | FY 2011 | FY 2010 |
|---|---|---|---|---|---|---|---|---|---|---|---|---|---|---|---|---|
| Revenue | 6.091B | 5.667B | 6.074B | 7.839B | 8.718B | 7.263B | 7.623B | 7.143B | 6.278B | 6.152B | 7.035B | 9.441B | 9.556B | 8.25B | 8.48B | 8.397B |
| Net profit | 435.659M | 593.933M | 615.032M | 644.914M | 908.801M | 677.063M | 649.955M | 641.193M | 249.534M | 325.542M | -529.762M | 393.741M | 498.501M | 613.693M | 656.056M | 800.924M |
| Figure | FY 2025 | FY 2024 | FY 2023 | FY 2022 | FY 2021 | FY 2020 | FY 2019 | FY 2018 | FY 2017 | FY 2016 | FY 2015 | FY 2014 | FY 2013 | FY 2012 | FY 2011 | FY 2010 |
|---|---|---|---|---|---|---|---|---|---|---|---|---|---|---|---|---|
| Share price | 39.1 | 41.35 | 43.5 | 35.35 | 50.3 | 37.95 | — | — | — | — | — | — | — | — | — | — |
| Price performance 12m | -0.05 | -0.05 | 0.23 | -0.3 | 0.33 | — | — | — | — | — | — | — | — | — | — | — |
Sign up to see institutional holdings
Sign UpPodcast Mentions
Sign up to see podcast mentions and sentiment
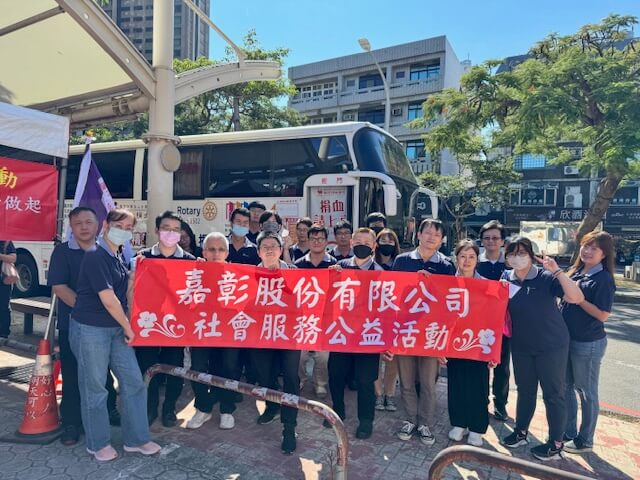
Sign UpMaterial information published on MOPS, newest first, subjects as filed in Chinese, guarantee and loan balance notices and routine equipment purchases included. The link opens the company's material information on MOPS. Press releases from the company's own website, newest first.




Prompts
Click prompts to add them under the company line, click again to take one out, then copy the result into your AI chat. Shared by Asian Century Stocks and Uncovered Thai Stocks. Thank you.
ETFs Holding Chia Chang Co., Ltd
Exchange-traded funds whose newest published daily portfolio holds one of the company's listings, largest weight first.