本公司新增背書保證金額達公告標準
Bull 0
Bear 0
Routine
4912.TW
|
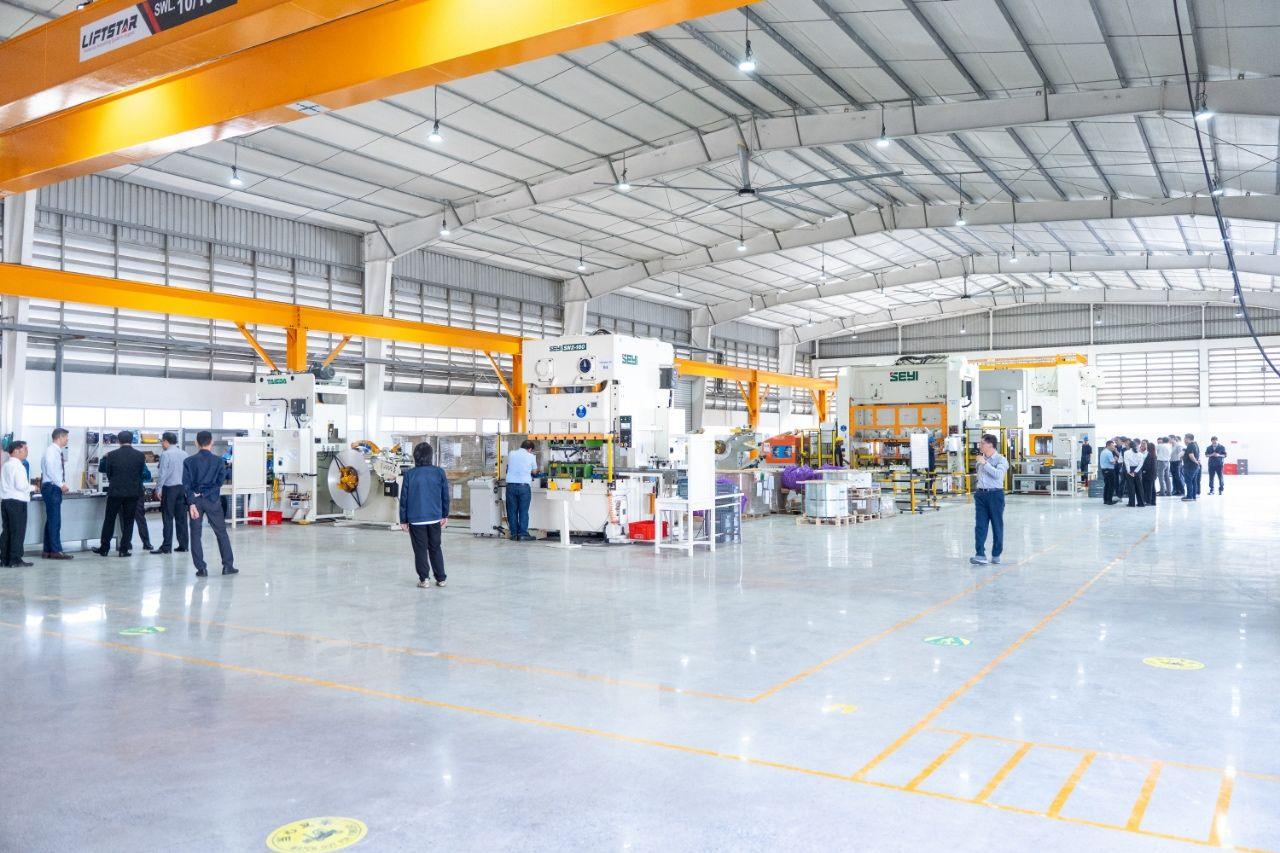
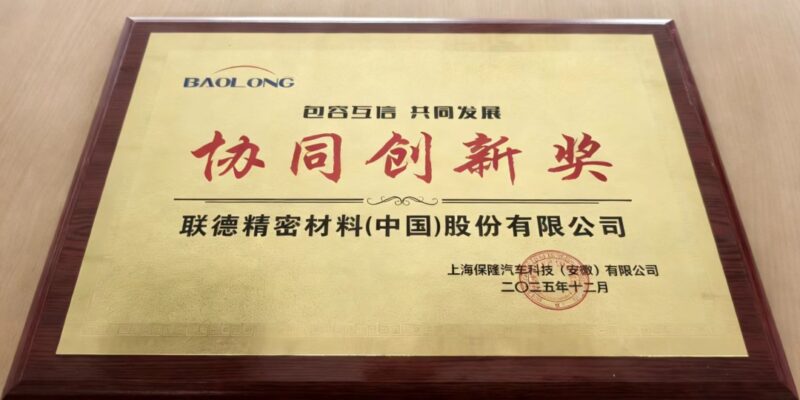
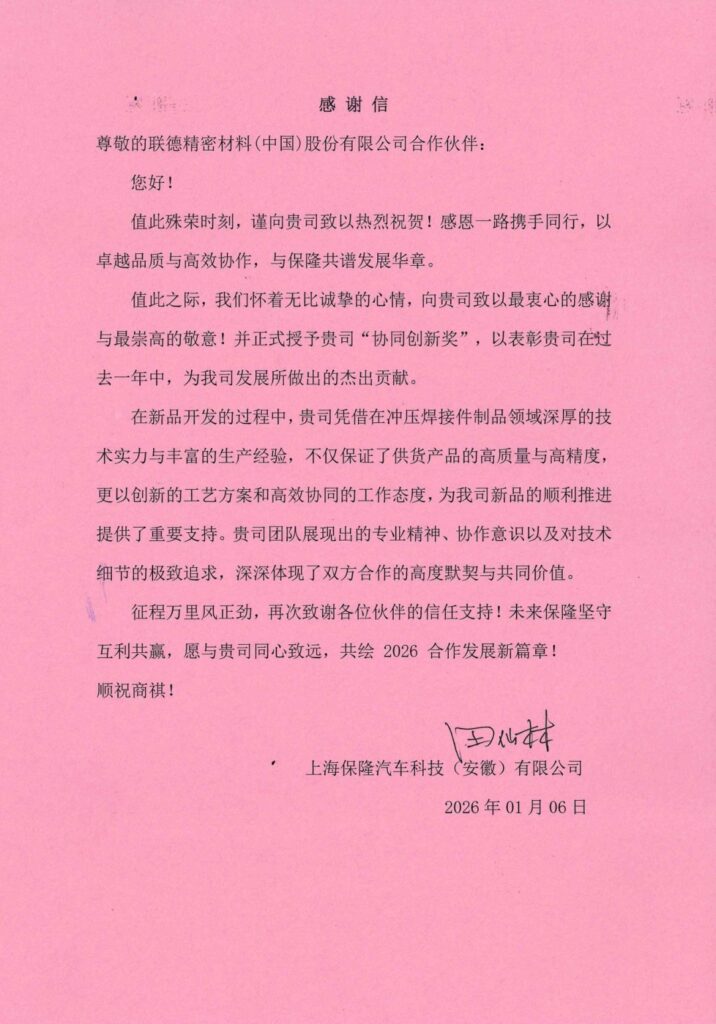
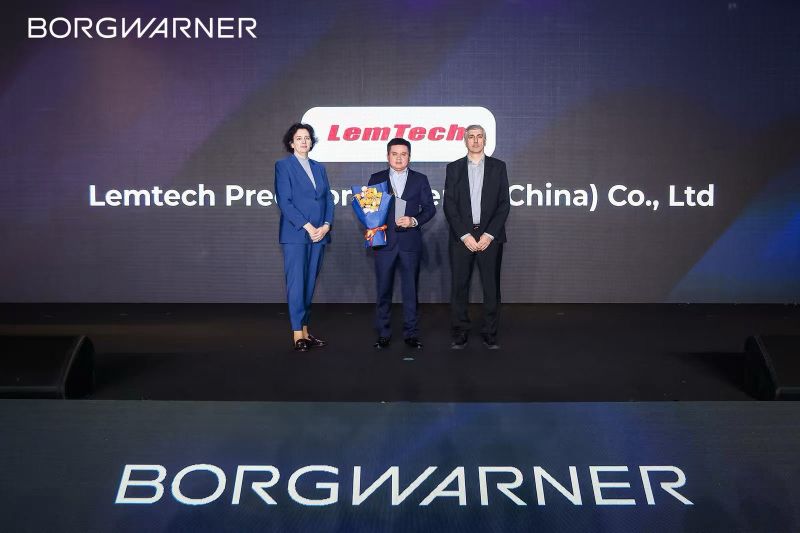
Lemtech Holdings Co., Limited is a precision manufacturing and engineering company founded in 2003. The company operates through three main divisions: Automotive & Precision Stamping (APS), which produces high-complexity stampings, weldments, and automated sub-assemblies; Advanced Thermal Solutions (ATS), which manufactures heatsink modules, vapor chambers, liquid cooling cold plates, thermosiphons, and radiators for AI blade servers and rack-level cooling; and Assembly and Integration (A&I), which provides mechanical and electromechanical assemblies, final assembly, test, and pack (FATP) solutions for AI cloud infrastructure and smart fitness devices. Lemtech serves the automotive, computing, and electronics sectors, with a focus on AI infrastructure and mobility applications. The company operates across three continents and maintains partnerships with major industrial clients, including ZF Lifetec, MINTH Group, and BorgWarner. Its product portfolio includes precision metal stamping, weldments, overmolding, precision tooling, heat pipes, slide rail kits, and racks and enclosures. Summarised from the company's own disclosures, fiscal year ended Oct 2026 |
Industry Auto Parts | Homepage lemtech.com |
| Sector Consumer Cyclical | IR page lemtech.com/investor | |
|
Tags
precision stamping, thermal management, heatsinks, vapor chambers, liquid cooling, automotive components, electromechanical assembly, ai infrastructure, metal fabrication, weldments, APS Division, ATS Division, A&I Division, ZF Lifetec, MINTH Group, BorgWarner
|
Press page — |
Metrics
| Valuation | |
|---|---|
| Market cap | NT$ 4.961B |
| Market cap (USD) | $ 150.586M |
| P/E | 17.68 |
| PEG | — |
| P/BV | 1.15 |
| P/S | 0.64 |
| P/OCF | 7.55 |
| P/FCF | — |
| Dividend yield | — |
| Turnover / mcap | — |
| Returns | |
|---|---|
| ROE | 3.4% |
| ROI | 3.3% |
| ROIC | 7.2% |
| Profit margin | 2.1% |
| Growth | |
|---|---|
| Revenue growing | Yes |
| Profits growing | No |
| Revenue up 3y | No |
| Revenue up 5y | No |
| Earnings growth 3y (net profit CAGR) | -30.9% |
| Quality | |
|---|---|
| Profitable | Yes |
| Margin expanding | No |
| Buying back stock | No |
| Diluting (TTM) | Yes |
| Debt/Equity | — |
| Podcast bulls (TTM) | Sign up |
| Podcast bears (TTM) | Sign up |
| Podcast sentiment (TTM) | Sign up |
| Podcast sentiment % (TTM) | Sign up |
| News sentiment (TTM) | 0 |
| Quality score | 0% |
| Insiders | |
|---|---|
| Buys, 1w | Sign up |
| Buys, 1m | Sign up |
| Buys, 1y | Sign up |
| Sells, 1w | Sign up |
| Sells, 1m | Sign up |
| Sells, 1y | Sign up |
Sign up to see this company's insider trades
| Figure | FY 2025 | FY 2024 | FY 2023 | FY 2022 | FY 2021 | FY 2020 | FY 2019 | FY 2018 | FY 2017 | FY 2016 | FY 2015 | FY 2014 | FY 2013 | FY 2012 | FY 2011 | FY 2010 |
|---|---|---|---|---|---|---|---|---|---|---|---|---|---|---|---|---|
| Revenue | 6.275B | 5.8B | 4.664B | 5.985B | 6.369B | 5.471B | 5.043B | 6.043B | 4.256B | 3.197B | 2.927B | 3.068B | 2.115B | 1.933B | 1.16B | 1.019B |
| Net profit | 128.985M | 401.977M | 260.095M | 390.763M | 465.717M | 455.845M | 259.447M | 382.474M | 298.368M | 67.688M | 196.32M | 221.406M | 131.234M | 204.396M | 107.667M | 82.885M |
| Figure | FY 2025 | FY 2024 | FY 2023 | FY 2022 | FY 2021 | FY 2020 | FY 2019 | FY 2018 | FY 2017 | FY 2016 | FY 2015 | FY 2014 | FY 2013 | FY 2012 | FY 2011 | FY 2010 |
|---|---|---|---|---|---|---|---|---|---|---|---|---|---|---|---|---|
| Share price | 96.7 | 160 | 81.8 | 79 | 160 | 109.5 | — | — | — | — | — | — | — | — | — | — |
| Price performance 12m | -0.4 | 0.96 | 0.04 | -0.51 | 0.46 | — | — | — | — | — | — | — | — | — | — | — |
Sign up to see institutional holdings
Sign UpPodcast Mentions
Sign up to see podcast mentions and sentiment
Sign UpMaterial information published on MOPS, newest first, subjects as filed in Chinese, guarantee and loan balance notices and routine equipment purchases included. The link opens the company's material information on MOPS. Press releases from the company's own website, newest first.
本公司新增資金貸與金額達「公開發行公司資金貸與及背書 保證處理準則」第22條第1項第3款之規定
Bull 0
Bear 0
Routine
代子公司聯德精密工業股份有限公司公告取得聯德動能股份有限公司100%股權
Bull 1
Bear 0
M&A

 汽车
 人工智能云计算
 互联健身
 3C
 建筑
 工业
 精密金属冲压和焊接件
 包覆成型
 精密工具
 热管和蒸汽腔散热器
 热虹吸管
 液体冷却/冷板
 机电组件
 机架和机柜
 滑轨套件
 财务
 年度报告
 公司治理
 股东服务
 关于
 地点
 新闻
 可持续发展承诺
 利益相关方
 资讯安全
 人才发展
 环境、社会及治理 报告与政策
 简体中文
 English
 繁體中文





Prompts
Click prompts to add them under the company line, click again to take one out, then copy the result into your AI chat. Shared by Asian Century Stocks and Uncovered Thai Stocks. Thank you.
Lemtech Holdings Co., Limited (ticker 4912.TW), listed in Taiwan.
Copied
ETFs Holding Lemtech Holdings Co., Limited
Exchange-traded funds whose newest published daily portfolio holds one of the company's listings, largest weight first.
| ETF | Weight in ETF | Shares | Market value | As of |
|---|---|---|---|---|
| DFEV | 0.00% | 20,750 | $ 54.881K | Nov 12, 2026 |
| DFEM | 0.00% | 62,600 | $ 165.569K | Nov 12, 2026 |
| DFAE | 0.00% | 37,550 | $ 99.315K | Nov 12, 2026 |
| DEXC | 0.00% | 1,000 | $ 2,644.87 | Nov 12, 2026 |
| DFAX | 0.00% | 31,866 | $ 84.281K | Nov 12, 2026 |
| AVEM | 0.00% | 112,350 | $ 277.533K | Nov 16, 2026 |
| AVEE | 0.00% | 1,050 | $ 2,593.77 | Nov 16, 2026 |
| AVXC | 0.00% | 2,150 | $ 5,311.04 | Nov 16, 2026 |