本公司及子公司收到返還貨款、賠償倉儲費之民事起訴狀。
Bull 0
Bear 1
Legal
4540.TW
|
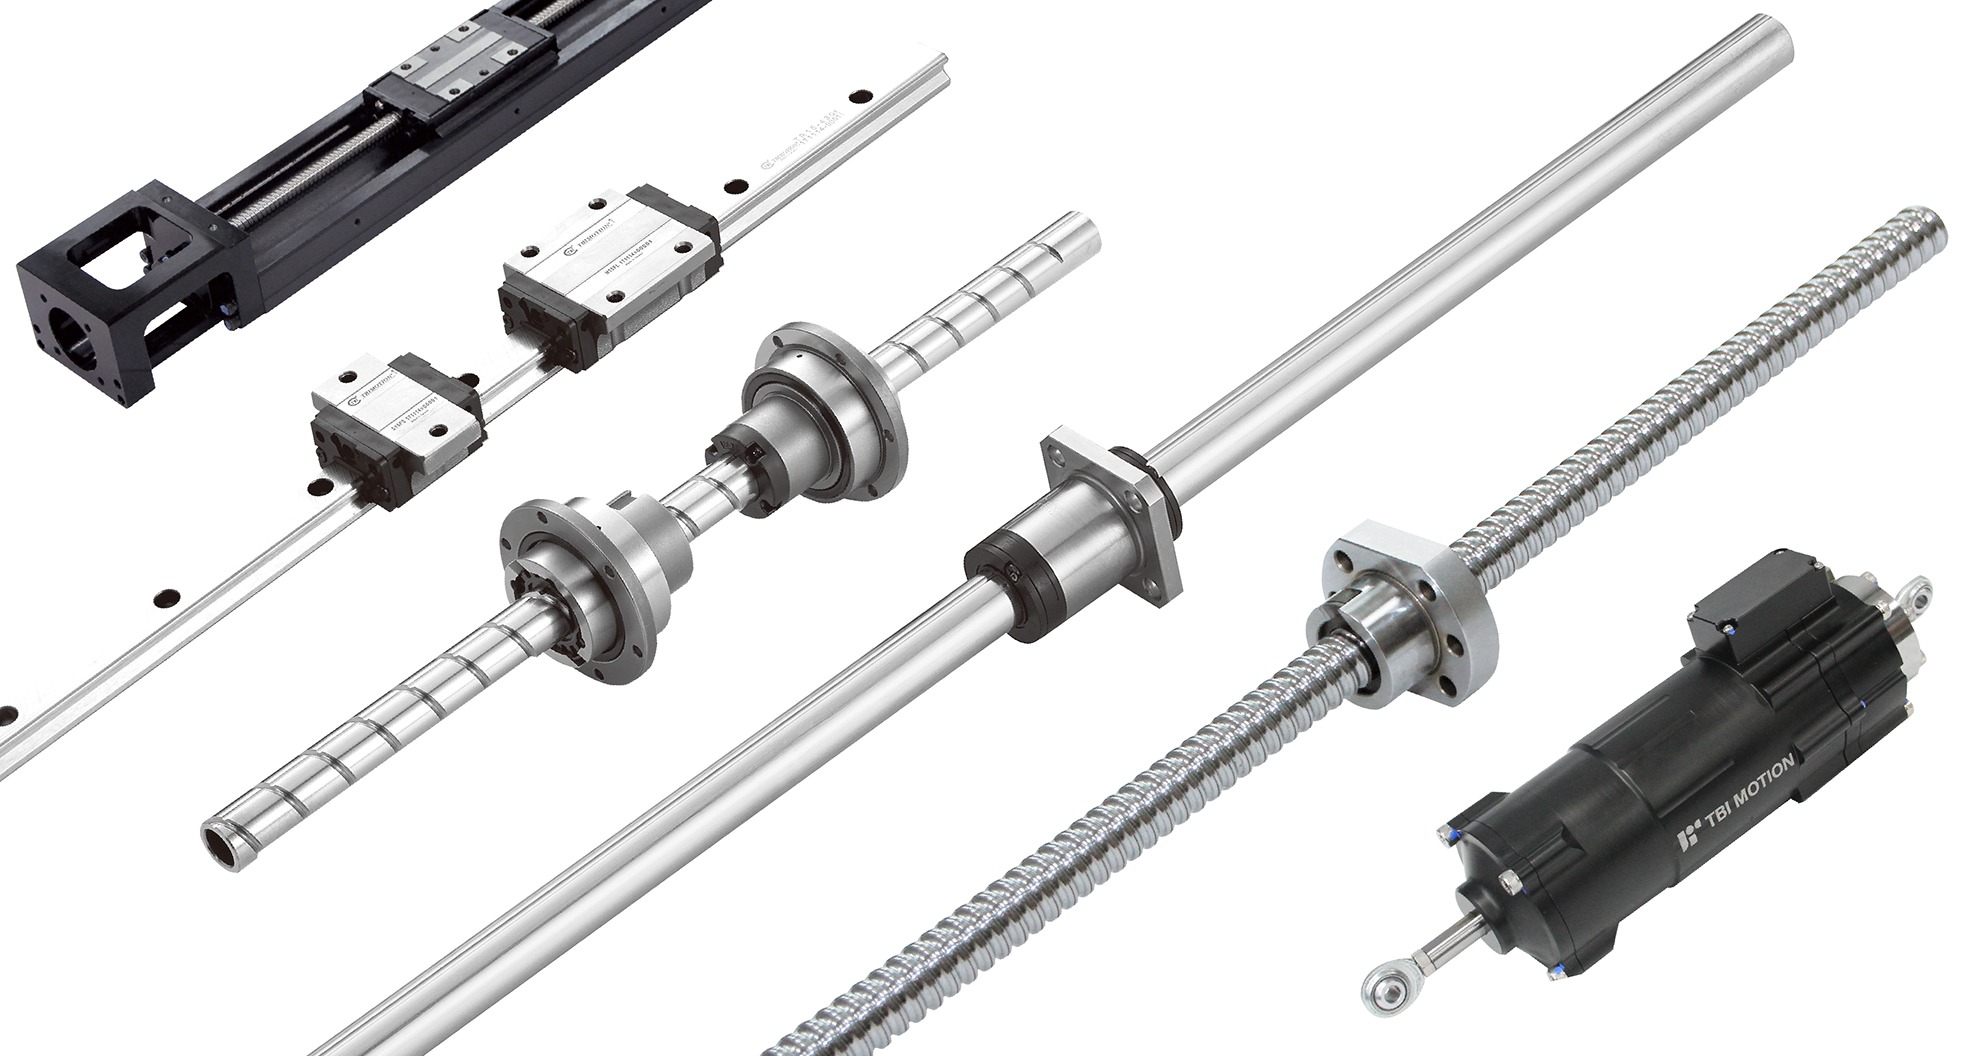
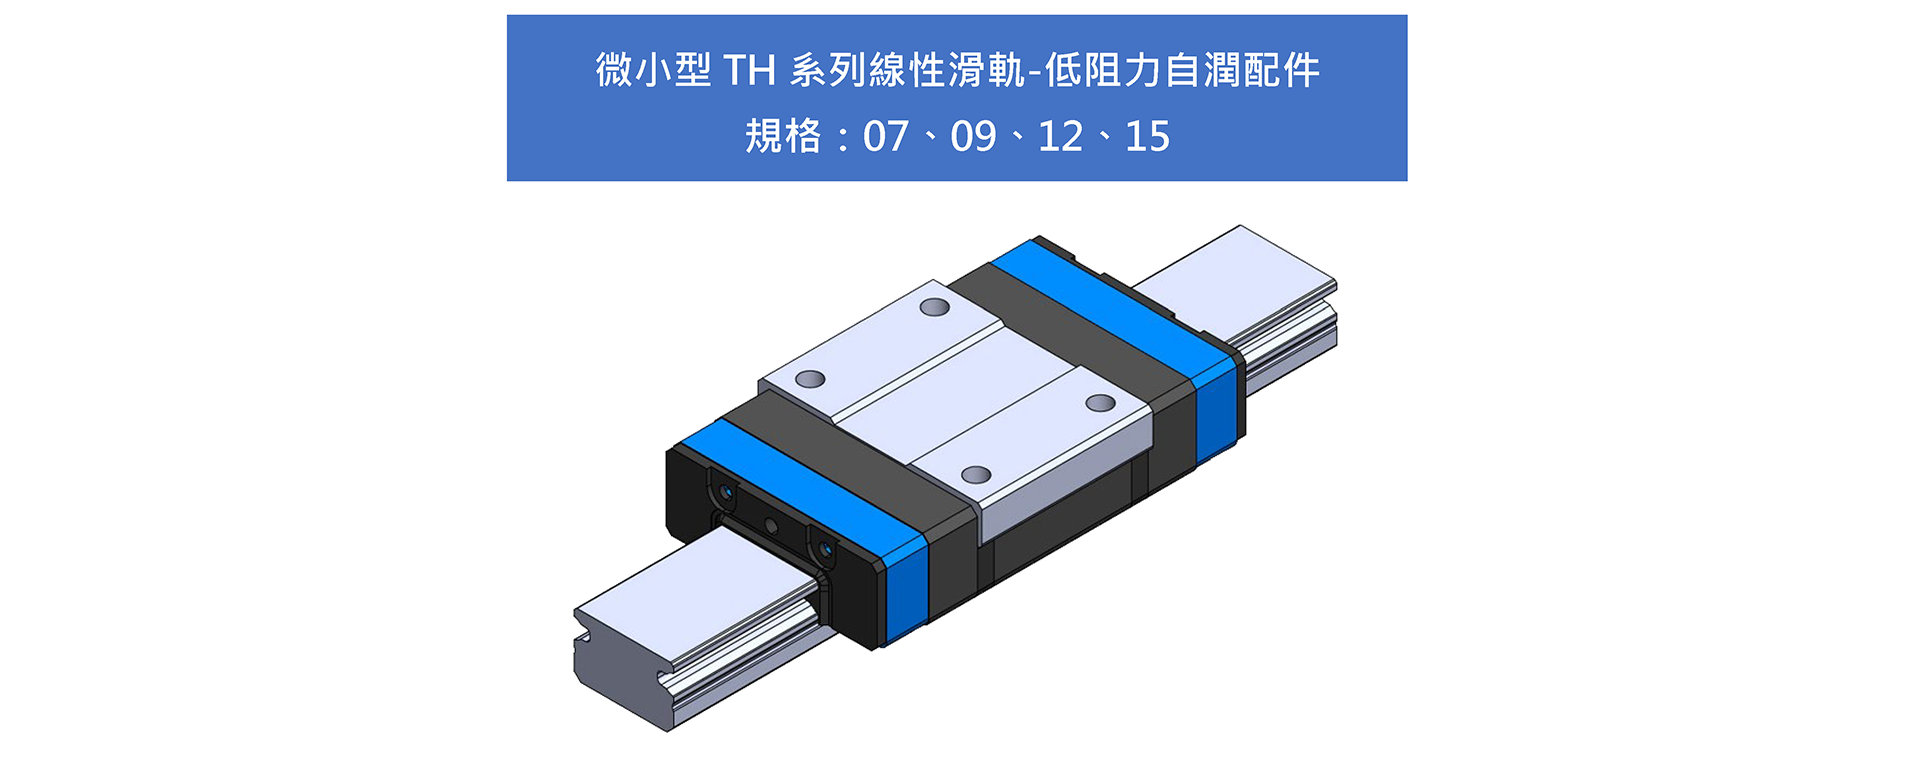
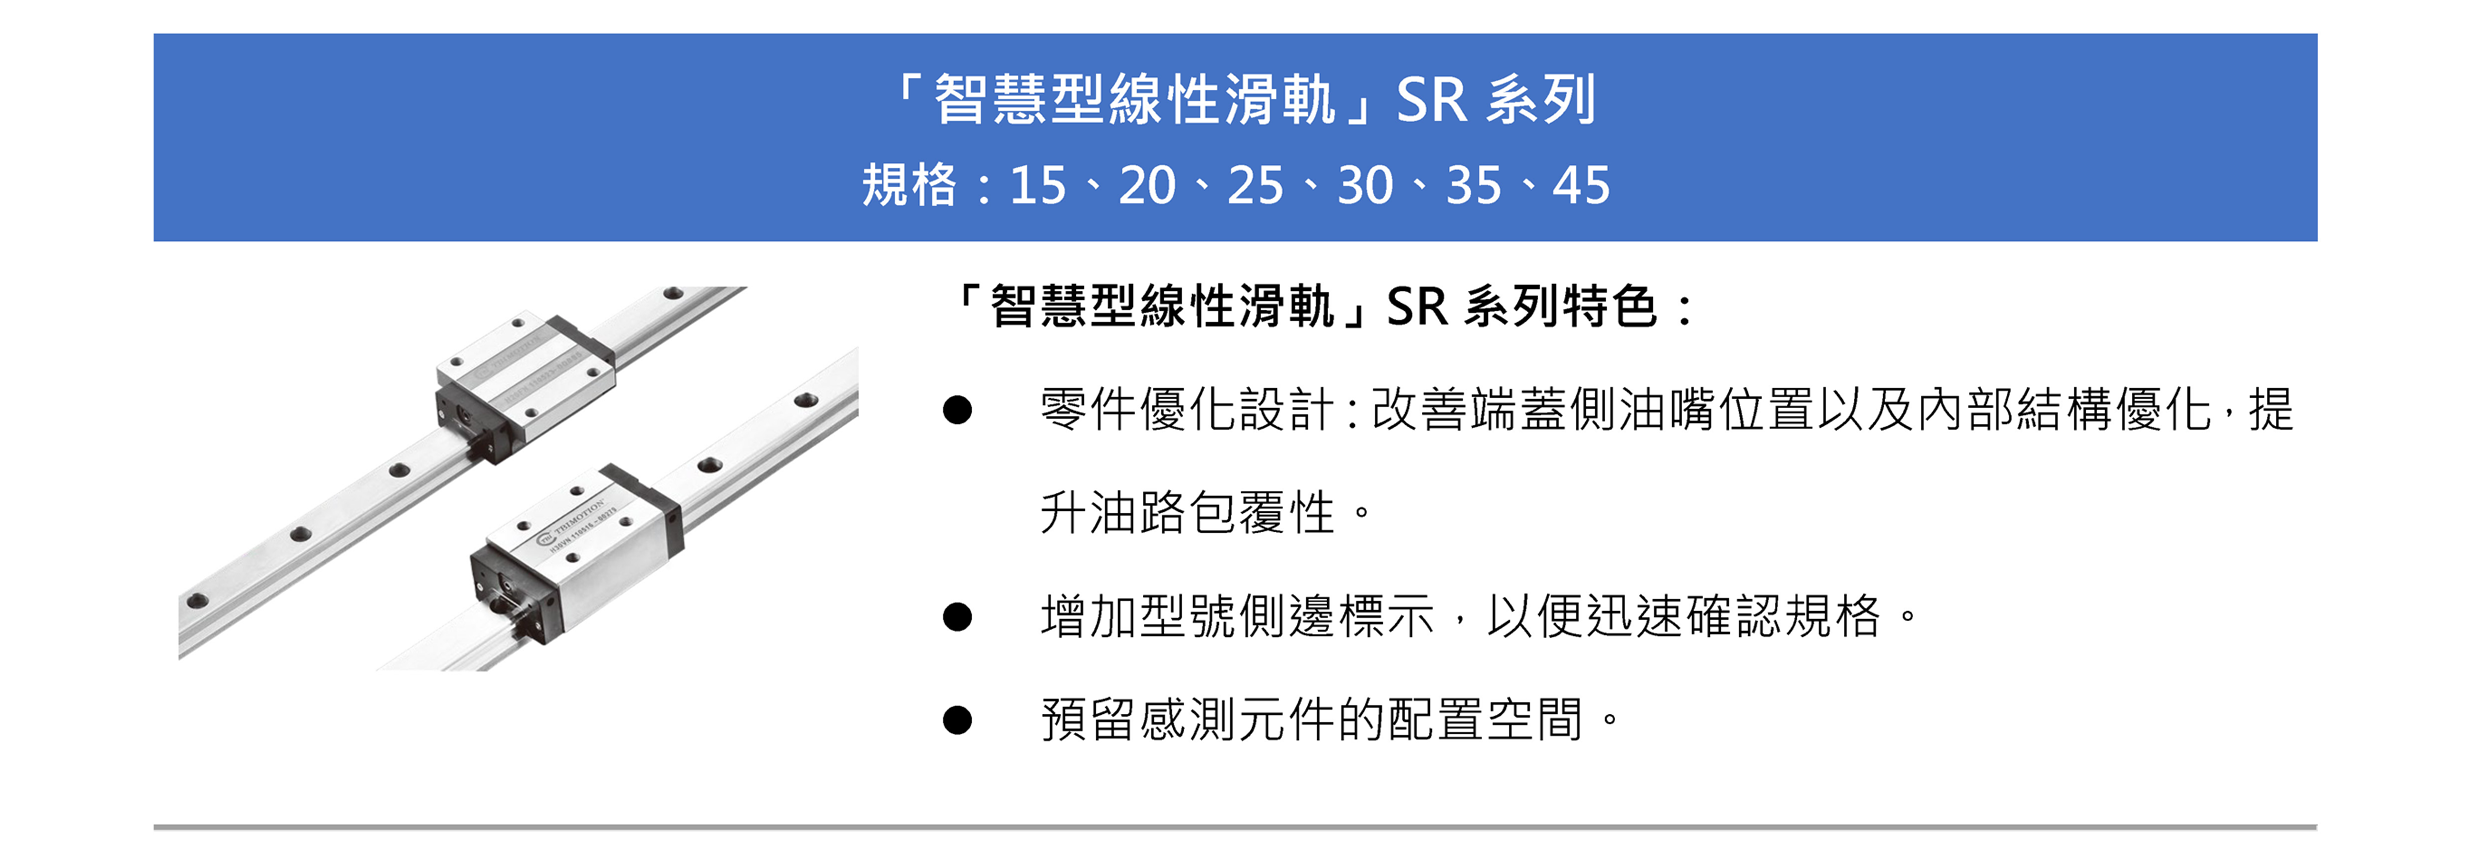
Tbi Motion Technology Co., Ltd. is a manufacturer of linear motion components, specializing in the production of ball screws, linear guides, ball splines, and rotary parts. The company provides technical support and automation solutions for the automation, semiconductor, and medical industries. Its product portfolio includes single-axis robot components, linear bearings, shafts, couplings, and locking nuts, as well as specialized series such as the CR ball chain linear guide and the SR smart linear guide. The company holds patents for internal, external, and end-cap circulation systems for ball screws. Founded in 1986, the group operates through a global distribution network and an international sales team known as Quan Chuan Intelligent, which leverages the parent company's manufacturing expertise to offer diverse product options and comprehensive service. Summarised from the company's own disclosures, fiscal year ended Oct 2026 |
Industry Industrial Distribution | Homepage tbimotion.com.tw |
| Sector Industrials | IR page tbimotion.com.tw/investors | |
|
Tags
linear motion components, ball screws, linear guides, ball splines, automation, semiconductor equipment, medical devices, rotary parts, couplings, linear bearings, CR series, SR series, Quan Chuan Intelligent
|
Press page tbimotion.com.tw/news |
Metrics
| Valuation | |
|---|---|
| Market cap | NT$ 4.855B |
| Market cap (USD) | $ 147.372M |
| P/E | 28.87 |
| PEG | — |
| P/BV | 1.35 |
| P/S | 1.46 |
| P/OCF | 7.72 |
| P/FCF | — |
| Dividend yield | — |
| Turnover / mcap | — |
| Returns | |
|---|---|
| ROE | -2.2% |
| ROI | -2.1% |
| ROIC | -4.4% |
| Profit margin | -2.9% |
| Growth | |
|---|---|
| Revenue growing | No |
| Profits growing | Yes |
| Revenue up 3y | No |
| Revenue up 5y | No |
| Earnings growth 3y (net profit CAGR) | — |
| Quality | |
|---|---|
| Profitable | No |
| Margin expanding | No |
| Buying back stock | No |
| Diluting (TTM) | Yes |
| Debt/Equity | — |
| Podcast bulls (TTM) | Sign up |
| Podcast bears (TTM) | Sign up |
| Podcast sentiment (TTM) | Sign up |
| Podcast sentiment % (TTM) | Sign up |
| News sentiment (TTM) | 0 |
| Quality score | -56.3% |
| Insiders | |
|---|---|
| Buys, 1w | Sign up |
| Buys, 1m | Sign up |
| Buys, 1y | Sign up |
| Sells, 1w | Sign up |
| Sells, 1m | Sign up |
| Sells, 1y | Sign up |
Sign up to see this company's insider trades
| Figure | FY 2025 | FY 2024 | FY 2023 | FY 2022 | FY 2021 | FY 2020 | FY 2019 | FY 2018 | FY 2017 | FY 2016 | FY 2015 | FY 2014 |
|---|---|---|---|---|---|---|---|---|---|---|---|---|
| Revenue | 2.559B | 2.294B | 2.571B | 3.374B | 3.285B | 2.74B | 2.108B | 3.418B | 2.709B | 1.745B | 1.62B | 1.748B |
| Net profit | -74.067M | -486.652M | -103.612M | 284.011M | 237.3M | 91.424M | -61.507M | 621.535M | 213.472M | 46.265M | 25.444M | 98.249M |
| Figure | FY 2025 | FY 2024 | FY 2023 | FY 2022 | FY 2021 | FY 2020 | FY 2019 | FY 2018 | FY 2017 | FY 2016 | FY 2015 | FY 2014 |
|---|---|---|---|---|---|---|---|---|---|---|---|---|
| Share price | 34.4 | 61.5 | 32.3 | 36.45 | 49.95 | 55.3 | — | — | — | — | — | — |
| Price performance 12m | -0.44 | 0.9 | -0.11 | -0.27 | -0.1 | — | — | — | — | — | — | — |
Sign up to see institutional holdings
Sign UpPodcast Mentions
Sign up to see podcast mentions and sentiment
Sign UpMaterial information published on MOPS, newest first, subjects as filed in Chinese, guarantee and loan balance notices and routine equipment purchases included. The link opens the company's material information on MOPS. Press releases from the company's own website, newest first.
公告本公司發行國內第三次有擔保轉換公司債代收價款行 庫及存儲專戶行庫
Bull 0
Bear 0
Routine
代子公司全傳科技(江蘇)有限公司公告向本公司取得機器設備,一年內累計交易 金額達公告申報標準
Bull 0
Bear 0
Routine







Prompts
Click prompts to add them under the company line, click again to take one out, then copy the result into your AI chat. Shared by Asian Century Stocks and Uncovered Thai Stocks. Thank you.
Tbi Motion Technology Co., Ltd. (ticker 4540.TW), listed in Taiwan.
Copied
ETFs Holding Tbi Motion Technology Co., Ltd.
Exchange-traded funds whose newest published daily portfolio holds one of the company's listings, largest weight first.
| ETF | Weight in ETF | Shares | Market value | As of |
|---|---|---|---|---|
| AVEE | 0.01% | 8,000 | $ 11.804K | Nov 16, 2026 |
| DFEM | 0.00% | 156,000 | $ 246.992K | Nov 12, 2026 |
| DFSE | 0.00% | 7,000 | $ 11.083K | Nov 12, 2026 |
| DFAE | 0.00% | 92,000 | $ 145.662K | Nov 12, 2026 |
| DFEV | 0.00% | 20,000 | $ 31.666K | Nov 12, 2026 |
| DFAX | 0.00% | 83,000 | $ 131.412K | Nov 12, 2026 |
| AVEM | 0.00% | 69,000 | $ 101.806K | Nov 16, 2026 |
| AVES | 0.00% | 24,000 | $ 35.411K | Nov 16, 2026 |
| AVXC | 0.00% | 8,000 | $ 11.804K | Nov 16, 2026 |