ASRock ====== Menu AI Products Campaigns Blog News Support Where to Buy Search All Motherboards Graphics Card Gaming Monitor Power Supply Mini PC AIO Liquid Coolers Industrial PC Server/WS ASRock CoreExperience 2026 ASRock Intel Motherboard Bundle…
ASRock
======
 Menu
Motherboards
Graphics Card
Gaming Monitor
Power Supply

Mini PC
AIO Liquid Coolers
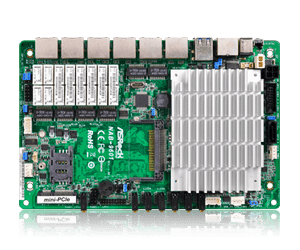
Industrial PC
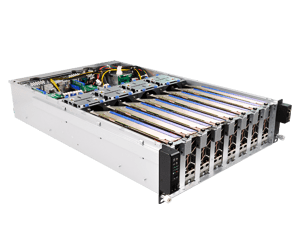
Server/WS

ASRock CoreExperience 2026

ASRock Intel Motherboard Bundle 26Q3
Taichi 10th Anniversary Website

ASRock Intel XMP Identifier Certified Motherboards
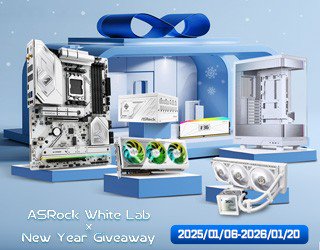
ASRock White Lab

Phantom Gaming
Official Website

Meet ARKY
Phantom Gaming
Room

We use cookies to offer you a more personalized and smoother experience.
By visiting this website, you agree to our use of cookies. If you prefer not to accept cookies or require more information, please visit our Privacy Policy
.
Necessary cookies
These cookies are essential for the proper functioning of the website and cannot be turned off.
Analytics cookies
These cookies help us understand how visitors use our website. Agree?
Marketing cookies
These cookies are used to track visitors and display relevant advertisements. Agree?
Social media cookies
These cookies allow you to share pages and content on social media. Agree?
Terms of Use Notice
-
Terms of Use Notice
-
Privacy Policy
-
NFT Terms & Condition
ALL PRODUCTS AND SERVICES (“SERVICE”) PROVIDED BY ASROCK INCORPORATION. (“ASROCK”) ARE SUBJECT TO THIS TERMS OF USE NOTICE (“NOTICE”). SERVICE MEANS, INCLUDING BUT NOT LIMITED TO, ANY PRODUCT, WEBSITE, WEBSITE EVENT (DEFINED AS BELOW), SOFTWARE, APPLICATION AND INFORMATION PROVIDED UNDER ASROCK BRAND OR ANY OTHER BRAND OWNED BY ASROCK. YOU EXPRESSLY ACKNOWLEDGE THAT YOU HAVE READ THIS NOTICE AND UNDERSTAND THE RIGHTS, OBLIGATIONS, TERMS AND CONDITIONS SET FORTH HEREIN. IF YOU ARE A MINOR, YOU SHALL REGISTER AS THE MEMBER OR ACCESS THE SERVICES ONLY AFTER YOUR PARENTS (OR YOUR GUARDIAN) READ AND UNDERSTAND THE RIGHTS, OBLIGATIONS, TERMS AND CONDITIONS CONTAINED IN THIS NOTICE. BY CONTINUING TO INSTALL, COPY, SURF, DOWNLOAD, ACCESS, PURCHASE, ENTER AND/OR OTHERWISE USE THE SERVICE, YOU OR YOUR PARENTS (OR GUARDIAN) EXPRESSLY CONSENT TO BE BOUND BY THIS NOTICE, INCLUDING UPDATED VERSION, AND ALL APLICABLE LAWS AND REGULATIONS.
Acknowledgement
1.1
YOU acknowledge that this SERVICE will operate only on those designated hardware and software platforms. YOU acknowledge that it is YOUR responsibility to have the appropriate software, hardware and internet connection to operate the then-current version of the SERVICE. ASROCK, in our sole discretion, may modify the SERVICE, terminate any events hold through this SERVICE (“Website Event”), or discontinue any service through SERVICE at any time without notice, and ASROCK also reserve all rights to cease supporting any hardware or software platform at any time without notice.
1.2
YOU acknowledge that some content of the SERVICE is provided by third parties, and YOU also acknowledge that this SERVICE may enable access to third parties’ services or websites. YOU agree to enjoy such services or websites and access at YOUR own discretion and such enjoyment shall be subject to the conditions and terms between YOU and such third parties, including but not limited to price of merchandize, order confirmation system, maximum order amount, product delivery and payment policy. YOU also acknowledge and agree that ASROCK is responsible for neither the agreement between YOU and such third parties nor any content provided by such third parties.
1.3
YOU acknowledge that any software you downloaded or obtained via the SERVICE shall be used in compliance with the End User License Agreement (“EULA”) provided or contained therein.
1.4
YOU acknowledge that nothing in this NOTICE gives YOU a right to use any of ASROCK’s trademarks, service marks, product or service names, slogans, logos or images unless YOU have agreed otherwise in writing with ASROCK.
1.5
YOU acknowledge that this NOTICE may reference other guidelines, notices, agreements or other terms and conditions of website Event provided by ASROCK or any information contained in the SERVICE, and such reference shall constitute an integral part of this NOTICE.
1.6
YOU acknowledge that ASROCK reserves the right to modify this NOTICE at any time, and each such modification shall be effective upon posting on the SERVICE. YOUR continued use of the SERVICE following any such modification will be deemed YOU agree to be bound by and YOUR acceptance of the modified NOTICE. It is therefore important that YOU read and visit this SERVICE on a regular basis to ensure YOU are updated as to the applicable NOTICE. If YOU do not agree to be bound by this NOTICE and to abide by all applicable law, YOU must discontinue using the SERVICE immediately.
1.7
YOU agree that the electronic format is the sole manner of declaration of intention of this SERVICE or NOTICE.
1.8
YOU acknowledge that this NOTICE may reference in order to protect YOUR privileges, YOU shall abide by the Internet application custom. YOU agree the following actions are strictly prohibited:
1.8.1
Any attempt to interfere, invade, or destroy any system or resource on the Internet.
1.8.2
Transmitting materials that are threatening, obscene, pornographic, or destroying the public order and customs.
1.8.3
Spreading computer virus through the network of the SERVICE.
1.8.4
Using any data mining, robots, or similar data gathering and/ or extraction tools. In the event that YOU use any software or tools above, YOU will be disqualified to participate in Website Event.
Intellectual Property Right
2.1
YOU acknowledge that YOU are solely responsible for the information upload, transmit, input or provide to this SERVICE by YOU, and none of such information represents the opinion of ASROCK. For the avoidance of doubt, information includes without limitation to, information, data, text, software, music, sound, photographs, graphics, video, messages or other materials (“Information”).
2.2
When YOU uploaded, transmitted, inputted or provided the Information to this SERVICE, YOU grant ASROCK, its affiliates and subsidiaries, a worldwide, non-exclusive, non-revocable, royalty-free, transferable, sub-licensable right to promote and distribute part or all of the Information in any media formats with any manner, including without limitation to modify, reproduce, public broadcast, public transmission, adapt, distribute, publish, public release, or otherwise use the Information.
2.3
If YOU do not have authorization for the above right, please do not upload, transmit, input or provide Information to this SERVICE.
2.4
If YOU are accused of allegedly infringing any third party IPR, ASROCK reserves the right to terminate and/or restrict YOUR access to the SERVICE.
2.5
All title and intellectual property rights in and to any third party content that is contained in the SERVICE or may be accessed through the use of the SERVICE, is the property of the respective content owners and may be protected by applicable intellectual property related laws and treaties.
2.6
If YOU are aware of any actual or prospective infringement of any content of the SERVICE, or an infringement notification is required in accordance with applicable laws or regulations, please submit the notification to ASROCK Legal Compliance Department with the contact information indicated in this NOTICE, ASROCK will proceed with the corresponding procedure in accordance with applicable laws.
2.7
Upon receipt of an infringement notification from a copyright holder or its agent, ASROCK will remove, disable YOUR access to or may take other actions to alleged infringing content or services in accordance with applicable laws. If YOU believe that such content or services were not infringing, YOU may submit a counter notification to ASROCK Legal Compliance Department with the contact information indicated in this NOTICE, ASROCK will proceed with the corresponding procedure in accordance with applicable laws.
Registration
To use all services provided in this SERVICE, YOU acknowledge and accept the followings:
3.1
YOU are required to provide true, accurate, current and complete information about YOURSELF if prompted and requested by a registration process of ASROCK Account. YOU may access and correct YOUR personal information through this SERVICE at any time.
3.2
YOU may view and change YOUR registration information by logging in and editing YOUR account settings on SERVICE. For the security of YOUR account, YOU will be required to sign in with YOUR login ID and password. YOU are solely and entirely responsible for securing the confidentiality of YOUR password and user name and for any and all activities that occur under YOUR account.
3.3
If ASROCK finds that the account/password of ASROCK Account had been misappropriated, ASROCK may immediately suspend or terminate such ASROCK Account's password, account (or any part thereof) or use of this SERVICE, and remove all the Information related to such ASROCK Account from this SERVICE.
3.4
YOU shall comply with this NOTICE and shall not be in violation of any applicable laws and regulations. ASROCK reserves the right to verify the validity of YOUR membership at any time during or after any Website Event, and reserves the right to disqualify YOU (even a Winner) from any Website Event including YOUR prize qualification who constitutes any misconduct for tampering or suspicion of tampering with Website Event without any notice. Failure of ASROCK to enforce any of its rights hereof does not constitute a waiver of those rights.
Privacy Policy
Due to respect to personal information, ASROCK is committed to protecting and respecting YOUR privacy with ASROCK Privacy Policy
.
License and Restriction
5.1
Subject to the terms of this NOTICE, ASROCK hereby grants YOU a limited, personal, non-commercial, non-exclusive, non-sublicensable, non-assignable, free of charge license to access or enter the SERVICE and its services. Except for rights granted expressly herein, YOU acknowledge that all other rights remain with ASROCK. Any and all rights, including without limitation, in the SERVICE, are and shall remain the exclusive property of ASROCK and/or its licensors. Nothing in this NOTICE intends to transfer any such rights, or to vest any such rights to YOU.
5.2
No Removal of Notices: YOU agree that YOU will not remove, obscure, make illegible or alter any notices or indications of any rights and/or ASROCK’s rights and ownership thereof, whether such notice or indications are affixed on, contained in or otherwise connected to any materials.
E-Commerce
Any purchases of products and services/support packages provided by ASROCK, shall be governed by the terms and conditions of the e-commerce store, please refer to ASROCK sales agreements and relevant policies.
Term and Termination
7.1
If for any reason this SERVICE is not capable of running as planned, including but not limited to force majeure, technical failures, unauthorized intervention, fraud or any other cause beyond the control of ASROCK which corrupts or affects the administration, security, fairness, integrity or proper conduct of this SERVICE, ASROCK reserves the right in its sole discretion to cancel, terminate, modify or suspend the SERVICE subject to any written directions from a relevant governmental authority.
7.2
This NOTICE is effective until terminated by YOU or ASROCK. YOUR rights to use the SERVICE will be terminated automatically without notice if YOU fail to comply with the terms and conditions mentioned in this NOTICE. In this regard, ASROCK will not bear any responsibility to YOU. Upon termination of this NOTICE, YOU shall immediately cease all use of the SERVICE and its copies, in whole or in part.
Warranty Disclaimer and Limitation of Liability
8.1
ASROCK ensures that the computer system used in the SERVICE has the reasonable expected safety standard.
8.2
YOU ACKNOWLEDGE THAT THE SERVICE IS PROVIDED “AS IS.” THE ENTIRE RISK AS TO THE QUALITY AND PERFORMANCE OF THIS SERVICE IS WITH YOU, INCLUDING BUT NOT LIMITED TO RELATED COST OF ALL NECESSARY SERVICING AND REPAIR. TO THE EXTENT PERMITTED BY LAW, ASROCK MAKES NO WARRANTIES, EXPRESS OR IMPLIED, WITH RESPECT TO THIS SERVICE OR ANY OTHER INFORMATION OR DOCUMENTATION PROVIDED UNDER THIS NOTICE OR FOR THIS SERVICE, INCLUDING BUT NOT LIMITED TO ANY WARRANTY OF MERCHANTABILITY OR FITNESS FOR A PARTICULAR PURPOSE OR AGAINST INFRINGEMENT, OR ANY WARRANTY ARISING OUT OF USAGE OR OUT OF COURSE OF PERFORMANCE. ASROCK ALSO MAKES NO WARRANTY AS TO THE RESULTS THAT MAY BE OBTAINED FROM THE USE OF THIS SERVICES OR AS TO THE ACCURACY OR RELIABILITY OF ANY INFORMATION OBTAINED THROUGH THIS SERVICE. SOME JURISDICTIONS DO NOT ALLOW THE EXCLUSION OF CERTAIN WARRANTIES OR THE LIMITATION OR EXCLUSION OF LIABILITY FOR CERTAIN DAMAGES. ACCORDINGLY, SOME OF THE ABOVE DISCLAIMERS AND LIMITATIONS OF LIABILITY MAY NOT APPLY TO YOU.
8.3
THE ENTIRE RISK ARISING OUT OF THE USE AND/OR PERFORMANCE OF THIS SERVICE REMAINS WITH YOU. IN NO EVENT SHALL ASROCK, ITS LICENSORS OR ANY OF THEIR RESPECTIVE OFFICERS, DIRECTORS, EMPLOYEES, AGENTS OR AFFILIATES BE LIABLE FOR ANY CONSEQUENTIAL, INCIDENTAL, DIRECT, INDIRECT, SPECIAL, PUNITIVE, OR OTHER DAMAGES WHATSOEVER (INCLUDING, WITHOUT LIMITATION, DAMAGES FOR LOSS OF PROFITS, INTERRUPTION, LOSS OF INFORMATION, OR OTHER PECUNIARY LOSS) ARISING OUT OF OR RELATING TO THIS NOTICE OR THE USE OF OR INABILITY TO USE THE SERVICE OR ANY PART THEREOF, EVEN IF ASROCK HAVE BEEN ADVISED OF THE POSSIBILITY OF SUCH DAMAGES. SOME JURISDICTIONS DO NOT ALLOW THE EXCLUSION OF CERTAIN WARRANTIES OR THE LIMITATION OR EXCLUSION OF LIABILITY FOR CERTAIN DAMAGES. ACCORDINGLY, SOME OF THE ABOVE DISCLAIMERS AND LIMITATIONS OF LIABILITY MAY NOT APPLY TO YOU.
8.4
ASROCK shall not be responsible for any incorrect or inaccurate information, caused by the internet user or for any of the equipment or programming associated with or utilized in this SERVICE, or for any technical error, or any combination thereof that may occur in the course of the administration of this SERVICE including any omission, interruption, deletion, defect, delay in operation or transmission, communications line or telephone, mobile or satellite network failure, technical problems or traffic congestion on the internet or SERVICE, software failure, theft or destruction or unauthorized access to or alteration of entries and any injury or damage to YOUR computer related to or resulting from participating in or downloading any materials in this SERVICE.
8.5
In the event that any prize is provided in Website Event, YOU acknowledge the following:
8.5.1
ASROCK accepts no responsibility for any tax implications that may arise from YOUR acceptance of the prize. Independent financial advice should be sought by YOU.
8.5.2
A prize, in whole or in part, is not allowed to transfer or exchange and cannot be liquidated unless specified otherwise.
8.5.3
In the event that a prize is not available despite ASROCK’s reasonable endeavors to procure the prize, ASROCK reserves the right to substitute a prize of equal recommended retail value, subject to any written directions from a relevant governmental authority.
8.5.4
ASROCK accepts no responsibility for any subsequent variation in the prize value.
8.5.5
In the event that any failure of a prize winner to take the prize within a certain period of time indicated in the Website Event is deemed a waiver of the right for a prize, and ASROCK, on its sole discretion, has the right to decide the substitution method of such prize winner.
Indemnity
YOU agree to defend, indemnify and hold harmless ASROCK and its affiliates, service providers, syndicators, distributors, licensors, officers, directors and employees, from and against any and all losses, damages, liabilities, and expenses arising out of any claim or demand (including reasonable attorneys' fees and court costs), due to or in connection with YOUR violation of this Notice or any applicable law or regulation, or third-party right.