公告本公司背書保證依公開發行公司資金貸與及 背書保證處理準則第二十五條第一項第三、第四款公告
Bull 0
Bear 0
Routine
3209.TW
|
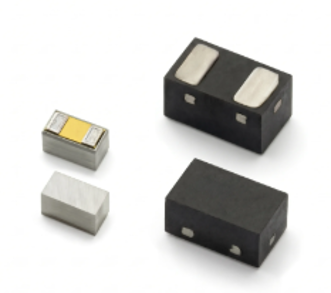
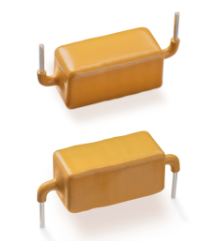
Alltek Technology Corporation is a communication components distributor and solution provider founded in April 1991. The company offers total solutions for product development, including ASIC, module, and system developments, as well as customization and software and firmware modification capabilities. Its R&D teams specialize in wire networks, wireless communications, telecommunication equipment, data and network communications, and digital circuit designs. Alltek serves customers in the data communication, wireless, optical communication, cloud computing, IoT, edge AI, power, and automobile electronics sectors. The company acts as a distribution partner for brands such as Littelfuse and Diodes Incorporated, providing components for automotive, consumer, and aviation applications. Summarised from the company's own disclosures, fiscal year ended Oct 2026 |
Industry Electronics & Computer Distribution | Homepage alltek.com |
| Sector Technology | IR page alltek.com/en/investors | |
|
Tags
communication components, asic development, wireless communications, optical communication, iot, edge ai, automotive electronics, tvs diodes, esd protection, cloud computing, Littelfuse, Diodes Incorporated, AQ4315-01ETG, SP4315-01WTG, AK-FL Series, FlatSuppressX, Super Barrier Rectifier
|
Press page — |
Metrics
| Valuation | |
|---|---|
| Market cap | NT$ 10.963B |
| Market cap (USD) | $ 332.759M |
| P/E | 6.87 |
| PEG | — |
| P/BV | 1.79 |
| P/S | 0.17 |
| P/OCF | 19.43 |
| P/FCF | — |
| Dividend yield | — |
| Turnover / mcap | — |
| Returns | |
|---|---|
| ROE | 13.5% |
| ROI | 13.4% |
| ROIC | 14.7% |
| Profit margin | 1.5% |
| Growth | |
|---|---|
| Revenue growing | No |
| Profits growing | Yes |
| Revenue up 3y | No |
| Revenue up 5y | No |
| Earnings growth 3y (net profit CAGR) | -13.3% |
| Quality | |
|---|---|
| Profitable | Yes |
| Margin expanding | No |
| Buying back stock | No |
| Diluting (TTM) | Yes |
| Debt/Equity | — |
| Podcast bulls (TTM) | Sign up |
| Podcast bears (TTM) | Sign up |
| Podcast sentiment (TTM) | Sign up |
| Podcast sentiment % (TTM) | Sign up |
| News sentiment (TTM) | 0 |
| Quality score | 0% |
| Insiders | |
|---|---|
| Buys, 1w | Sign up |
| Buys, 1m | Sign up |
| Buys, 1y | Sign up |
| Sells, 1w | Sign up |
| Sells, 1m | Sign up |
| Sells, 1y | Sign up |
Sign up to see this company's insider trades
| Figure | FY 2025 | FY 2024 | FY 2023 | FY 2022 | FY 2021 | FY 2020 | FY 2019 | FY 2018 | FY 2017 | FY 2016 | FY 2015 | FY 2014 | FY 2013 | FY 2012 | FY 2011 | FY 2010 |
|---|---|---|---|---|---|---|---|---|---|---|---|---|---|---|---|---|
| Revenue | 47.383B | 45.893B | 56.019B | 60.428B | 47.134B | 41.949B | 39.572B | 31.795B | 31.642B | 28.07B | 24.359B | 22.263B | 19.21B | 16.907B | 15.846B | 14.383B |
| Net profit | 708.247M | 702.528M | 596.104M | 1.086B | 812.413M | 461.288M | 288.345M | 211.359M | 282.686M | 249.907M | 399.239M | 322.707M | 201.627M | 99.766M | 193.165M | 233.367M |
| Figure | FY 2025 | FY 2024 | FY 2023 | FY 2022 | FY 2021 | FY 2020 | FY 2019 | FY 2018 | FY 2017 | FY 2016 | FY 2015 | FY 2014 | FY 2013 | FY 2012 | FY 2011 | FY 2010 |
|---|---|---|---|---|---|---|---|---|---|---|---|---|---|---|---|---|
| Share price | 31.65 | 34.35 | 36.3 | 35.7 | 29.4 | 23.25 | — | — | — | — | — | — | — | — | — | — |
| Price performance 12m | -0.08 | -0.05 | 0.02 | 0.21 | 0.26 | — | — | — | — | — | — | — | — | — | — | — |
Sign up to see institutional holdings
Sign UpPodcast Mentions
Sign up to see podcast mentions and sentiment
Sign UpMaterial information published on MOPS, newest first, subjects as filed in Chinese, guarantee and loan balance notices and routine equipment purchases included. The link opens the company's material information on MOPS. Press releases from the company's own website, newest first.
公告本公司董事會通過115年第3季合併財務報告
Bull 1
Bear 0
Results
ALLTEK September 2026 Revenue Report
Bull 3
Bear 0
Results
首頁 » ALLTEK September 2026 Revenue Report

| * | Statement of Operating Revenue(3209 ALLTEK) | Unit:NTD’000 | |||||
| Operating Revenue | Accumulated Operating Revenue | ||||||
| Month | Year 2026 | Year 2025 | Increase (Decrease) (%) | As of The End of This Month In Year 2026 | The Corresponding Period In Year 2025 | Increase (Decrease) (%) | |
| 12 | 3,259,267 | 47,383,106 | |||||
| 11 | 3,472,776 | 44,123,839 | |||||
| 10 | 5,195,816 | 40,651,063 | |||||
| 9 | 5,702,675 | 2,993,846 | 90.48 | 52,007,771 | 35,455,247 | 46.69 | |
| 8 | 5,371,648 | 4,214,923 | 27.44 | 46,305,096 | 32,461,401 | 42.65 | |
| 7 | 6,601,728 | 4,463,546 | 47.90 | 40,933,448 | 28,246,478 | 44.92 | |
| 6 | 5,608,271 | 2,073,953 | 170.41 | 34,331,720 | 23,782,932 | 44.35 | |
| 5 | 4,710,620 | 3,566,217 | 32.09 | 28,723,449 | 21,708,979 | 32.31 | |
| 4 | 6,945,416 | 3,777,764 | 83.85 | 24,012,829 | 18,142,762 | 32.35 | |
| 3 | 6,810,457 | 6,089,153 | 11.85 | 17,067,413 | 14,364,998 | 18.81 | |
| 2 | 4,213,957 | 3,120,553 | 35.04 | 10,256,956 | 8,275,845 | 23.94 | |
| 1 | 6,042,999 | 5,155,292 | 17.22 | 6,042,999 | 5,155,292 | 17.22 |
Investors
HR
Related
© Copyright 全科科技股份有限公司 著作權所有 All rights reserved
We use cookies on our website to give you the most relevant experience by remembering your preferences and repeat visits. By clicking “Accept All”, you consent to the use of ALL the cookies. However, you may visit "Cookie Settings" to provide a controlled consent.
Cookie SettingsAccept All
Manage consent
Close
Privacy Overview
This website uses cookies to improve your experience while you navigate through the website. Out of these, the cookies that are categorized as necessary are stored on your browser as they are essential for the working of basic functionalities of the ...
SAVE & ACCEPT

Prompts
Click prompts to add them under the company line, click again to take one out, then copy the result into your AI chat. Shared by Asian Century Stocks and Uncovered Thai Stocks. Thank you.
Alltek Technology Corporation (ticker 3209.TW), listed in Taiwan.
Copied
ETFs Holding Alltek Technology Corporation
Exchange-traded funds whose newest published daily portfolio holds one of the company's listings, largest weight first.
| ETF | Weight in ETF | Shares | Market value | As of |
|---|---|---|---|---|
| AVEE | 0.02% | 16,899 | $ 23.761K | Nov 16, 2026 |
| DEXC | 0.01% | 24,149 | $ 35.012K | Nov 12, 2026 |
| DFSE | 0.01% | 44,099 | $ 63.936K | Nov 12, 2026 |
| DFEV | 0.01% | 154,431 | $ 223.898K | Nov 12, 2026 |
| AVES | 0.01% | 89,889 | $ 126.39K | Nov 16, 2026 |
| AVSE | 0.01% | 22,133 | $ 31.12K | Nov 16, 2026 |
| AVXC | 0.01% | 20,149 | $ 28.331K | Nov 16, 2026 |
| DFEM | 0.01% | 316,047 | $ 458.213K | Nov 12, 2026 |
| DFAE | 0.00% | 275,308 | $ 399.148K | Nov 12, 2026 |
| DFAX | 0.00% | 115,633 | $ 167.648K | Nov 12, 2026 |
| AVEM | 0.00% | 293,005 | $ 411.985K | Nov 16, 2026 |