公告本公司召開線上法人說明會
Bull 0
Bear 0
Routine
3056.TW
|
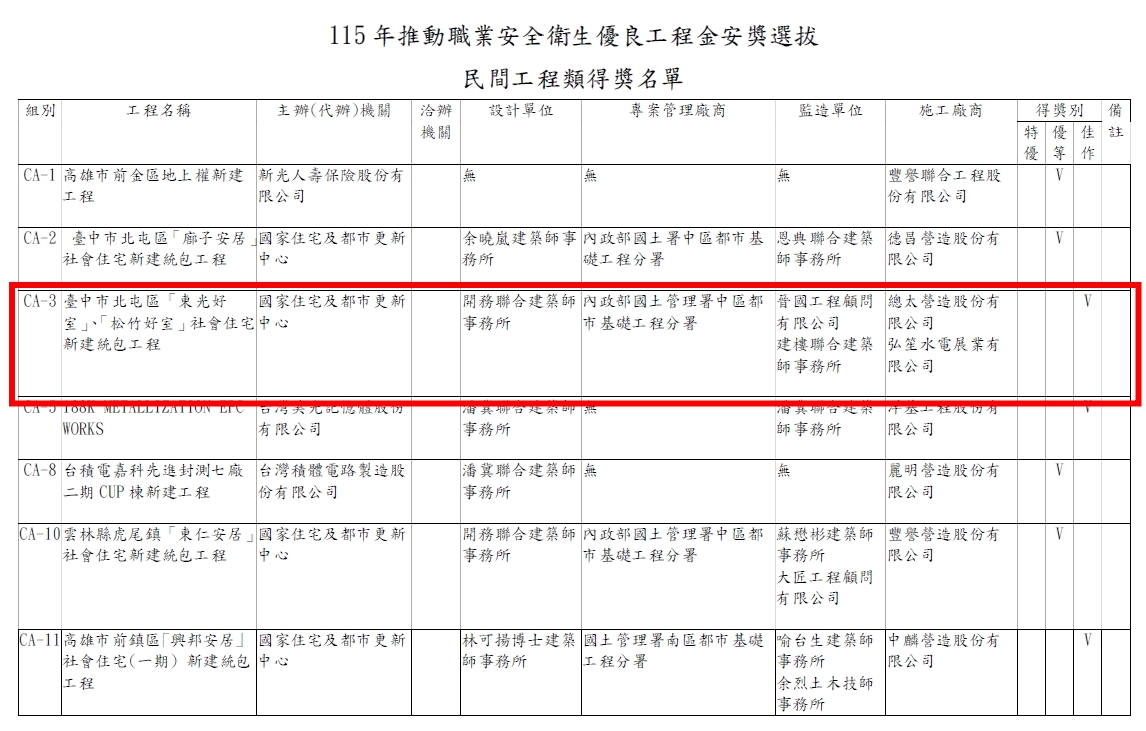
Fu Hua Innovation Co., Ltd. operates as a construction company under the brand Zongtai Construction, formerly known as Gaozhang Construction. Founded in 1976 and renamed in 2017, the firm holds a Class A construction license and specializes in government social housing projects and high-end residential developments. Its portfolio includes notable projects such as Dongfang Empire, Dongfang New York, and the Juyi reconstruction case. The company utilizes Building Information Modeling (BIM) technology, digital construction management, and green building materials in its operations. It serves the Taichung region and broader markets, collaborating with government entities and private clients to develop urban infrastructure and residential communities. Summarised from the company's own disclosures, fiscal year ended Oct 2026 |
Industry Engineering & Construction | Homepage zongtai.com.tw |
| Sector Industrials | IR page zongtai.com.tw | |
|
Tags
residential construction, social housing, bim technology, green building, urban development, construction management, Zongtai Construction, Gaozhang Construction, Dongfang Empire, Dongfang New York, Juyi, Dongfang Yue, Shiguang, Xin Zhi Suo Xiang, Juzuo, Gonghao, Zhizhu, Meiledi, Dongguang Haoshi, Songzhu Haoshi
|
Press page zongtai.com.tw/news |
Metrics
| Valuation | |
|---|---|
| Market cap | NT$ 5.682B |
| Market cap (USD) | $ 172.472M |
| P/E | -132.78 |
| PEG | — |
| P/BV | 0.68 |
| P/S | 5.33 |
| P/OCF | 0.78 |
| P/FCF | — |
| Dividend yield | — |
| Turnover / mcap | — |
| Returns | |
|---|---|
| ROE | 5.8% |
| ROI | 5.9% |
| ROIC | 5.4% |
| Profit margin | 12.7% |
| Growth | |
|---|---|
| Revenue growing | No |
| Profits growing | No |
| Revenue up 3y | No |
| Revenue up 5y | No |
| Earnings growth 3y (net profit CAGR) | -38.4% |
| Quality | |
|---|---|
| Profitable | Yes |
| Margin expanding | No |
| Buying back stock | No |
| Diluting (TTM) | No |
| Debt/Equity | — |
| Podcast bulls (TTM) | Sign up |
| Podcast bears (TTM) | Sign up |
| Podcast sentiment (TTM) | Sign up |
| Podcast sentiment % (TTM) | Sign up |
| News sentiment (TTM) | 0 |
| Quality score | -6.3% |
| Insiders | |
|---|---|
| Buys, 1w | Sign up |
| Buys, 1m | Sign up |
| Buys, 1y | Sign up |
| Sells, 1w | Sign up |
| Sells, 1m | Sign up |
| Sells, 1y | Sign up |
Sign up to see this company's insider trades
| Figure | FY 2025 | FY 2024 | FY 2023 | FY 2022 | FY 2021 | FY 2020 | FY 2019 | FY 2018 | FY 2017 | FY 2016 | FY 2015 | FY 2014 | FY 2013 | FY 2012 | FY 2011 | FY 2010 |
|---|---|---|---|---|---|---|---|---|---|---|---|---|---|---|---|---|
| Revenue | 4.054B | 12.754B | 1.522B | 8.698B | 3.647B | 4.685B | 3.742B | 2.661B | 3.145B | 4.579B | 3.991B | 1.827B | 3.879B | 2.143B | 2.735B | 841.939M |
| Net profit | 515.346M | 2.189B | 306.874M | 2.209B | 635.368M | 1.025B | 471.367M | 333.505M | 748.011M | 998.275M | 727.922M | 390.902M | 1.32B | 487.267M | 572.278M | -3.991M |
| Figure | FY 2025 | FY 2024 | FY 2023 | FY 2022 | FY 2021 | FY 2020 | FY 2019 | FY 2018 | FY 2017 | FY 2016 | FY 2015 | FY 2014 | FY 2013 | FY 2012 | FY 2011 | FY 2010 |
|---|---|---|---|---|---|---|---|---|---|---|---|---|---|---|---|---|
| Share price | 18 | 33.25 | 29.5 | 31.25 | 40.65 | 39.4 | — | — | — | — | — | — | — | — | — | — |
| Price performance 12m | -0.46 | 0.13 | -0.06 | -0.23 | 0.03 | — | — | — | — | — | — | — | — | — | — | — |
Sign up to see institutional holdings
Sign UpPodcast Mentions
Sign up to see podcast mentions and sentiment
Sign UpMaterial information published on MOPS, newest first, subjects as filed in Chinese, guarantee and loan balance notices and routine equipment purchases included. The link opens the company's material information on MOPS. Press releases from the company's own website, newest first.
代子公司富華建設(股)公司公告與關係人合建分售(調整房地比)
Bull 2
Bear 0
Order/contract
公告本公司董事會決議與關係人簽訂台中市西屯文商段15地號1筆合建分售(調整房地比)
Bull 2
Bear 0
Order/contract



























Prompts
Click prompts to add them under the company line, click again to take one out, then copy the result into your AI chat. Shared by Asian Century Stocks and Uncovered Thai Stocks. Thank you.
Fu Hua Innovation Co., Ltd. (ticker 3056.TW), listed in Taiwan.
Copied
ETFs Holding Fu Hua Innovation Co., Ltd.
Exchange-traded funds whose newest published daily portfolio holds one of the company's listings, largest weight first.
| ETF | Weight in ETF | Shares | Market value | As of |
|---|---|---|---|---|
| AVSE | 0.01% | 38,850 | $ 14.36K | Nov 16, 2026 |
| AVEE | 0.01% | 27,324 | $ 10.1K | Nov 16, 2026 |
| DEXC | 0.00% | 34,000 | $ 12.324K | Nov 12, 2026 |
| DFSE | 0.00% | 51,531 | $ 18.678K | Nov 12, 2026 |
| DFEM | 0.00% | 525,361 | $ 190.42K | Nov 12, 2026 |
| DFAE | 0.00% | 326,551 | $ 118.36K | Nov 12, 2026 |
| DFAX | 0.00% | 301,926 | $ 109.435K | Nov 12, 2026 |
| AVEM | 0.00% | 1,754,411 | $ 648.477K | Nov 16, 2026 |
| AVES | 0.00% | 31,823 | $ 11.763K | Nov 16, 2026 |
| AVXC | 0.00% | 22,854 | $ 8,447.44 | Nov 16, 2026 |