公告本公司截至115年10月份自行結算損益情形
Bull 5
Bear 0
Results
3030.TW
|
Test Research, Inc. manufactures automated inspection and testing equipment for electronics manufacturing. The company's product portfolio includes solder paste inspection (SPI), automated optical inspection (AOI), automated X-ray inspection (AXI), in-circuit testing (ICT), and machine data analysis (MDA) systems. Summarised from the company's own disclosures, fiscal year ended Oct 2026 |
Industry Electronic Components | Homepage tri.com.tw |
| Sector Technology | IR page tri.com.tw | |
|
Tags
automated inspection, testing equipment, electronics manufacturing, solder paste inspection, automated optical inspection, automated x-ray inspection, in-circuit testing, machine data analysis, SPI, AOI, AXI, ICT, MDA
|
Press page tri.com.tw/en/news |
Metrics
| Valuation | |
|---|---|
| Market cap | NT$ 47.125B |
| Market cap (USD) | $ 1.43B |
| P/E | 14.47 |
| PEG | 1.63 |
| P/BV | 4.43 |
| P/S | 4.55 |
| P/OCF | 40.64 |
| P/FCF | — |
| Dividend yield | — |
| Turnover / mcap | — |
| Returns | |
|---|---|
| ROE | 27.7% |
| ROI | 25.8% |
| ROIC | 25.8% |
| Profit margin | 29.3% |
| Growth | |
|---|---|
| Revenue growing | Yes |
| Profits growing | Yes |
| Revenue up 3y | No |
| Revenue up 5y | No |
| Earnings growth 3y (net profit CAGR) | 8.9% |
| Quality | |
|---|---|
| Profitable | Yes |
| Margin expanding | Yes |
| Buying back stock | No |
| Diluting (TTM) | No |
| Debt/Equity | — |
| Podcast bulls (TTM) | Sign up |
| Podcast bears (TTM) | Sign up |
| Podcast sentiment (TTM) | Sign up |
| Podcast sentiment % (TTM) | Sign up |
| News sentiment (TTM) | 0 |
| Quality score | 31.3% |
| Insiders | |
|---|---|
| Buys, 1w | Sign up |
| Buys, 1m | Sign up |
| Buys, 1y | Sign up |
| Sells, 1w | Sign up |
| Sells, 1m | Sign up |
| Sells, 1y | Sign up |
Sign up to see this company's insider trades
| Figure | FY 2025 | FY 2024 | FY 2023 | FY 2022 | FY 2021 | FY 2020 | FY 2019 | FY 2018 | FY 2017 | FY 2016 | FY 2015 | FY 2014 | FY 2013 | FY 2012 | FY 2011 | FY 2010 |
|---|---|---|---|---|---|---|---|---|---|---|---|---|---|---|---|---|
| Revenue | 8.467B | 6.356B | 4.435B | 6.709B | 5.607B | 4.951B | 4.387B | 4.919B | 3.601B | 3.1B | 4.754B | 5.87B | 4.084B | 5.538B | 3.898B | 3.756B |
| Net profit | 2.479B | 1.837B | 1.001B | 1.921B | 1.185B | 1.093B | 938.698M | 1.064B | 594.865M | 429.218M | 998.903M | 1.26B | 806.3M | 1.433B | 963.719M | 906.121M |
| Figure | FY 2025 | FY 2024 | FY 2023 | FY 2022 | FY 2021 | FY 2020 | FY 2019 | FY 2018 | FY 2017 | FY 2016 | FY 2015 | FY 2014 | FY 2013 | FY 2012 | FY 2011 | FY 2010 |
|---|---|---|---|---|---|---|---|---|---|---|---|---|---|---|---|---|
| Share price | 191.5 | 122 | 62.7 | 63.7 | 58.5 | 57.8 | — | — | — | — | — | — | — | — | — | — |
| Price performance 12m | 0.57 | 0.95 | -0.02 | 0.09 | 0.01 | — | — | — | — | — | — | — | — | — | — | — |
Sign up to see institutional holdings
Sign UpPodcast Mentions
Sign up to see podcast mentions and sentiment
Sign UpMaterial information published on MOPS, newest first, subjects as filed in Chinese, guarantee and loan balance notices and routine equipment purchases included. The link opens the company's material information on MOPS. Press releases from the company's own website, newest first.
公告本公司董事會通過115年第三季合併財務報告
Bull 0
Bear 0
Routine
TRI Receives the 2026 Global Technology Award for AI Verify Host
Bull 1
Bear 0
Other
We use cookies to improve your user experience and for web traffic statistics purposes. By continuing to use this website, you agree to our use of cookies. Our Privacy & Cookie Policy contains more information on such use and explains how to disable cookies. I Accept

The currently displayed page is not available in the selected language. Select Yes to go to =A= version, No to go to =B= version, or click the X symbol to stay on this page.
-
=A=
-
=B=
|  | Contact Us | Careers |
 Search |
 Members Area |


 | *
 * English
 * Español * Português * 繁體中文 * 简体中文 * Deutsch * 한국어 * 日本語 |
|  | | About Us | Solutions | News | Customer Service | Investor Relations | |
Sitemap
| * Index * About Us * * * Company Profile * * Company Organization Chart and Management Team * Company Milestones * Company Milestones * Quality Policy * Product Solutions * Multimedia and Video * Integrity Statement * Privacy Policy * Cookie Policy | | * Solutions * Advanced Application * -SMT * Optical Inspection * -3D Solder Paste Inspection (SPI) * -Automated Optical Inspection (AOI) * -Conformal Coating Inspection (CI AOI) * -Automated X-ray Inspection (AXI) * Electrical Test * -Manufacturing Defects Analyzer (MDA) * -In-Circuit Tester (ICT) * SEMI Inspection * -Optical Inspection * -X-Ray Inspection | | * News * Press * Announcements * Events * TRI Industry News * Careers * Join TRI * Training & Development * Benefits * Life at TRI | | * Customer Service * Sales * Technical Support * * FAQ * Members Area * Member Login * Register * Modify Profile * Forgot Your Password * Investor Relations * Financials * Shareholder Service * Corporate Governance * Stakeholder * Contact Us |
Copyright © 2015 Test Research, Inc. All Rights Reserved.
ShareThis Copy and Paste
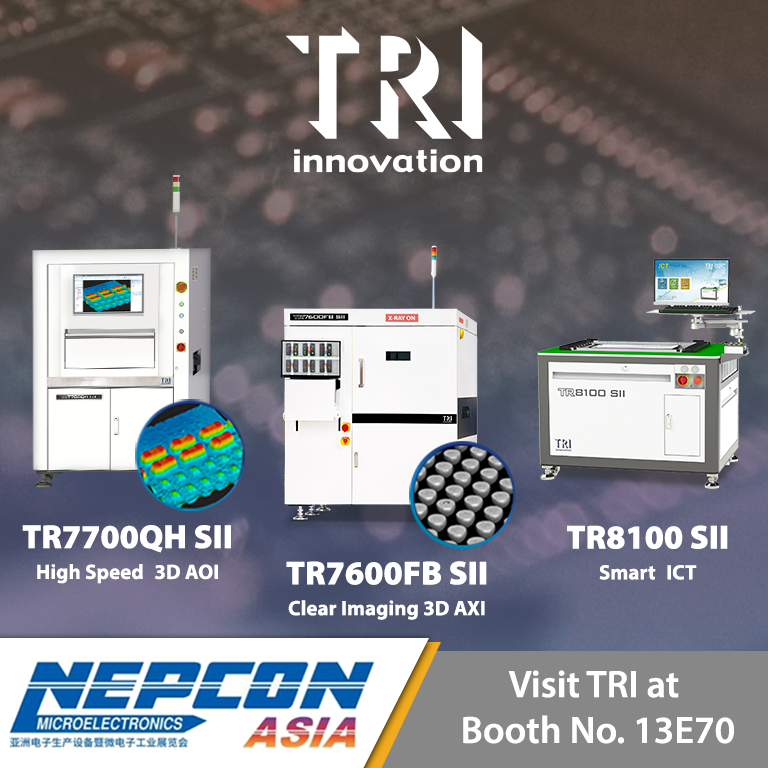
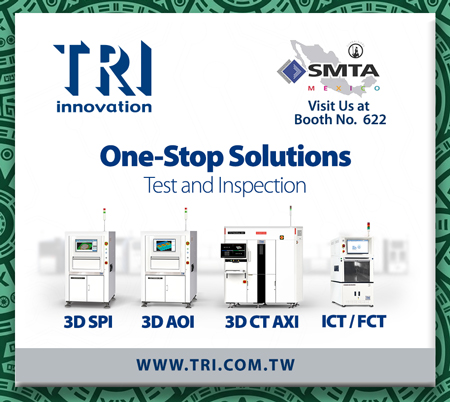
 Shenzhen World Exhibition & Convention Center (Baoan New Hall)Event Date:2026/10/27 ~ 2026/10/29 | |


Prompts
Click prompts to add them under the company line, click again to take one out, then copy the result into your AI chat. Shared by Asian Century Stocks and Uncovered Thai Stocks. Thank you.
Test Research, Inc. (ticker 3030.TW), listed in Taiwan.
Copied
ETFs Holding Test Research, Inc.
Exchange-traded funds whose newest published daily portfolio holds one of the company's listings, largest weight first.
| ETF | Weight in ETF | Shares | Market value | As of |
|---|---|---|---|---|
| AVEE | 0.07% | 15,000 | $ 94.734K | Nov 16, 2026 |
| AVES | 0.06% | 142,000 | $ 896.817K | Nov 16, 2026 |
| DFSE | 0.02% | 20,000 | $ 134.973K | Nov 12, 2026 |
| DEXC | 0.02% | 9,000 | $ 60.738K | Nov 12, 2026 |
| DFEM | 0.02% | 270,000 | $ 1.822M | Nov 12, 2026 |
| AVXC | 0.02% | 16,000 | $ 101.05K | Nov 16, 2026 |
| DFEV | 0.01% | 42,000 | $ 283.444K | Nov 12, 2026 |
| AVSE | 0.01% | 5,000 | $ 31.578K | Nov 16, 2026 |
| JSTC | 0.01% | 4,536 | $ 28.985K | Nov 17, 2026 |
| DFAE | 0.01% | 120,000 | $ 809.839K | Nov 12, 2026 |
| DFAX | 0.01% | 117,532 | $ 793.184K | Nov 12, 2026 |
| AVEM | 0.00% | 60,000 | $ 378.937K | Nov 16, 2026 |