本公司董事會通過解除經理人競業禁止之限制
Bull 0
Bear 0
Routine
|
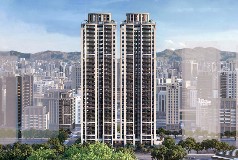
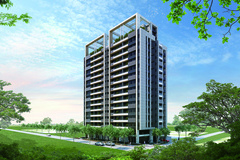
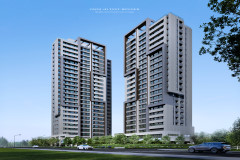
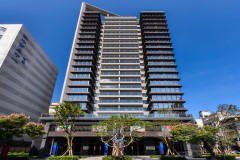
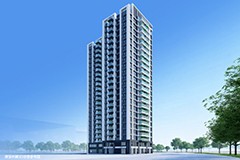
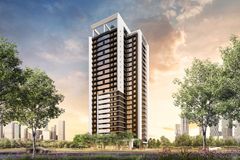
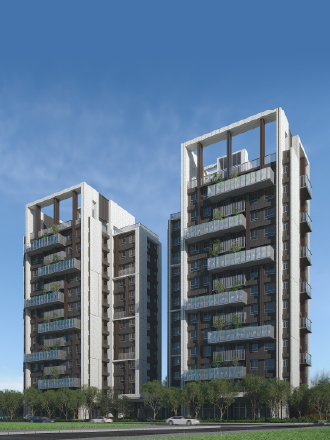
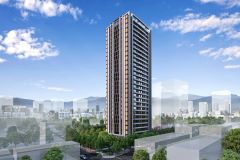
Cathay Real Estate Development Co., Ltd. is a real estate developer operating in Taiwan. The company develops residential and commercial properties, including projects such as Guotai Shimei, Guotai Mingcheng, Guotai Yuanmei, Guotai Shicui, Guotai You Ran, Guotai GRAND PARK, and Guotai Forest Hui. It also publishes the Guotai National Real Estate Index, providing quarterly market data on price and volume trends. The company collaborates with partners such as Mitsui Fudosan for urban renewal projects, including the Nangang Industrial Zone case. Its business focuses on creating living spaces and architectural developments within the Taiwanese market. Summarised from the company's own disclosures |
Industry Real Estate - Development | Homepage cathay-red.com.tw |
| Sector Real Estate | IR page cathay-red.com.tw/tw/Investor | |
|
Tags
residential development, commercial development, urban renewal, real estate index, property management, Guotai Shimei, Guotai Mingcheng, Guotai Yuanmei, Guotai Shicui, Guotai You Ran, Guotai GRAND PARK, Guotai Forest Hui, RiVER PARK, Yubo Yuan, Guotai National Real Estate Index, Mitsui Fudosan
|
Press page — |
Metrics
| Valuation | |
|---|---|
| Market cap | NT$ 24.464B |
| Market cap (USD) | $ 742.529M |
| P/E | 5.55 |
| PEG | 0.14 |
| P/BV | 0.71 |
| P/S | 0.86 |
| P/OCF | 6.94 |
| P/FCF | — |
| Dividend yield | — |
| Turnover / mcap | — |
| Returns | |
|---|---|
| ROE | 11.1% |
| ROI | 10.7% |
| ROIC | 11.4% |
| Profit margin | 13.5% |
| Growth | |
|---|---|
| Revenue growing | Yes |
| Profits growing | Yes |
| Revenue up 3y | No |
| Revenue up 5y | No |
| Earnings growth 3y (net profit CAGR) | 39.5% |
| Quality | |
|---|---|
| Profitable | Yes |
| Margin expanding | Yes |
| Buying back stock | No |
| Diluting (TTM) | No |
| Debt/Equity | — |
| Podcast bulls (TTM) | Sign up |
| Podcast bears (TTM) | Sign up |
| Podcast sentiment (TTM) | Sign up |
| Podcast sentiment % (TTM) | Sign up |
| News sentiment (TTM) | 0 |
| Quality score | 56.3% |
| Insiders | |
|---|---|
| Buys, 1w | Sign up |
| Buys, 1m | Sign up |
| Buys, 1y | Sign up |
| Sells, 1w | Sign up |
| Sells, 1m | Sign up |
| Sells, 1y | Sign up |
Sign up to see this company's insider trades
| Figure | FY 2025 | FY 2024 | FY 2023 | FY 2022 | FY 2021 | FY 2020 | FY 2019 | FY 2018 | FY 2017 | FY 2016 | FY 2015 | FY 2014 | FY 2013 | FY 2012 | FY 2011 | FY 2010 |
|---|---|---|---|---|---|---|---|---|---|---|---|---|---|---|---|---|
| Revenue | 24.289B | 23.859B | 15.481B | 16.792B | 12.476B | 13.974B | 11.624B | 14.295B | 12.27B | 18.696B | 9.848B | 9.892B | 8.141B | 8.036B | 7.476B | 4.419B |
| Net profit | 3.282B | 1.577B | 2.164B | 1.208B | 847.539M | 1.484B | 1.371B | 3.61B | 1.445B | 3.018B | 2.327B | 2.953B | 1.688B | 1.687B | 3.104B | 1.006B |
| Figure | FY 2025 | FY 2024 | FY 2023 | FY 2022 | FY 2021 | FY 2020 | FY 2019 | FY 2018 | FY 2017 | FY 2016 | FY 2015 | FY 2014 | FY 2013 | FY 2012 | FY 2011 | FY 2010 |
|---|---|---|---|---|---|---|---|---|---|---|---|---|---|---|---|---|
| Share price | 23.4 | 24 | 18.15 | 15.25 | 19.25 | 19.9 | — | — | — | — | — | — | — | — | — | — |
| Price performance 12m | -0.03 | 0.32 | 0.19 | -0.21 | -0.03 | — | — | — | — | — | — | — | — | — | — | — |
Sign up to see institutional holdings
Sign UpPodcast Mentions
Sign up to see podcast mentions and sentiment
Sign UpMaterial information published on MOPS, newest first, subjects as filed in Chinese, guarantee and loan balance notices and routine equipment purchases included. The link opens the company's material information on MOPS. Press releases from the company's own website, newest first.
 MENU







Prompts
Click prompts to add them under the company line, click again to take one out, then copy the result into your AI chat. Shared by Asian Century Stocks and Uncovered Thai Stocks. Thank you.
Cathay Real Estate Development Co., Ltd. (ticker 2501.TW), listed in Taiwan.
Copied
ETFs Holding Cathay Real Estate Development Co., Ltd.
Exchange-traded funds whose newest published daily portfolio holds one of the company's listings, largest weight first.
| ETF | Weight in ETF | Shares | Market value | As of |
|---|---|---|---|---|
| OAEM | 1.68% | 3,123,394 | $ 2.201M | Aug 31, 2026 |
| DFSE | 0.01% | 80,000 | $ 49.5K | Nov 12, 2026 |
| DFEV | 0.01% | 259,000 | $ 160.257K | Nov 12, 2026 |
| DFEM | 0.01% | 746,000 | $ 461.59K | Nov 12, 2026 |
| DEXC | 0.01% | 22,000 | $ 13.613K | Nov 12, 2026 |
| DFAX | 0.00% | 402,300 | $ 248.925K | Nov 12, 2026 |
| DFAE | 0.00% | 297,000 | $ 183.77K | Nov 12, 2026 |