公告本公司董事會決議對越南子公司增資案
Bull 2
Bear 0
M&A
2478.TW
|
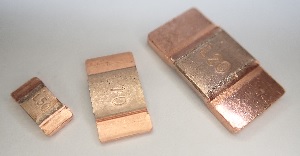
TA-I Technology Co., Ltd. is a manufacturer of passive components, protection components, and current sensing components. The company produces thick film resistors, resistor arrays, current sensing resistors, chip fuses, NTC thermistors, and anti-sulfurated chip resistors. Its products are applied in 3C electronics, including motherboards, notebooks, LCD TVs, mobile phones, and digital cameras. TA-I serves the IT, automotive, consumer electronics, industrial, and alternative energy sectors, with applications in automotive electronics, electric vehicles, powertrain systems, computing peripherals, lighting, home appliances, power electronics, factory automation, and electrical grids. The company was founded in 1989 as a professional chip resistor manufacturer. Summarised from the company's own disclosures, fiscal year ended Oct 2026 |
Industry Electronic Components | Homepage tai.com.tw |
| Sector Technology | IR page tai.com.tw/investor | |
|
Tags
passive components, chip resistors, current sensing resistors, circuit protection, automotive electronics, consumer electronics, industrial automation, alternative energy, RLM Series, RMS Series, MSA, UMSA MAX Guard EDS Suppressor, RBL
|
Press page tai.com.tw/news |
Metrics
| Valuation | |
|---|---|
| Market cap | NT$ 11.377B |
| Market cap (USD) | $ 345.299M |
| P/E | 12.90 |
| PEG | — |
| P/BV | 1.49 |
| P/S | 1.78 |
| P/OCF | 11.59 |
| P/FCF | — |
| Dividend yield | — |
| Turnover / mcap | — |
| Returns | |
|---|---|
| ROE | 7.1% |
| ROI | 7.0% |
| ROIC | 7.6% |
| Profit margin | 9.1% |
| Growth | |
|---|---|
| Revenue growing | Yes |
| Profits growing | Yes |
| Revenue up 3y | No |
| Revenue up 5y | No |
| Earnings growth 3y (net profit CAGR) | -7.5% |
| Quality | |
|---|---|
| Profitable | Yes |
| Margin expanding | Yes |
| Buying back stock | Yes |
| Diluting (TTM) | No |
| Debt/Equity | — |
| Podcast bulls (TTM) | Sign up |
| Podcast bears (TTM) | Sign up |
| Podcast sentiment (TTM) | Sign up |
| Podcast sentiment % (TTM) | Sign up |
| News sentiment (TTM) | 2 |
| Quality score | 18.8% |
| Insiders | |
|---|---|
| Buys, 1w | Sign up |
| Buys, 1m | Sign up |
| Buys, 1y | Sign up |
| Sells, 1w | Sign up |
| Sells, 1m | Sign up |
| Sells, 1y | Sign up |
Sign up to see this company's insider trades
| Figure | FY 2025 | FY 2024 | FY 2023 | FY 2022 | FY 2021 | FY 2020 | FY 2019 | FY 2018 | FY 2017 | FY 2016 | FY 2015 | FY 2014 | FY 2013 | FY 2012 | FY 2011 | FY 2010 |
|---|---|---|---|---|---|---|---|---|---|---|---|---|---|---|---|---|
| Revenue | 5.424B | 5.031B | 4.595B | 5.023B | 6.315B | 5.395B | 4.509B | 6.021B | 4.078B | 3.811B | 3.946B | 4.038B | 3.829B | 3.608B | 3.72B | 3.949B |
| Net profit | 493.706M | 453.634M | 369.935M | 623.463M | 942.95M | 661.631M | 387.28M | 1.355B | 189.405M | 228.919M | 243.468M | 171.259M | 76.009M | 104.559M | 227.805M | 533.717M |
| Figure | FY 2025 | FY 2024 | FY 2023 | FY 2022 | FY 2021 | FY 2020 | FY 2019 | FY 2018 | FY 2017 | FY 2016 | FY 2015 | FY 2014 | FY 2013 | FY 2012 | FY 2011 | FY 2010 |
|---|---|---|---|---|---|---|---|---|---|---|---|---|---|---|---|---|
| Share price | 57.2 | 46.35 | 47.85 | 42.45 | 65.4 | 86 | — | — | — | — | — | — | — | — | — | — |
| Price performance 12m | 0.23 | -0.03 | 0.13 | -0.35 | -0.24 | — | — | — | — | — | — | — | — | — | — | — |
Sign up to see institutional holdings
Sign UpPodcast Mentions
Sign up to see podcast mentions and sentiment
Sign UpMaterial information published on MOPS, newest first, subjects as filed in Chinese, guarantee and loan balance notices and routine equipment purchases included. The link opens the company's material information on MOPS. Press releases from the company's own website, newest first.

















Prompts
Click prompts to add them under the company line, click again to take one out, then copy the result into your AI chat. Shared by Asian Century Stocks and Uncovered Thai Stocks. Thank you.
TA-I Technology Co., Ltd. (ticker 2478.TW), listed in Taiwan.
Copied
ETFs Holding TA-I Technology Co., Ltd.
Exchange-traded funds whose newest published daily portfolio holds one of the company's listings, largest weight first.
| ETF | Weight in ETF | Shares | Market value | As of |
|---|---|---|---|---|
| AVEE | 0.03% | 13,000 | $ 36.682K | Nov 16, 2026 |
| DFEV | 0.01% | 92,000 | $ 279.046K | Nov 12, 2026 |
| DEXC | 0.01% | 10,000 | $ 30.331K | Nov 12, 2026 |
| AVES | 0.01% | 26,000 | $ 73.365K | Nov 16, 2026 |
| AVXC | 0.01% | 16,000 | $ 45.147K | Nov 16, 2026 |
| DFEM | 0.01% | 273,000 | $ 828.038K | Nov 12, 2026 |
| DFSE | 0.01% | 15,000 | $ 45.497K | Nov 12, 2026 |
| DFAE | 0.00% | 116,000 | $ 351.84K | Nov 12, 2026 |
| DFAX | 0.00% | 90,064 | $ 273.174K | Nov 12, 2026 |
| AVEM | 0.00% | 31,750 | $ 89.59K | Nov 16, 2026 |