公告本公司將參加Macquarie舉辦之「Taiwan Conference 2026」及富邦證券舉辦之「法人座談會」
Bull 0
Bear 0
Routine
2409.TW
|
AUO Corporation is a technology company providing display products and solution services across display, system solutions, industrial intelligence, healthcare, and energy sectors. The company develops Micro LED and Mini LED Backlight technologies, eye care solutions, and dual-driver gaming displays. It offers smart vertical solutions for retail, education, enterprise, healthcare, mobility, manufacturing, and energy markets. AUO provides customized modules for solar power generation and next-generation sensing technologies for human-machine communication. The group includes StarShining Energy Holdings and operates through subsidiaries focused on flexible manufacturing and sustainable supply chains. Summarised from the company's own disclosures |
Industry Electronic Components | Homepage auo.com |
| Sector Technology | IR page auo.com/en-global/investor_conference | |
|
Tags
display technology, micro led, mini led backlight, gaming displays, solar power modules, sensing technology, industrial intelligence, healthcare solutions, smart retail, mobility solutions, StarShining Energy Holdings
|
Press page — |
Metrics
| Valuation | |
|---|---|
| Market cap | NT$ 189.419B |
| Market cap (USD) | $ 5.749B |
| P/E | 313.75 |
| PEG | — |
| P/BV | 1.25 |
| P/S | 0.68 |
| P/OCF | 8.18 |
| P/FCF | — |
| Dividend yield | — |
| Turnover / mcap | — |
| Returns | |
|---|---|
| ROE | 4.5% |
| ROI | 4.5% |
| ROIC | -0.58% |
| Profit margin | 2.4% |
| Growth | |
|---|---|
| Revenue growing | Yes |
| Profits growing | Yes |
| Revenue up 3y | Yes |
| Revenue up 5y | No |
| Earnings growth 3y (net profit CAGR) | — |
| Quality | |
|---|---|
| Profitable | Yes |
| Margin expanding | Yes |
| Buying back stock | Yes |
| Diluting (TTM) | No |
| Debt/Equity | — |
| Podcast bulls (TTM) | Sign up |
| Podcast bears (TTM) | Sign up |
| Podcast sentiment (TTM) | Sign up |
| Podcast sentiment % (TTM) | Sign up |
| News sentiment (TTM) | 0 |
| Quality score | 29.4% |
| Insiders | |
|---|---|
| Buys, 1w | Sign up |
| Buys, 1m | Sign up |
| Buys, 1y | Sign up |
| Sells, 1w | Sign up |
| Sells, 1m | Sign up |
| Sells, 1y | Sign up |
Sign up to see this company's insider trades
| Figure | FY 2025 | FY 2024 | FY 2023 | FY 2022 | FY 2021 | FY 2020 | FY 2019 | FY 2018 | FY 2017 | FY 2016 | FY 2015 | FY 2014 | FY 2013 | FY 2012 | FY 2011 | FY 2010 |
|---|---|---|---|---|---|---|---|---|---|---|---|---|---|---|---|---|
| Revenue | 281.388B | 280.245B | 247.964B | 246.793B | 370.685B | 270.955B | 268.792B | 307.634B | 341.028B | 329.089B | 360.346B | 408.179B | 416.363B | 378.471B | 379.712B | 467.158B |
| Net profit | 6.843B | -3.064B | -18.203B | -21.101B | 61.331B | 3.376B | -19.185B | 10.161B | 32.359B | 7.819B | 4.932B | 17.628B | 4.18B | -54.615B | -61.264B | 6.693B |
| Figure | FY 2025 | FY 2024 | FY 2023 | FY 2022 | FY 2021 | FY 2020 | FY 2019 | FY 2018 | FY 2017 | FY 2016 | FY 2015 | FY 2014 | FY 2013 | FY 2012 | FY 2011 | FY 2010 |
|---|---|---|---|---|---|---|---|---|---|---|---|---|---|---|---|---|
| Share price | 12.25 | 14.65 | 18.15 | 15 | 22.9 | 14 | — | — | — | — | — | — | — | — | — | — |
| Price performance 12m | -0.16 | -0.19 | 0.21 | -0.34 | 0.64 | — | — | — | — | — | — | — | — | — | — | — |
Sign up to see institutional holdings
Sign UpPodcast Mentions
Sign up to see podcast mentions and sentiment
Sign UpMaterial information published on MOPS, newest first, subjects as filed in Chinese, guarantee and loan balance notices and routine equipment purchases included. The link opens the company's material information on MOPS. Press releases from the company's own website, newest first.
取得富采控股股份有限公司私募普通股畸零股
Bull 0
Bear 0
Routine
代子公司友達智慧移動股份有限公司 及 AUO Mobility Solutions Germany GmbH 公告對其子公司辦理現金增資
Bull 1
Bear 0
Financing


 AUO’s Transparent Micro LED Display HMIs are integrated into the driver display positioned above Hypersquare® steering control and the floating central display. (Photo Source: PEUGEOT)
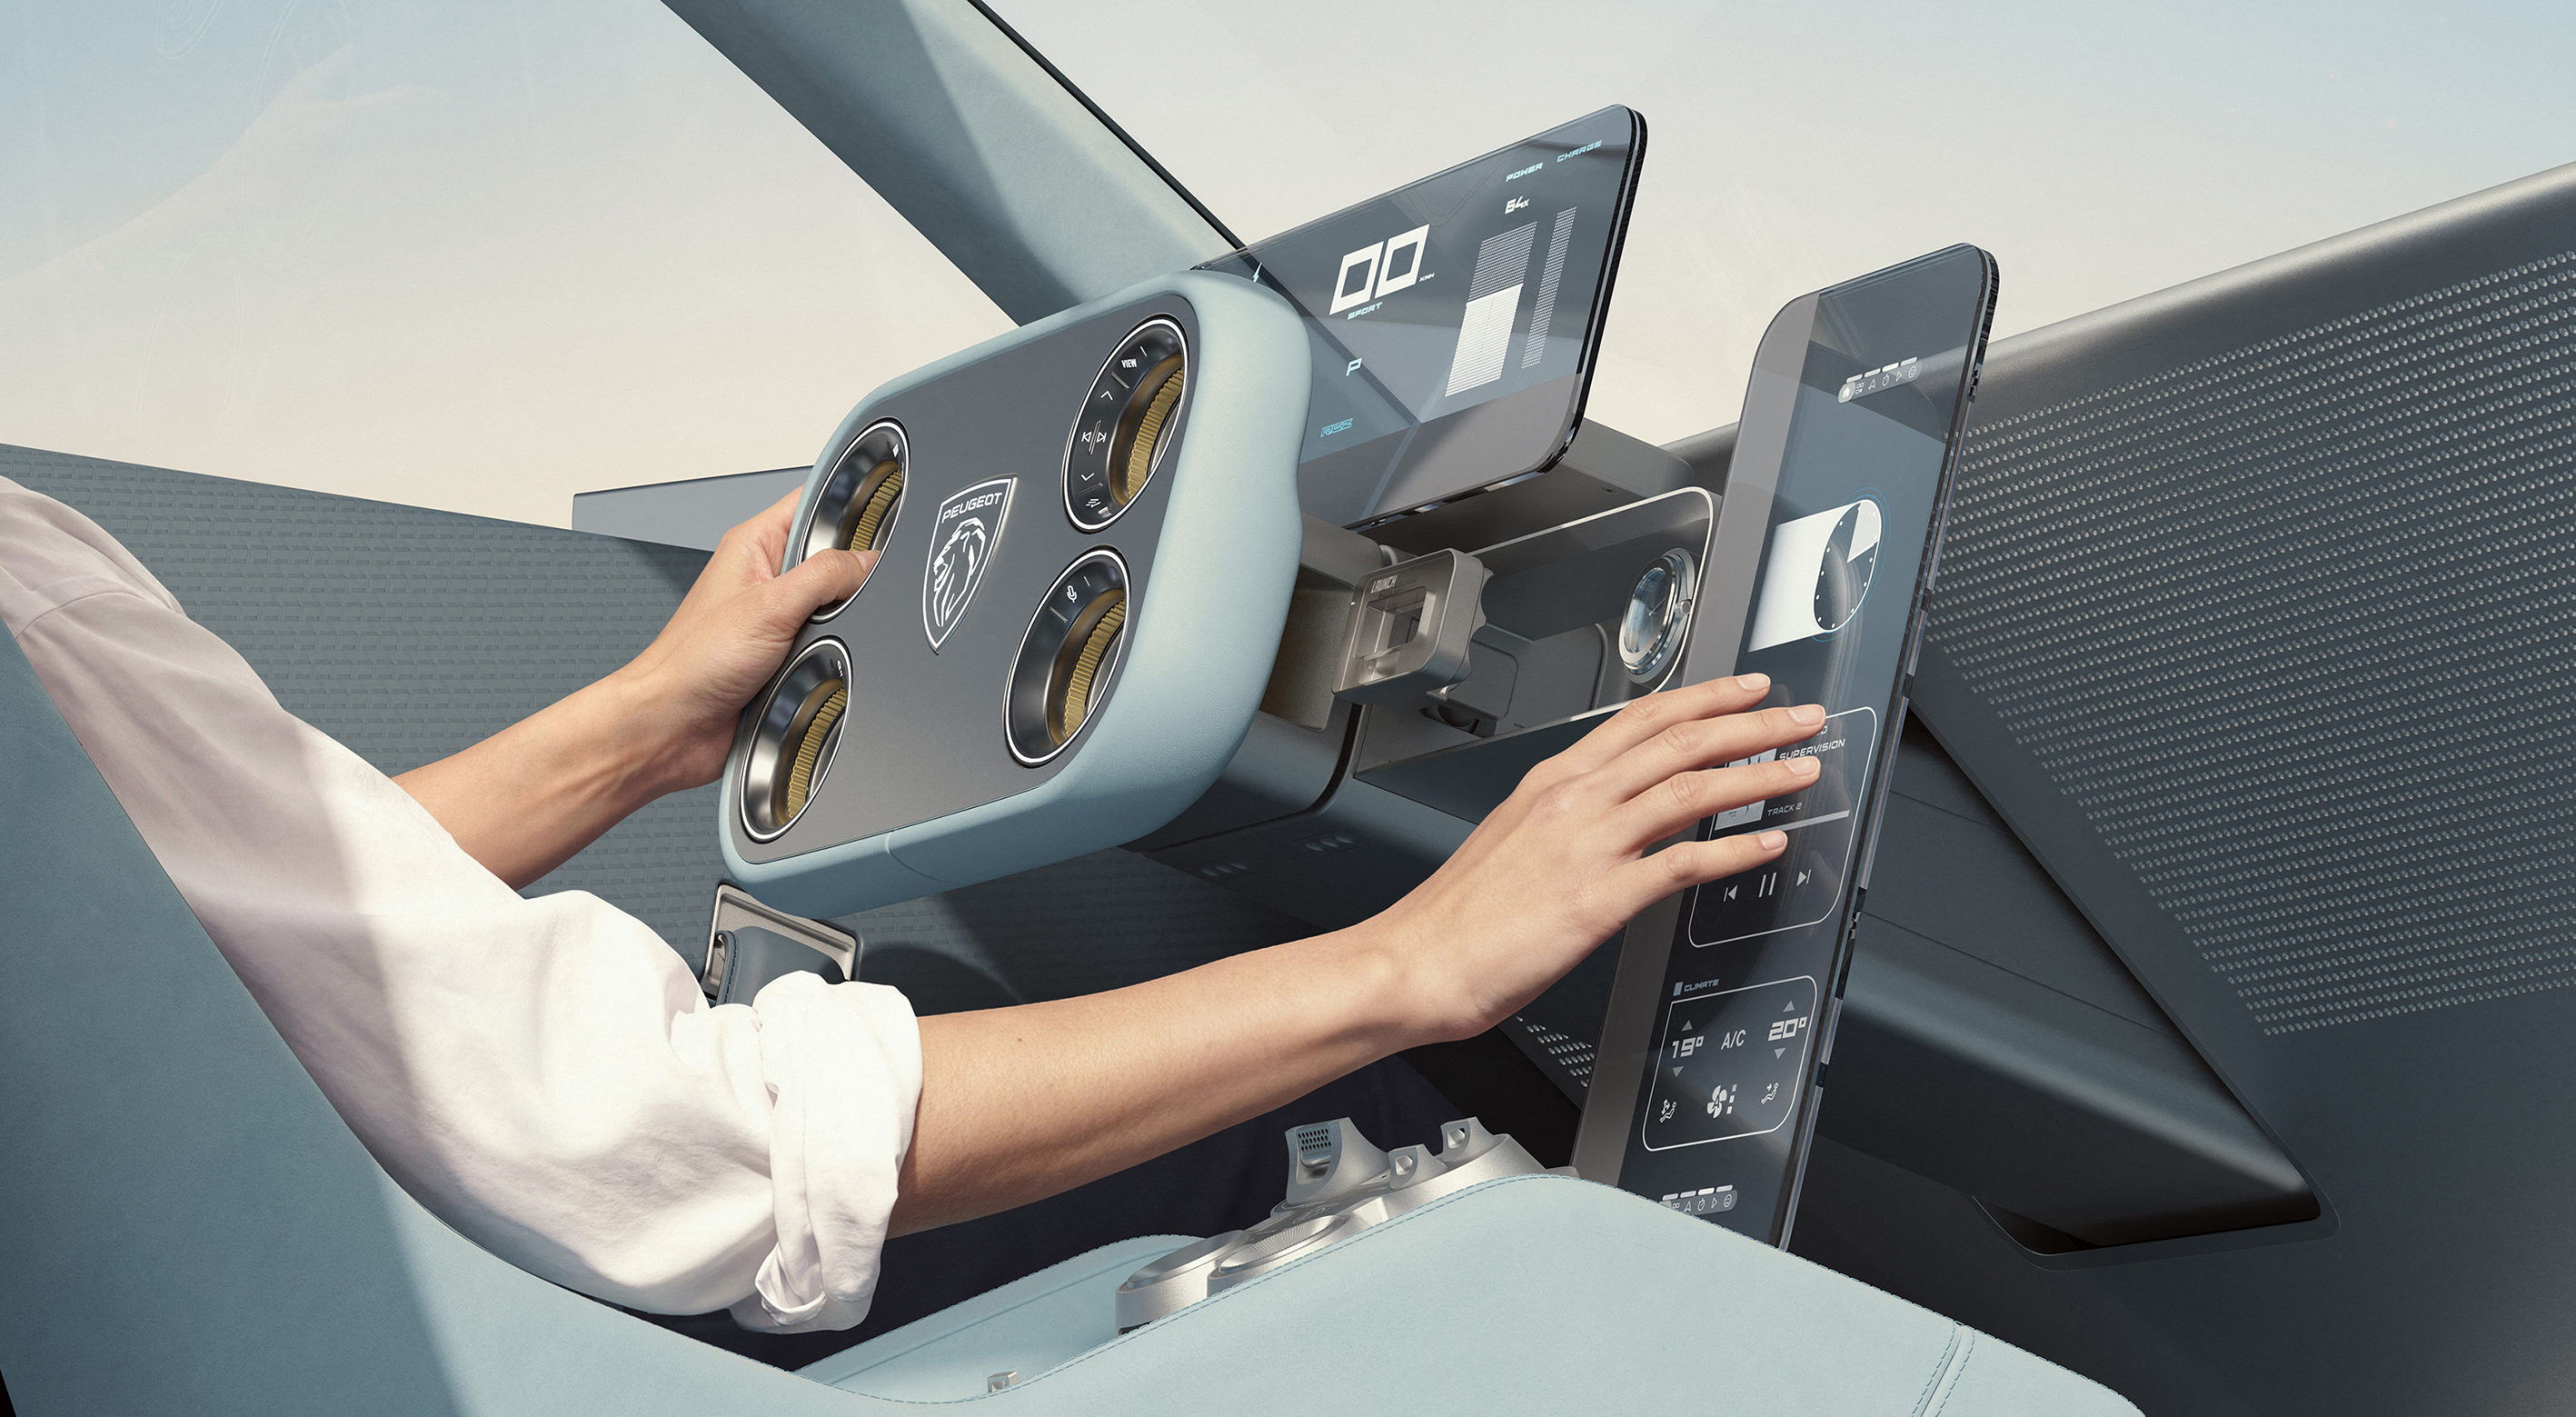
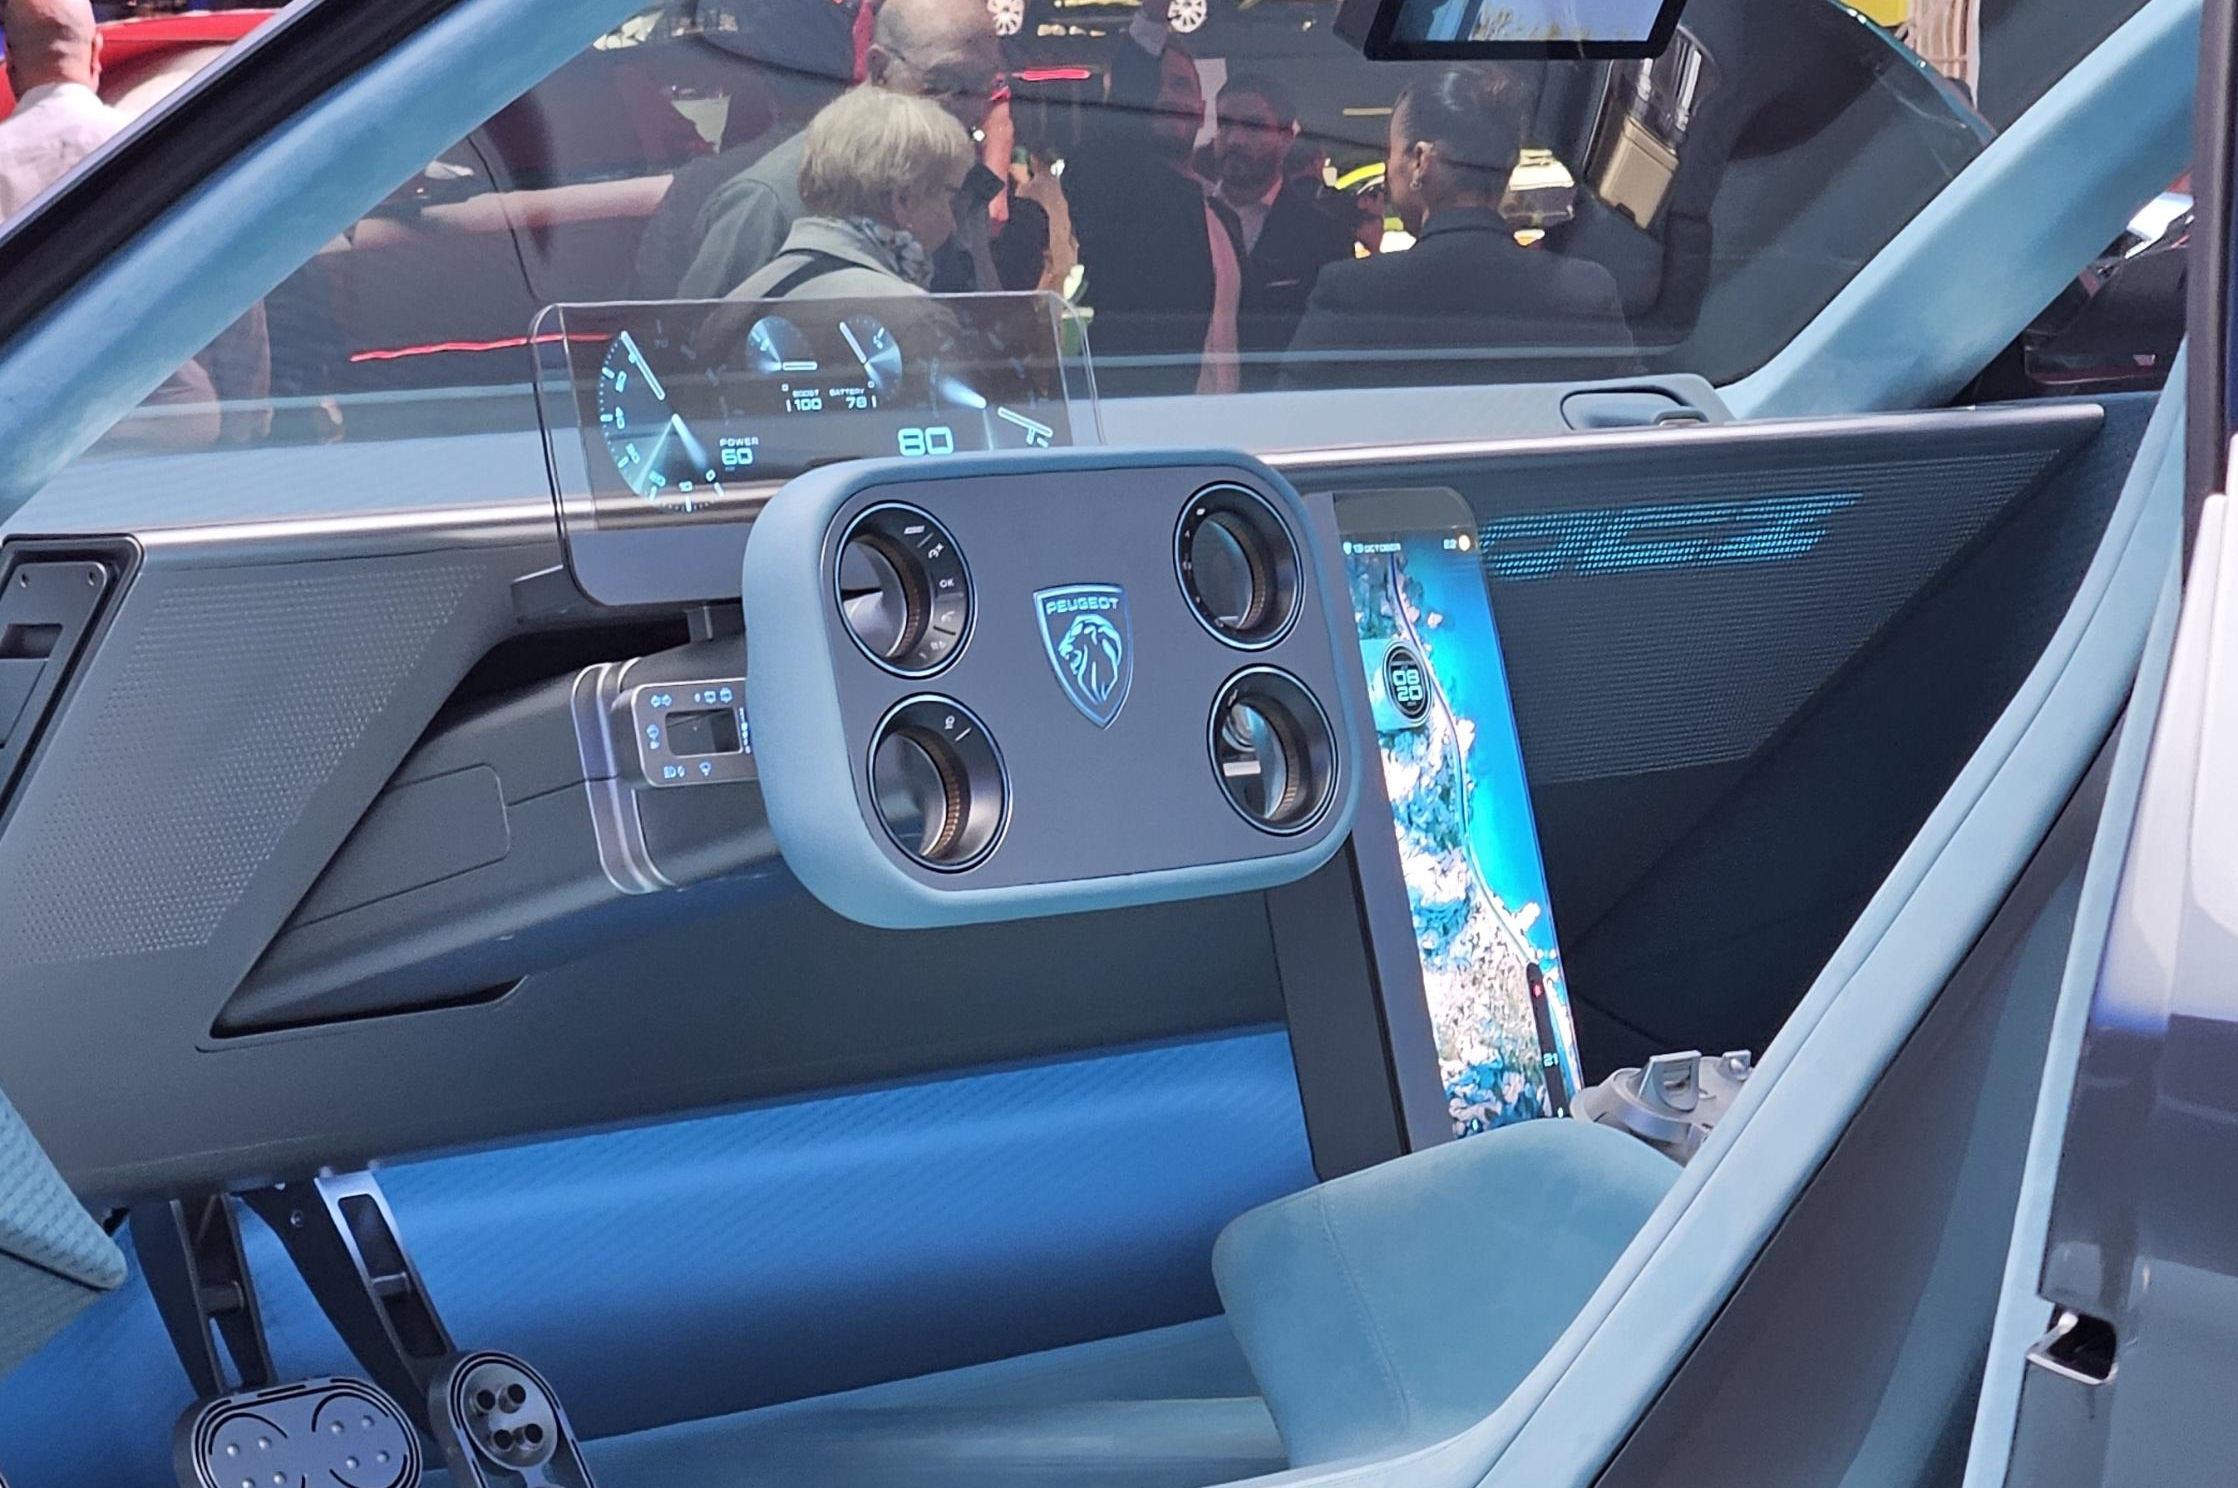 AUO transparent Micro LED technology supports PEUGEOT in translating its vision for the future cockpit into an immersive, human-centered experience, all in the service of driving pleasure. (Photo Source: PEUGEOT)

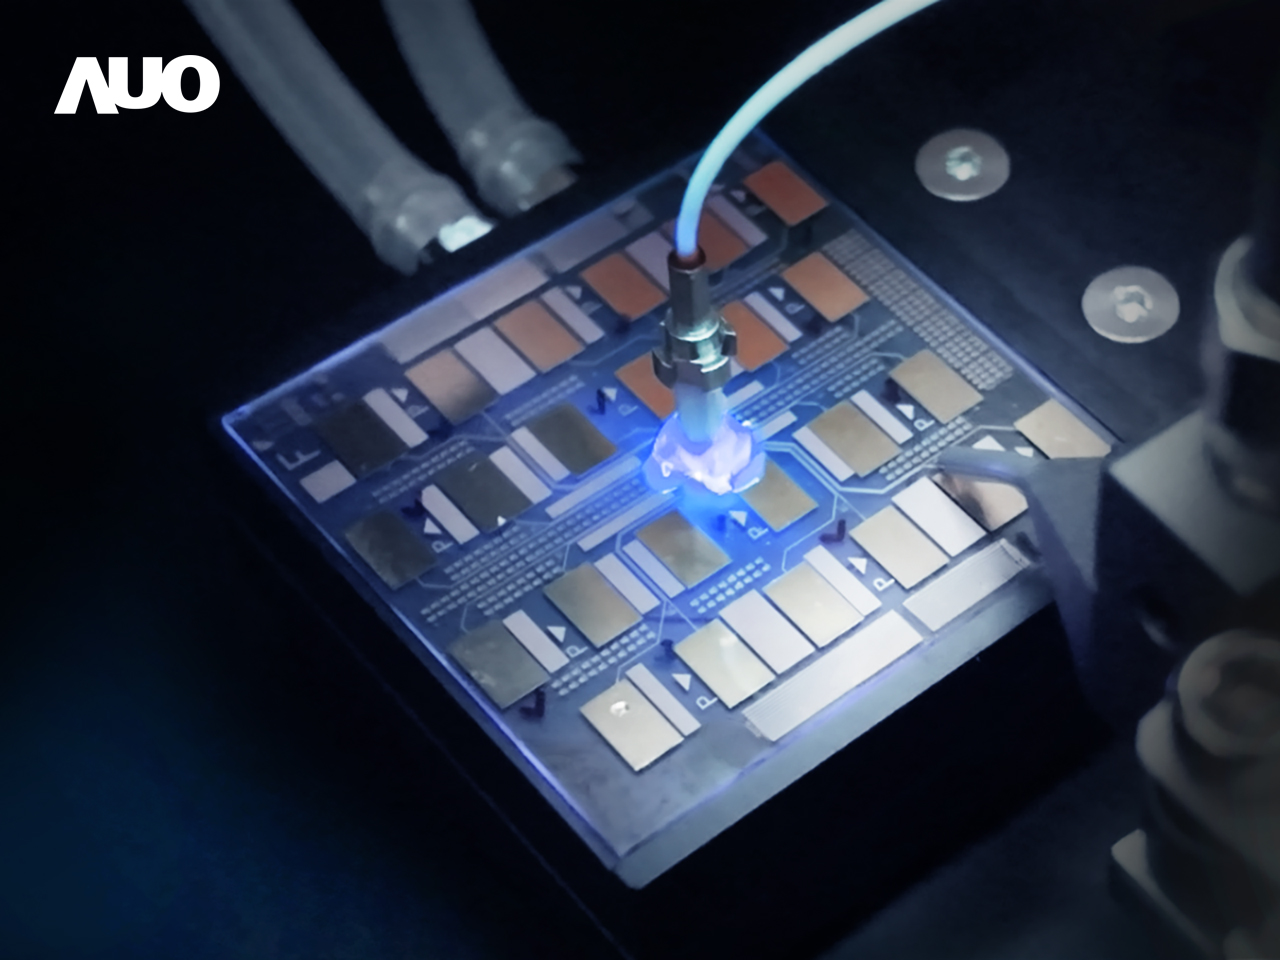 AUO will showcase its Micro LED CPO optical module together with ecosystem partners Ennostar, Tyntek, Daxin, and Corning, featuring the latest advancements in optical communication solutions at SEMICON Taiwan 2026.
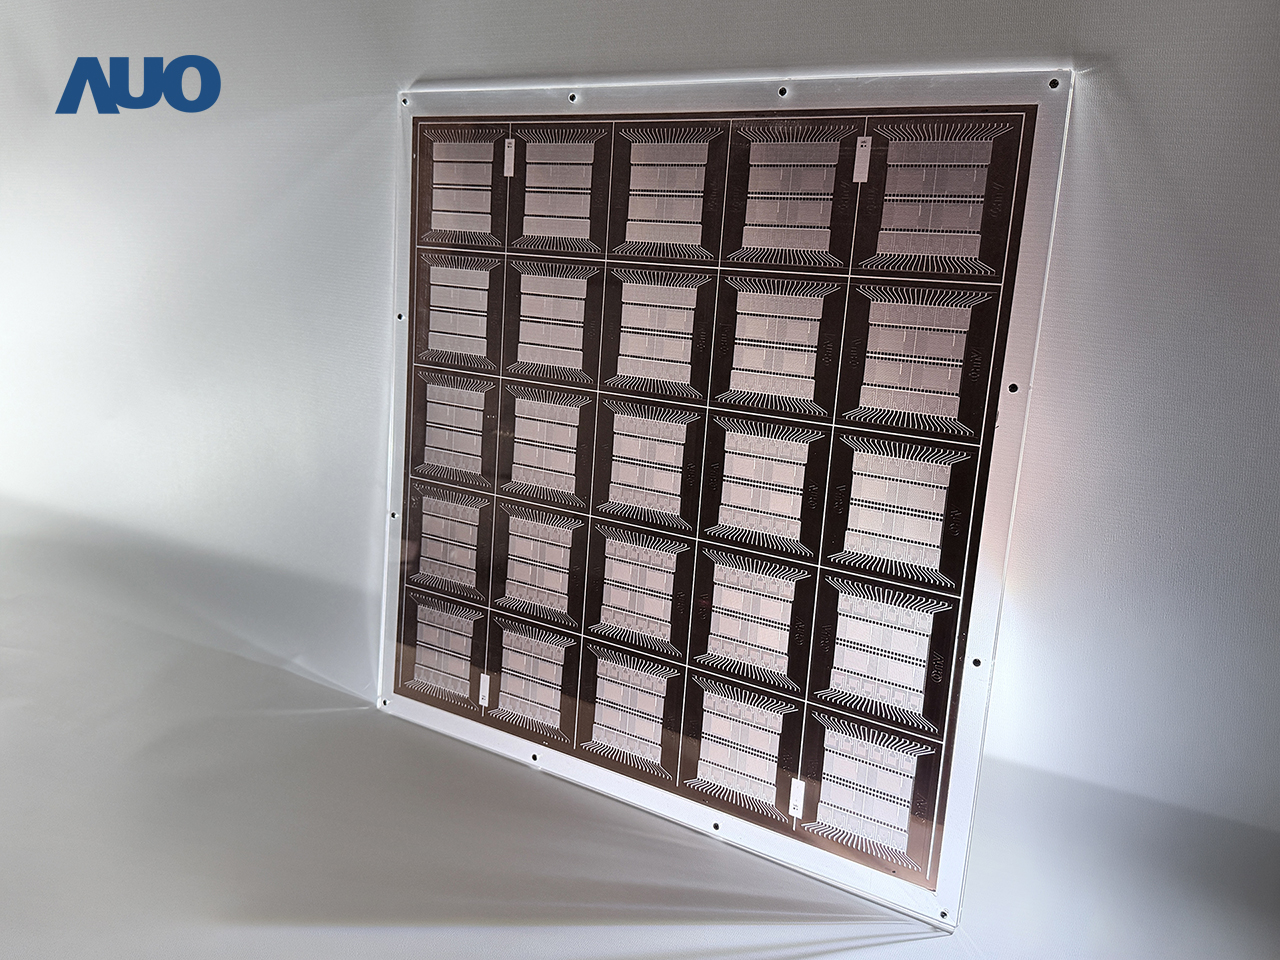 AUO will showcase Glass Core Substrates (GCS) technology for advanced packaging at SEMICON Taiwan 2026, combining Corning’s semiconductor-grade glass with AUO’s Redistribution Layer (RDL) process technology.
 AUO received global leadership recognition with a Double “A” rating from CDP for Climate Change and Water Security. In 2023, AUO’s headquarters GRC Building became the first in Taiwan to achieve ISO 14068 Carbon Neutral Verification, setting a pioneering industry benchmark
 AUO received global leadership recognition with a Double “A” rating from CDP for Climate Change and Water Security. Through the TNFD framework, AUO strengthens climate resilience by assessing and mitigating natural impacts across its operations.


 AUO, leveraging its leading display and sensing technologies, continues to drive diverse solutions across vertical markets. This year, AUO’s subsidiary AUO Display Plus (ADP), together with AUO Health, DentLabX, and 12 ecosystem partners to make a grand appearance at the 2025 Healthcare+ Expo Taiwan.
 AUO, together with subsidiaries AUO Display Plus (ADP), AUO Health, DentLabX, and 12 ecosystem partners, joins the 2025 Healthcare+ Expo Taiwan under the theme "Beyond 3D, Precision AI." By integrating display technology, image streaming, edge computing, and AI-assisted, AUO delivers efficient, precise, and intelligent diagnostic and treatment solutions for the healthcare industry.
 ADP introduces the “3D Microsurgical Imaging Solution,” extending 3D visualization capabilities from endoscopic surgeries to complex microsurgeries involving nerves, blood vessels, and lymphatics, providing an ultra-clear stereoscopic field to support precise and delicate surgical manipulation.
 ADP collaborates with ADLINK Technology and NaviFUS on the “NaviFUS® Neuronavigation-guided Focused Ultrasound System” leverages ADLINK’s medical-grade edge computing platform to integrate optical navigation with transcranial focused ultrasound. This non-invasive solution precisely directs energy to intracranial targets, temporarily opens the blood–brain barrier, and enhances drug delivery and therapeutic effectiveness.
 AUO Health continues to advance its TCM Digital Detection Solution by integrating AI technology. The Pulse Analysis uses algorithms and signal processing to analyze key pulse characteristics – including position, rate, form, force, and rhythm - providing visualized data to support evaluation of vascular elasticity and cardiopulmonary function.
 AUO announced that it will debut at CES 2026 through its newly established subsidiary, AUO Mobility Solutions, showcasing its innovative integration capabilities in smart cockpit solutions.
 AUO Mobility Solutions aims to deliver innovative smart cockpit solutions by integrating display technologies, computing platforms, and vehicle connectivity. It aims to create immersive, intelligent, and sustainable in-vehicle experiences while extending smart mobility services to meet the diverse needs of global OEM customers and end users.
Prompts
Click prompts to add them under the company line, click again to take one out, then copy the result into your AI chat. Shared by Asian Century Stocks and Uncovered Thai Stocks. Thank you.
AUO Corporation (ticker 2409.TW), listed in Taiwan.
Copied
ETFs Holding AUO Corporation
Exchange-traded funds whose newest published daily portfolio holds one of the company's listings, largest weight first.
| ETF | Weight in ETF | Shares | Market value | As of |
|---|---|---|---|---|
| DFEV | 0.10% | 2,582,600 | $ 2.287M | Nov 12, 2026 |
| NTSE | 0.08% | 46,800 | $ 48.039K | Jun 30, 2026 |
| AVXC | 0.06% | 292,000 | $ 244.171K | Nov 16, 2026 |
| AVSE | 0.05% | 137,600 | $ 115.061K | Nov 16, 2026 |
| DFAE | 0.05% | 5,178,200 | $ 4.586M | Nov 12, 2026 |
| DFEM | 0.05% | 4,828,800 | $ 4.277M | Nov 12, 2026 |
| AVEM | 0.04% | 13,677,160 | $ 11.437M | Nov 16, 2026 |
| DEXC | 0.04% | 108,000 | $ 95.652K | Nov 12, 2026 |
| AVES | 0.03% | 564,400 | $ 471.953K | Nov 16, 2026 |
| DFAX | 0.03% | 3,449,984 | $ 3.056M | Nov 12, 2026 |