更正本公司115年9月資金貸與資訊揭露明細表
Bull 0
Bear 0
Routine
|
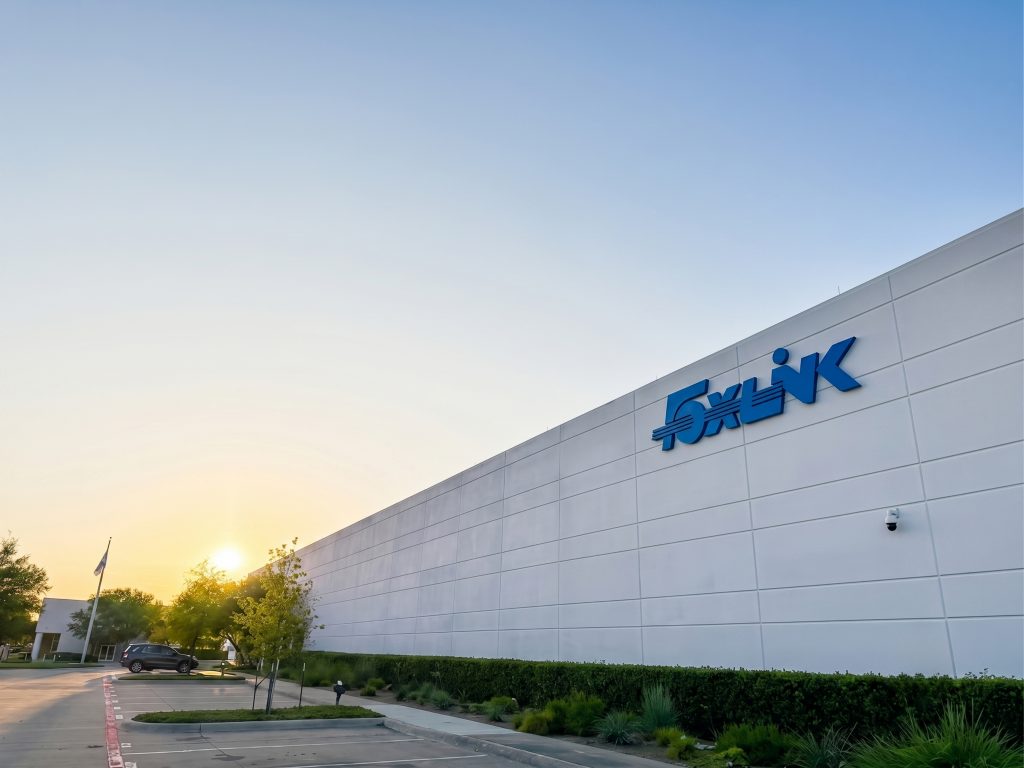
Cheng Uei Precision Industry Co., Ltd. is an electronics manufacturing services (EMS) provider specializing in the design, development, and manufacturing of electronic components and integrated systems. The company operates through its Foxlink brand, offering a vertical integration model that covers connectors, flexible printed circuits (FPC), cables, camera modules, plastic and metal components, accessories, audio-visual products, power management modules, wearable devices, and Internet of Things (IoT) solutions. Its services include OEM and ODM support, rapid tooling development, and automated production systems utilizing Industry 4.0 technologies such as AI, cloud computing, and data analytics. The company serves customers in consumer electronics and data center sectors, providing customized and standard products with capabilities in surface treatment, material analysis, and acoustic technology. Notable subsidiaries and brands include Foxlink, Foxlink FPC, and Foxlink Cables, which provide one-stop services from layout to final assembly. Summarised from the company's own disclosures |
Industry Electronics & Computer Distribution | Homepage foxlink.com |
| Sector Technology | IR page — | |
|
Tags
electronics manufacturing services, flexible printed circuits, connectors, camera modules, power management, wearable devices, internet of things, audio-visual products, plastic molding, cable assembly, Foxlink, Foxlink FPC, Foxlink Cables, SYNC ROBOTIC
|
Press page — |
Metrics
| Valuation | |
|---|---|
| Market cap | NT$ 13.606B |
| Market cap (USD) | $ 412.967M |
| P/E | 3.00 |
| PEG | — |
| P/BV | 0.48 |
| P/S | 0.18 |
| P/OCF | 3.61 |
| P/FCF | — |
| Dividend yield | — |
| Turnover / mcap | — |
| Returns | |
|---|---|
| ROE | -12.7% |
| ROI | -13.9% |
| ROIC | -55.9% |
| Profit margin | -3.2% |
| Growth | |
|---|---|
| Revenue growing | No |
| Profits growing | No |
| Revenue up 3y | No |
| Revenue up 5y | No |
| Earnings growth 3y (net profit CAGR) | — |
| Quality | |
|---|---|
| Profitable | No |
| Margin expanding | No |
| Buying back stock | No |
| Diluting (TTM) | No |
| Debt/Equity | — |
| Podcast bulls (TTM) | Sign up |
| Podcast bears (TTM) | Sign up |
| Podcast sentiment (TTM) | Sign up |
| Podcast sentiment % (TTM) | Sign up |
| News sentiment (TTM) | 0 |
| Quality score | -43.8% |
| Insiders | |
|---|---|
| Buys, 1w | Sign up |
| Buys, 1m | Sign up |
| Buys, 1y | Sign up |
| Sells, 1w | Sign up |
| Sells, 1m | Sign up |
| Sells, 1y | Sign up |
Sign up to see this company's insider trades
| Figure | FY 2025 | FY 2024 | FY 2023 | FY 2022 | FY 2021 | FY 2020 | FY 2019 | FY 2018 | FY 2017 | FY 2016 | FY 2015 | FY 2014 | FY 2013 | FY 2012 | FY 2011 | FY 2010 |
|---|---|---|---|---|---|---|---|---|---|---|---|---|---|---|---|---|
| Revenue | 95.016B | 98.397B | 90.551B | 94.103B | 86.801B | 89.552B | 97.82B | 87.911B | 93.624B | 90.5B | 108.233B | 91.068B | 106.156B | 102.877B | 81.597B | 56.997B |
| Net profit | -3.066B | 1.687B | 1.457B | 1.523B | 921.042M | 1.967B | 1.987B | 608.1M | 1.335B | 792.765M | 1.65B | 1.786B | 2.075B | 1.954B | 2.165B | 1.734B |
| Figure | FY 2025 | FY 2024 | FY 2023 | FY 2022 | FY 2021 | FY 2020 | FY 2019 | FY 2018 | FY 2017 | FY 2016 | FY 2015 | FY 2014 | FY 2013 | FY 2012 | FY 2011 | FY 2010 |
|---|---|---|---|---|---|---|---|---|---|---|---|---|---|---|---|---|
| Share price | 36.9 | 72.6 | 48.3 | 36.9 | 39.55 | 47.1 | — | — | — | — | — | — | — | — | — | — |
| Price performance 12m | -0.49 | 0.5 | 0.31 | -0.07 | -0.16 | — | — | — | — | — | — | — | — | — | — | — |
Sign up to see institutional holdings
Sign UpPodcast Mentions
Sign up to see podcast mentions and sentiment
Sign UpMaterial information published on MOPS, newest first, subjects as filed in Chinese, guarantee and loan balance notices and routine equipment purchases included. The link opens the company's material information on MOPS. Press releases from the company's own website, newest first.




Prompts
Click prompts to add them under the company line, click again to take one out, then copy the result into your AI chat. Shared by Asian Century Stocks and Uncovered Thai Stocks. Thank you.
Cheng Uei Precision Industry Co., Ltd. (ticker 2392.TW), listed in Taiwan.
Copied
ETFs Holding Cheng Uei Precision Industry Co., Ltd.
Exchange-traded funds whose newest published daily portfolio holds one of the company's listings, largest weight first.
| ETF | Weight in ETF | Shares | Market value | As of |
|---|---|---|---|---|
| AVEE | 0.03% | 39,000 | $ 38.052K | Nov 16, 2026 |
| DEXC | 0.01% | 17,000 | $ 17.299K | Nov 12, 2026 |
| DFEM | 0.01% | 458,000 | $ 466.064K | Nov 12, 2026 |
| DFSE | 0.00% | 21,000 | $ 21.37K | Nov 12, 2026 |
| DFAE | 0.00% | 315,000 | $ 320.546K | Nov 12, 2026 |
| DFEV | 0.00% | 37,000 | $ 37.651K | Nov 12, 2026 |
| DFAX | 0.00% | 129,050 | $ 131.322K | Nov 12, 2026 |
| AVEM | 0.00% | 999,000 | $ 974.718K | Nov 16, 2026 |
| AVES | 0.00% | 44,000 | $ 42.931K | Nov 16, 2026 |
| AVSE | 0.00% | 6,000 | $ 5,854.16 | Nov 16, 2026 |
| AVXC | 0.00% | 13,000 | $ 12.684K | Nov 16, 2026 |