代重要子公司-富相科技(股)公司新增資金貸與金額 達本公司最近期財務報表淨值百分之二以上者
Bull 0
Bear 3
Financing
2359.TW
|
Solomon Technology Corporation is a distributor and manufacturer of electronic components, energy equipment, and industrial automation solutions. The company operates through several business segments, including power generation systems (diesel and gas engines), LCD modules and displays, and electronic parts such as active, passive, and protection components. Key partnerships include acting as a distributor for Cummins, GE Jenbacher, Generac, and Rockwell Automation. The group also engages in EMS for niche products and provides integrated system design and maintenance services. Solomon Technology serves customers in the Greater China and Asia-Pacific regions, with service locations in Taiwan, mainland China, and the United States. The company was founded in 1973 and established the Solomon Group in 1999 to integrate its various business units. Summarised from the company's own disclosures, fiscal year ended Oct 2026 |
Industry Industrial Distribution | Homepage solomon.com.tw |
| Sector Industrials | IR page solomon.com.tw/shareholders/investor-conference | |
|
Tags
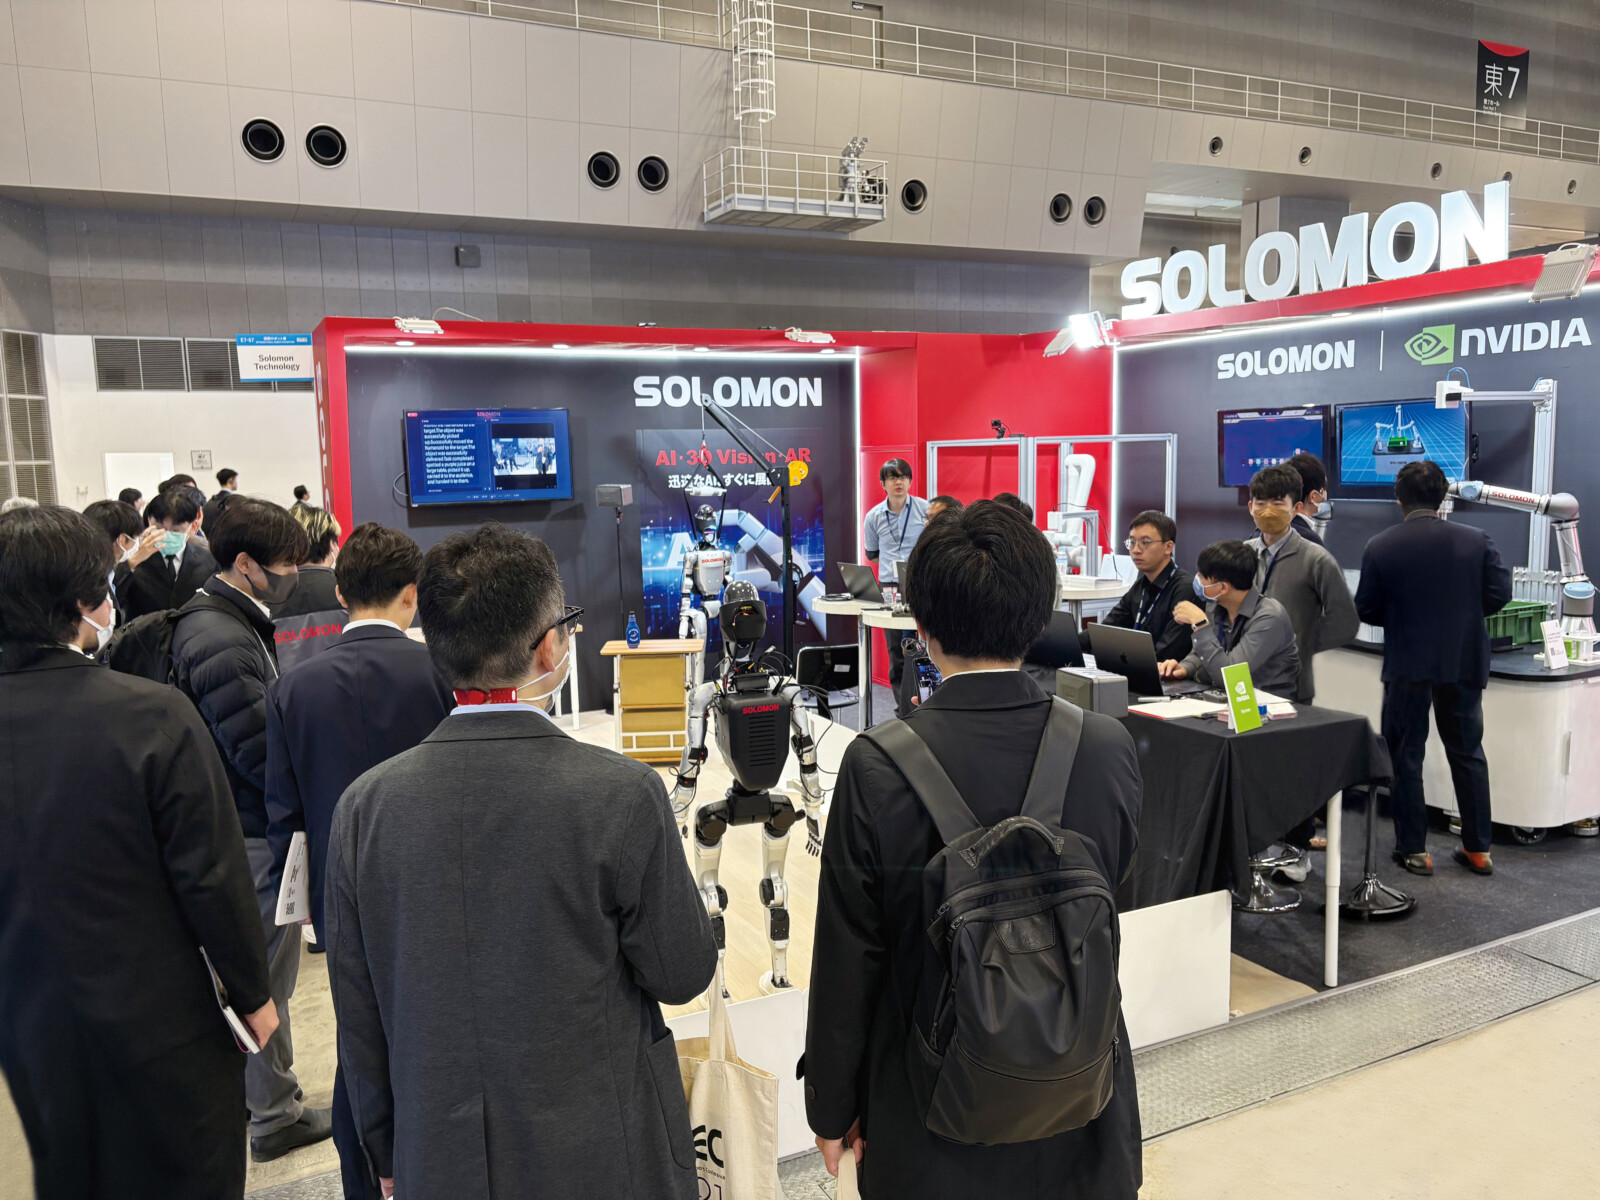
electronic components, power generation, lcd modules, industrial automation, ems, robotics, machine vision, gas engines, diesel engines, Cummins, GE Jenbacher, Generac, Rockwell Automation, TOSHIBA, SMC, Sanmen Technology, Xingmen Technology, Longmen Technology, Jingmen Technology, Gangmen Technology, Fuxiang Technology, Dawei Optoelectronics, Yuwen International Trade, Solomon Trade
|
Press page — |
Metrics
| Valuation | |
|---|---|
| Market cap | NT$ 13.212B |
| Market cap (USD) | $ 401.005M |
| P/E | 12.79 |
| PEG | — |
| P/BV | 2.05 |
| P/S | 2.98 |
| P/OCF | 121.39 |
| P/FCF | — |
| Dividend yield | — |
| Turnover / mcap | — |
| Returns | |
|---|---|
| ROE | 3.7% |
| ROI | 3.7% |
| ROIC | 0.99% |
| Profit margin | 5.0% |
| Growth | |
|---|---|
| Revenue growing | Yes |
| Profits growing | No |
| Revenue up 3y | No |
| Revenue up 5y | No |
| Earnings growth 3y (net profit CAGR) | -22.7% |
| Quality | |
|---|---|
| Profitable | Yes |
| Margin expanding | No |
| Buying back stock | No |
| Diluting (TTM) | No |
| Debt/Equity | — |
| Podcast bulls (TTM) | Sign up |
| Podcast bears (TTM) | Sign up |
| Podcast sentiment (TTM) | Sign up |
| Podcast sentiment % (TTM) | Sign up |
| News sentiment (TTM) | 0 |
| Quality score | -31.3% |
| Insiders | |
|---|---|
| Buys, 1w | Sign up |
| Buys, 1m | Sign up |
| Buys, 1y | Sign up |
| Sells, 1w | Sign up |
| Sells, 1m | Sign up |
| Sells, 1y | Sign up |
Sign up to see this company's insider trades
| Figure | FY 2025 | FY 2024 | FY 2023 | FY 2022 | FY 2021 | FY 2020 | FY 2019 | FY 2018 | FY 2017 | FY 2016 | FY 2015 | FY 2014 | FY 2013 | FY 2012 | FY 2011 | FY 2010 |
|---|---|---|---|---|---|---|---|---|---|---|---|---|---|---|---|---|
| Revenue | 4.248B | 3.503B | 4.22B | 5.25B | 3.899B | 3.527B | 3.737B | 3.949B | 4.01B | 4.046B | 4.603B | 5.162B | 5.671B | 5.445B | 5.539B | 6.984B |
| Net profit | 211.274M | 144.012M | 532.241M | 458.232M | 198.514M | 20.318M | 318.447M | 282.193M | 58.927M | 162.136M | 369.081M | 339.326M | 86.831M | 17.557M | 107.772M | 112.393M |
| Figure | FY 2025 | FY 2024 | FY 2023 | FY 2022 | FY 2021 | FY 2020 | FY 2019 | FY 2018 | FY 2017 | FY 2016 | FY 2015 | FY 2014 | FY 2013 | FY 2012 | FY 2011 | FY 2010 |
|---|---|---|---|---|---|---|---|---|---|---|---|---|---|---|---|---|
| Share price | 125.5 | 168 | 39.1 | 26.1 | 23.9 | 19.2 | — | — | — | — | — | — | — | — | — | — |
| Price performance 12m | -0.25 | 3.3 | 0.5 | 0.09 | 0.24 | — | — | — | — | — | — | — | — | — | — | — |
Sign up to see institutional holdings
Sign UpPodcast Mentions
Sign up to see podcast mentions and sentiment
Sign UpMaterial information published on MOPS, newest first, subjects as filed in Chinese, guarantee and loan balance notices and routine equipment purchases included. The link opens the company's material information on MOPS. Press releases from the company's own website, newest first.







Prompts
Click prompts to add them under the company line, click again to take one out, then copy the result into your AI chat. Shared by Asian Century Stocks and Uncovered Thai Stocks. Thank you.
Solomon Technology Corporation (ticker 2359.TW), listed in Taiwan.
Copied
ETFs Holding Solomon Technology Corporation
Exchange-traded funds whose newest published daily portfolio holds one of the company's listings, largest weight first.