The Acer EP130K offers paper-like visuals, while the Acer PD163Q P3 expands possibilities for versatile multi-tasking; debut alongside new portable projector, tablets, and 5G connectivity solutions 09/02/2026 Editor’s Summary The Acer EP130K ePaper…
The Acer EP130K offers paper-like visuals, while the Acer PD163Q P3 expands possibilities for versatile multi-tasking; debut alongside new portable projector, tablets, and 5G connectivity solutions
09/02/2026
Editor’s Summary
- The Acer EP130K ePaper monitor offers paper-like visual experiences perfect for reading and deep work, combined with touch support, up to 3200 x 2400 resolution, and both color and black-and-white modes.
- The Acer PD163Q P3 triple screen extender brings hybrid professionals a high-powered multi-tasking solution, connecting three 15.6-inch FHD IPS displays to a mobile device via a single USB-C connection.
- The Acer C350e is a portable LED projector
with Full HD resolution, 8,000 LED lumens, and a customizable AI Badge that also functions as a detachable remote.
- Acer debuts a new 16-inch model in the Iconia tablet
series—Acer Iconia X16—along with the upgraded Iconia X14, Iconia A16, and Iconia A14 tablets, all equipped with Android 16, MediaTek Helio G80 SoCs, and dual USB Type-C ports.
- The Acer Connect X6ES is a 5G CPE router delivering fast, stable connectivity via Wi-Fi 6E and 5G with intelligent failover; the Acer Connect D5P is a plug-and-play 5G dongle for high-speed mobile connectivity.
BERLIN (Sept. 2, 2026) Acer today announced a broad expansion of its product portfolio during its next@acer global press conference at IFA 2026, aimed at empowering how modern consumers play, work, and stay connected while on the go. The new lineup includes the Acer EP130K ePaper portable monitor; the Acer PD163Q P3 triple screen extender; the Acer C350e projector; the Acer Iconia X16, Iconia X14, Iconia A16, and Iconia A14 tablets; and the Acer Connect X6ES CPE router and the Acer Connect D5P dongle for 5G connectivity
.
Acer EP130K ePaper Monitor for Mobile Productivity and Reading
Combining the natural viewing experience of paper-like visuals with glare-free use, the new Acer EP130K
is designed for professionals who perform deep work for long periods, avid readers, and mobile users whose work takes them outdoors. The monitor supports touch directly on its ePaper screen, enabling stylus use as well as the intuitive feel of writing or drawing with a finger. It delivers a high resolution of up to 3200 x 2400 with a 60 Hz refresh rate, while offering both color and black-and-white modes for switching between the two as needed. A single USB Type-C cable supplies power from the host device to the low-power consumption panel, while its bi-stability functionality allows the image on screen to remain in place even when all power sources are removed.
 Acer EP130K ePaper monitor
 Acer EP130K ePaper monitor
Acer PD163Q P3 Triple Screen Extender for High-Powered Multi-Tasking
With three 15.6-inch FHD IPS panels, the Acer PD163Q P3
triple screen extender is perfectly suited to hybrid professionals who need a versatile productivity setup that allows them to visualize broad information or manage multiple workflows simultaneously. The device stands out for combining multiple screens with a space-saving, foldable design and minimized cables, and it enables up to four total displays when paired with a laptop.
When set up, the three screens on the Acer PD163Q P3 serve as independent, foldable display panels that support both extend and clone display modes, allowing users to dedicate one screen to each aspect of their workflow. A single USB-C cable connection to the host device simplifies connectivity and cable management, and the PD163Q P3 comes with an external USB-C power delivery adapter for charging. In addition, screen brightness can be adjusted uniformly across all three panels for optimizing viewing experiences.
 Acer PD163Q P3 triple screen extender
Acer C350e Projector: AI-Powered Portable Companion
More than a portable LED projector, the Acer C350e
is an AI-powered lifestyle companion for modern homes and families. When not projecting content, the projector remains active through its AI Badge, displaying personal photos, offering useful widgets, and enabling AI-driven interactions powered by Google Gemini. The AI Badge also functions as a detachable remote control for the projector.
For projecting content, it delivers excellent viewing experiences with crisp Full HD resolution at 1920 x 1080, backed by an 8,000 LED lumens light source and 350 ANSI lumens of brightness. Its swivel stand with tilt design enables hassle-free setup by offering 360-degree rotation and 120-degree tilting for projecting in a variety of spaces. A built-in small camera module powers auto focus, automatically adjusting the projection, while 2D keystone correction and 4-corner correction fix distortions for flawless viewing.
The Acer C350e is further equipped with a built-in smart system[1] that enables streaming from popular apps and platforms. It has two 3 W speakers, and its LED light source eliminates the need to wait for powering on and off. Its design also incorporates the principles of sustainability, with a 30,000-hour lifespan and mercury-free materials.
 Acer C350e projector
 Acer C350e projector
Premium Acer Iconia X16 and Iconia X14 Tablets for Entertainment and Education
The latest generation of Acer Iconia X series
tablets includes the new 16-inch Acer Iconia X16 (X16-21M) and the updated 14-inch Iconia X14 (X14-21M). Powered by MediaTek Helio G80 SoCs and running Android 16, the Iconia X series are premium-grade tablets that offer OLED screens with 1920 x 1200 resolution and a metal chassis in Matte Black.
This newest generation keeps the focus on entertainment and education for students and families; both new Iconia X tablets feature two USB Type-C ports—one dedicated to video input and one for charging and data—and offer a screen casting function, making them ideal for pairing with another device or screen for doing homework, watching movies or sports, and playing games.
In addition, the two new Acer Iconia X tablets embrace the signature tripod kickstand design for convenient screen access and are offered with several optional accessories: a stylus pen for on-the-spot notetaking and creativity and an attachable keyboard for seamless typing[2].
 Acer Iconia X16
 Acer Iconia X16
Entry Acer Iconia A16 and Iconia A14 Tablets for Entertainment and Education
Also focused on entertainment and education, the latest generation of the entry-level Acer Iconia A series
tablets include the upgraded 16-inch Acer Iconia A16 (A16-21M) and 14-inch Iconia A14 (A14-21M), offering IPS screens and a chassis in Vapor Silver. Like the latest Acer Iconia X series tablets, both A series models are powered by the MediaTek Helio G80 SoCs and offer dual USB Type-C ports—with one dedicated to video-only input—all upgrades over the previous generation aimed at maximizing value.
 Acer Iconia A16
 Acer Iconia A16
Acer Connect X6ES 5G CPE Router for Speed and Reliability
Housed in Acer's distinctively modern router design, the Acer Connect X6ES
is a 5G CPE router that delivers high-speed, reliable 5G and Wi-Fi 6E connectivity, helping homes and businesses stay connected even where traditional broadband falls short. The device offers dual 5G and WAN connectivity with intelligent failover to prioritize the best available connection to help ensure uninterrupted connectivity and low-latency networking. Featuring Wi-Fi 6E, 4x4 MIMO technology, and access to the 6 GHz spectrum, it delivers fast wireless performance for smoother streaming, collaboration, and productivity.
Advanced data security features include WPA2/WPA3 encryption, firewall protection, SIM lock functionality, and VPN support, while the Connect X6ES offers easy network management via a web browser. In addition, dual Gigabit Ethernet ports and a convenient WPS button simplify device onboarding.
 Acer Connect X6ES 5G CPE router
Acer Connect D5P 5G Dongle for High-Speed Connectivity on the Go
The Acer Connect D5P 5G dongle
delivers plug-and-play 5G connectivity for laptops and compatible computing devices, enabling seamless access for work, travel, and everyday mobility. It stands out for offering tri-SIM flexibility with support for eSIMs, nano SIMs, and vSIMs, and comes equipped with a preloaded eSIM profile. Supporting download speeds of up to 3.27 Gbps in 5G Standalone (SA) mode and up to 2.77 Gbps in Non Standalone (NSA) mode, it enables smoother downloads, uploads, and cloud collaboration.
The dongle seamlessly connects to mobile devices via USB Type-C, and USB-C tethering enables broad compatibility across multiple operating systems. For advanced data security, it provides WPA/WPA2 encryption, firewall protection, and SIM lock support. The compact, lightweight design is made to fit easily into a bag or laptop kit.
 Acer Connect D5P 5G dongle
Pricing and Availability
The Acer EP130K monitor will be available in North America in Q1’2027, starting at USD 749.99; in EMEA in Q1’2027, starting at EUR 749; and in Australia in Q1’2027, starting at AUD 1,499.
The Acer PD163Q P3 triple screen extender will be available in North America in Q1’2027, starting at USD 349.99; in EMEA in Q1’2027, starting at EUR 349; and in Australia in Q1’2027, starting at AUD 899.
The Acer C350e projector will be available in EMEA in Q1’2027, starting at EUR 199.
The Acer Iconia X and A series tablets will be available in North America and EMEA in Q4’2026.
The Acer Connect X6ES 5G CPE router will be available in EMEA in Q1’2027, starting at EUR 299.
The Acer Connect D5P 5G dongle will be available in North America in December 2026, starting at USD 299.99; and in EMEA in Q1’2027, starting at EUR 249.
Acer Iconia Duo tablets launched at Computex 2026
are now available in North America and in select markets in EMEA.
Exact specifications, prices, and availability will vary by region. To learn more about availability, product specifications and prices in specific markets, please contact your nearest Acer office via www.acer.com
.
Monitor Specifications
|
|
| Name |
Acer EP130K |
| Display Size |
13.3" |
| Panel Type |
ePaper |
| Max. Resolution and Refresh Rate |
Black and white: 3200 x 2400 @ 60 HzColor: 1600 x 1200 @ 60 Hz |
| Tear Technology |
N/A |
| Surface Type |
Matte |
| Response Time |
20 ms (GTG) |
| Contrast Ratio |
N/A |
| Brightness |
N/A |
| Viewing Angle |
178° (H), 178° (V) |
| Color Gamut |
N/A |
| Colors |
4096 |
| Bits |
N/A |
| Input Signal |
1 mini-HDMI + 2 USB Type-C + SPK + audio out |
| VESA Wall Mounting |
N/A |
| Speakers |
1 W x 2 |
| Power Supply (100 - 240 V) |
USB Type-C (12 V 1.25 A / 5 V 3 A) |
| Tilt/Swivel/Height Adjustment/Pivot |
0°~180° / N/A / N/A / N/A |
|
|
| Name |
Acer PD163Q P3 |
| Display Size |
Three 15.6” |
| Panel Type |
IPS |
| Max. Resolution and Refresh Rate |
1920 x 1080 @ 60 Hz |
| Tear Technology |
N/A |
| Surface Type |
Matte |
| Response Time |
8 ms (GTG) |
| Contrast Ratio |
100,000,000:1 (ACM) |
| Brightness |
250 nits |
| Viewing Angle |
170° (H), 170° (V) |
| Color Gamut |
45% NTSC |
| Colors |
16.7 M |
| Bits |
6 Bits + FRC |
| Input Signal |
2 USB Type-C |
| VESA Wall Mounting |
75 x 75 mm |
| Speakers |
N/A |
| Power Supply (100 - 240 V) |
External, 45W |
| Tilt/Swivel/Height Adjustment/Pivot |
0°~270° (upper display) / N/A / N/A / N/A |
Projector Specifications
|
|
| Name |
Acer C350e |
| Resolution |
1080p (1,920 x 1,080)Maximum supported: 4K (3,840 x 2,160) |
| Brightness |
8,000 LED Lumens350 ANSI Lumens |
| Light Source |
LED |
| Aspect Ratio |
16:9 (native), 4:3 (supported) |
| Dynamic Contrast Ratio |
1,000:1 |
| Throw Ratio |
1.3 (69.5"@2m) |
| Zoom Ratio |
1x |
| Lamp Life |
Up to 30,000 hours |
| Projection Lens |
F = 2.6, auto focus |
| Keystone Correction |
+/-30° (Vertical, Manual & Auto)+/-30° (Horizontal, Manual)4-corner adjustment |
| Smart System |
Yes |
| Audio |
3 W speaker x 2Bluetooth wireless audio (v5.4, Out) |
| Noise Level |
35 dBA (Standard) |
| Input Interface |
HDMI 1.4 (HDCP) x 1USB (Type A 2.0) x1, share output port |
| Output Interface |
DC Out (5V / 0.5A, USB Type A 2.0) x 1PC audio (3.5 mm mini jack) x 1 |
| Dimensions |
137.5 x 135.7 x 191.9 mm (5.4" x 5.3" x 7.6") |
| Weight |
0.93 kg (2.05 lbs) |
Tablet Specifications
|
|
| Name |
Acer Iconia X16 / Acer Iconia X14 |
| Model |
X16-21M / X14-21M |
| Operating System |
Android 16 |
| Processor |
MediaTek Helio G80 |
| Memory |
6 GB onboard LPDDR4X |
| Storage |
128 GB eMMC |
| Display |
16-inch or 14-inch OLED display, 1920 x 1200 resolution, 16:10 aspect ratio, high brightness (300 nits for 16” and 400 nits for 14”), wide color gamut (100% DCI-P3 for 14” and 95% DCI-P3 for 16”), Integrated multi-touch; wide viewing angle of up to 170 degrees |
| Camera |
Front (user-facing): 5 MP, 2592 x 1944 resolution, 5M at 30 fpsRear (world-facing): 8 MP, 3264 x 2448 resolution, 8M at 30 fps |
| Audio |
Quad built-in stereo speakers; one built-in digital microphone |
| Ports |
Two USB Type-C ports (one supports video only, one supports charging and data transfers), microSD card slot (up to 2 TB) |
| Battery |
30.4 Wh, 8,000 mAh, 3.8 V 2-cell Li-ion battery pack; battery life up to 10 hours[3] |
| Networking |
Dual band Wi-Fi 5, Bluetooth® 5.0 |
| Dimensions and Weight |
16-inch model:367.36 (W) x 243.92 (D) x 9.3/9.3 (H) mm (14.46 x 9.6 x 0.37/0.37 inches), pad only0.98 kg (2.16 lbs.) with 2-cell battery pack14-inch model:322.08 (W) x 215.98 (D) x 9.1/9.1 (H) mm (12.68 x 8.5 x 0.36/0.36 inches), pad only0.91 kg (2.01 lbs.) with 2-cell battery pack |
| Accessories |
Included: Tripod-style kickstandOptional: Active stylus pen, detachable keyboard |
|
|
| Name |
Acer Iconia A16 / Acer Iconia A14 |
| Model |
A16-21M / A14-21M |
| Operating System |
Android 16 |
| Processor |
MediaTek Helio G80 |
| Memory |
6 GB onboard LPDDR4X |
| Storage |
128 GB eMMC |
| Display |
16-inch or 14-inch IPS display, 1920 x 1200 resolution, 16:10 aspect ratio, high brightness (300 nits for 16” and 350 for 14”), LED-backlit LCD, Integrated multi-touch; wide viewing angle of up to 170 degrees |
| Camera |
Front (user-facing): 5 MP, 2592 x 1944 resolution, 5M at 30 fpsRear (world-facing): 8 MP, 3264 x 2448 resolution, 8M at 30 fps |
| Audio |
Quad built-in stereo speakers; one built-in digital microphone |
| Ports |
Two USB Type-C ports (one supports video only, one supports charging and data transfers), microSD card slot (up to 2 TB) |
| Battery |
30.4 Wh, 8,000 mAh, 3.8 V 2-cell Li-ion battery pack; battery life up to 10 hours[3] |
| Networking |
Dual band Wi-Fi 5, Bluetooth® 5.0 |
| Dimensions and Weight |
16-inch model:367.36 (W) x 243.92 (D) x 9.3/9.3 (H) mm (14.46 x 9.6 x 0.37/0.37 inches), pad only1.29 kg (2.84 lbs.) with 2-cell battery pack14-inch model:322.08 (W) x 215.98 (D) x 9.1/9.1 (H) mm (12.68 x 8.5 x 0.36/0.36 inches), pad only1.0 kg (2.2 lbs.) with 2-cell battery pack |
| Accessories |
Included: Tripod-style kickstandOptional: Active stylus pen, detachable keyboard |
Connectivity Specifications
|
|
| Name |
Acer Connect X6ES 5G CPE |
| Model |
X6ES |
| Software |
OpenWRT |
| Memory |
1 GB LPDDR4 |
| Storage |
512 MB eMMC |
| Connectivity |
5G NR, 4G LTE, 3G WCDMA, and Wi-Fi 6E (dual-band 2.4 GHz + 5 GHz/6 GHz) |
| SIM |
Nano SIM |
| Connector Type |
USB Type-C, 12V 3A DC-in, two RJ45 ports (WAN port and LAN port) |
| Color |
White |
| Dimensions and Weight |
101 mm x 101 mm x 206 mm930 g (±10g) |
| Maximum Connected Devices |
128 |
|
|
| Name |
Acer Connect D5P 5G dongle |
| Model |
D5P |
| Memory |
2 GB LPDDR4x |
| Storage |
32 GB eMMC |
| Connectivity |
5G NR, 4G LTE, 3G WCDMA |
| SIM |
Nano SIM, eSIM (preloaded profile), vSIM |
| Connector Type |
USB Type-C 3.0, 5V 3A DC-in |
| Color |
Black |
| Dimensions and Weight |
102.7 mm x 51 mm x 16.7 mm80 g (±10 g) |
[1] The smart system is a third-party app installation service provided by Zeasn Whale TV. The use of any associated third-party apps or services is subject to the applicable terms and conditions of the respective app developers.
[2] Accessories may be sold separately. Please check model and/or region availability.
[3] Actual battery life may vary considerably by specifications, depending on product model, configuration, applications, power management settings, operating conditions, and features utilized. Performance variation also arises based on components in use, which includes but is not limited to the processor, RAM capacity, storage, display and resolution, etc.
Share
Copy URL
Latest stories
Acer Reports September Consolidated Revenues of NT$34.74 Billion, Highest in 14 Years
Revenues for Third Quarter and Year-to-September Achieved Historical Highs for the Same Period in 13 Years
 news.acer.com
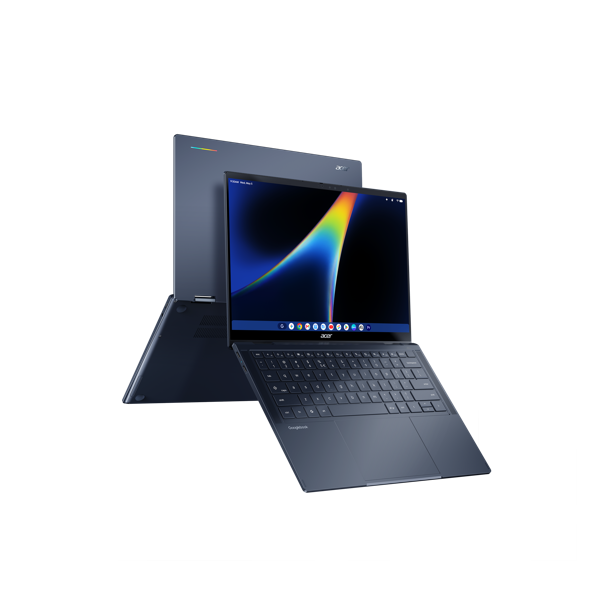
Acer Debuts First Googlebook - the Embodiment of Premium, Intelligence-Powered Hardware
Designed for Gemini Intelligence, new Acer Googlebook 14 ushers in new era of seamless workflows across devices
 news.acer.com
Acer Reports Revenues for August at NT$30.18 Billion and Year-to-August at NT$214.81 Billion; Both Marking 13-Year Highs for the Same Period
TAIPEI (September 8, 2026) Acer Inc. (TWSE: 2353) announced its consolidated revenues for August at NT$30.18 billion, up 38.4% year-on-year (YoY). Year-to-August consolidated revenues reached NT$214.81 billion with 25.1% YoY growth. In both August and year-to-August, Acer achieved record revenue highs in 13 years for the same period.
 news.acer.com
Get updates in your mailbox
Your email addressSubscribe
By clicking "Subscribe" I confirm I have read and agree to the Privacy Policy
.
About Acer
Founded in 1976, Acer is one of the world’s top technology companies with a presence in more than 160 countries. The company continues to evolve by embracing innovation across its offerings, which include computers and displays, while branching out to new businesses. The Acer Group employs nearly 12,000 employees that contribute to the research, design, marketing, sales, and support of products, solutions, and services that break barriers between people and technology. Visit www.acer.com

 Acer Googlebook 14
 Acer Googlebook 14
 news.acer.com
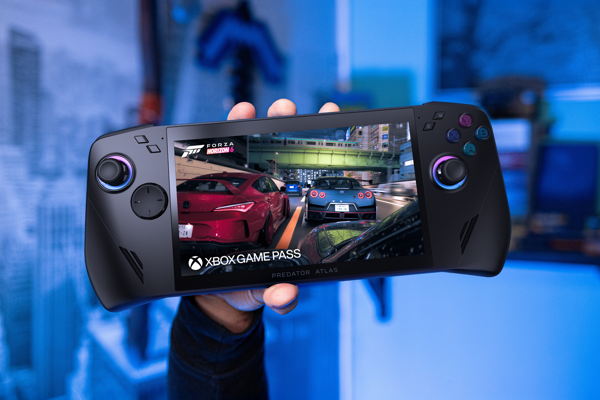
 Predator Atlas 7
 Predator Atlas 7
 Predator Atlas 7
 Project DualPlay Mini
 Project DualPlay Mini
 Project DualPlay Mini
 Project DualPlay Mini
 Project DualPlay Mini
 Acer Swift Blade 14
 Acer Swift Blade 14
 Acer Swift Air 16
 Acer Swift Air 16
 Predator ES Thunder Pro e-scooter
 Acer Veriton RI110 AI Mini Workstation
 Acer Veriton RI110 AI Mini Workstation
 Acer Veriton RI110 AI Mini Workstation
 Predator XB253Q U1
 Predator X32 V3 monitor
 Predator XB273K V7
 Acer Nitro XV275X P
 Acer Nitro XZ340CKR P
 Acer Nitro XV275U Z2
 Acer Nitro XV270U Z3
 Acer ProDesigner PE270X P
 Acer EP130K ePaper monitor
 Acer EP130K ePaper monitor
 Acer PD163Q P3 triple screen extender
 Acer C350e projector
 Acer C350e projector
 Acer Iconia X16
 Acer Iconia X16
 Acer Iconia A16
 Acer Iconia A16
 Acer Connect X6ES 5G CPE router
 Acer Connect D5P 5G dongle
 Aspire G 3D 16
 Aspire S 27
 Aspire S 27
 DotBook
 DotBook
 DotBook

 Acer SFF RTX Spark
 Acer SFF RTX Spark