公告本公司董事會通過115年第三季合併財務報告
Bull 0
Bear 0
Routine
2349.TW
|
RITEK Corporation is a diversified manufacturer established in 1988, originally founded to produce vinyl records before expanding into various technology and industrial sectors. The company operates across multiple business segments, including storage media, nano-technology, OLED displays, and green energy. Key product lines include data storage products, high-definition display panels, semiconductor components, and solar products. RITEK also engages in the production of silicone chemicals and biotechnology applications. The company serves global markets with offices in seven countries, offering diverse services and solutions in creative industries, international real estate, and public service sectors. Summarised from the company's own disclosures, fiscal year ended Oct 2026 |
Industry Conglomerates | Homepage ritek.com |
| Sector Industrials | IR page ritek.com/investor_relations | |
|
Tags
storage media, oled displays, green energy, semiconductor, silicone chemicals, biotech, nano-technology, solar products, real estate, creative industries
|
Press page ritek.com/news |
Metrics
| Valuation | |
|---|---|
| Market cap | NT$ 6.25B |
| Market cap (USD) | $ 189.693M |
| P/E | 293.34 |
| PEG | — |
| P/BV | 1.12 |
| P/S | 0.84 |
| P/OCF | 7.19 |
| P/FCF | — |
| Dividend yield | — |
| Turnover / mcap | — |
| Returns | |
|---|---|
| ROE | -4.5% |
| ROI | -4.6% |
| ROIC | -1.7% |
| Profit margin | -3.3% |
| Growth | |
|---|---|
| Revenue growing | No |
| Profits growing | No |
| Revenue up 3y | No |
| Revenue up 5y | No |
| Earnings growth 3y (net profit CAGR) | — |
| Quality | |
|---|---|
| Profitable | No |
| Margin expanding | Yes |
| Buying back stock | No |
| Diluting (TTM) | No |
| Debt/Equity | — |
| Podcast bulls (TTM) | Sign up |
| Podcast bears (TTM) | Sign up |
| Podcast sentiment (TTM) | Sign up |
| Podcast sentiment % (TTM) | Sign up |
| News sentiment (TTM) | 0 |
| Quality score | -43.8% |
| Insiders | |
|---|---|
| Buys, 1w | Sign up |
| Buys, 1m | Sign up |
| Buys, 1y | Sign up |
| Sells, 1w | Sign up |
| Sells, 1m | Sign up |
| Sells, 1y | Sign up |
Sign up to see this company's insider trades
| Figure | FY 2025 | FY 2024 | FY 2023 | FY 2022 | FY 2021 | FY 2020 | FY 2019 | FY 2018 | FY 2017 | FY 2016 | FY 2015 | FY 2014 | FY 2013 | FY 2012 | FY 2011 | FY 2010 |
|---|---|---|---|---|---|---|---|---|---|---|---|---|---|---|---|---|
| Revenue | 7.494B | 7.264B | 7.63B | 7.739B | 7.477B | 6.578B | 7.779B | 9.359B | 9.797B | 10.484B | 11.08B | 12.354B | 14.754B | 17.359B | 21.425B | 19.558B |
| Net profit | -246.734M | 46.748M | -303.314M | -149.267M | -341.235M | -897.386M | -2.255B | -1.293B | -2.43B | -2.233B | -2.163B | -3.316B | -3.127B | -2.242B | -2.257B | -1.305B |
| Figure | FY 2025 | FY 2024 | FY 2023 | FY 2022 | FY 2021 | FY 2020 | FY 2019 | FY 2018 | FY 2017 | FY 2016 | FY 2015 | FY 2014 | FY 2013 | FY 2012 | FY 2011 | FY 2010 |
|---|---|---|---|---|---|---|---|---|---|---|---|---|---|---|---|---|
| Share price | 15.3 | 13.9 | 8.2 | 7.61 | 11.75 | 10.9 | — | — | — | — | — | — | — | — | — | — |
| Price performance 12m | 0.1 | 0.7 | 0.08 | -0.35 | 0.08 | — | — | — | — | — | — | — | — | — | — | — |
Sign up to see institutional holdings
Sign UpPodcast Mentions
Sign up to see podcast mentions and sentiment
Sign UpMaterial information published on MOPS, newest first, subjects as filed in Chinese, guarantee and loan balance notices and routine equipment purchases included. The link opens the company's material information on MOPS. Press releases from the company's own website, newest first.
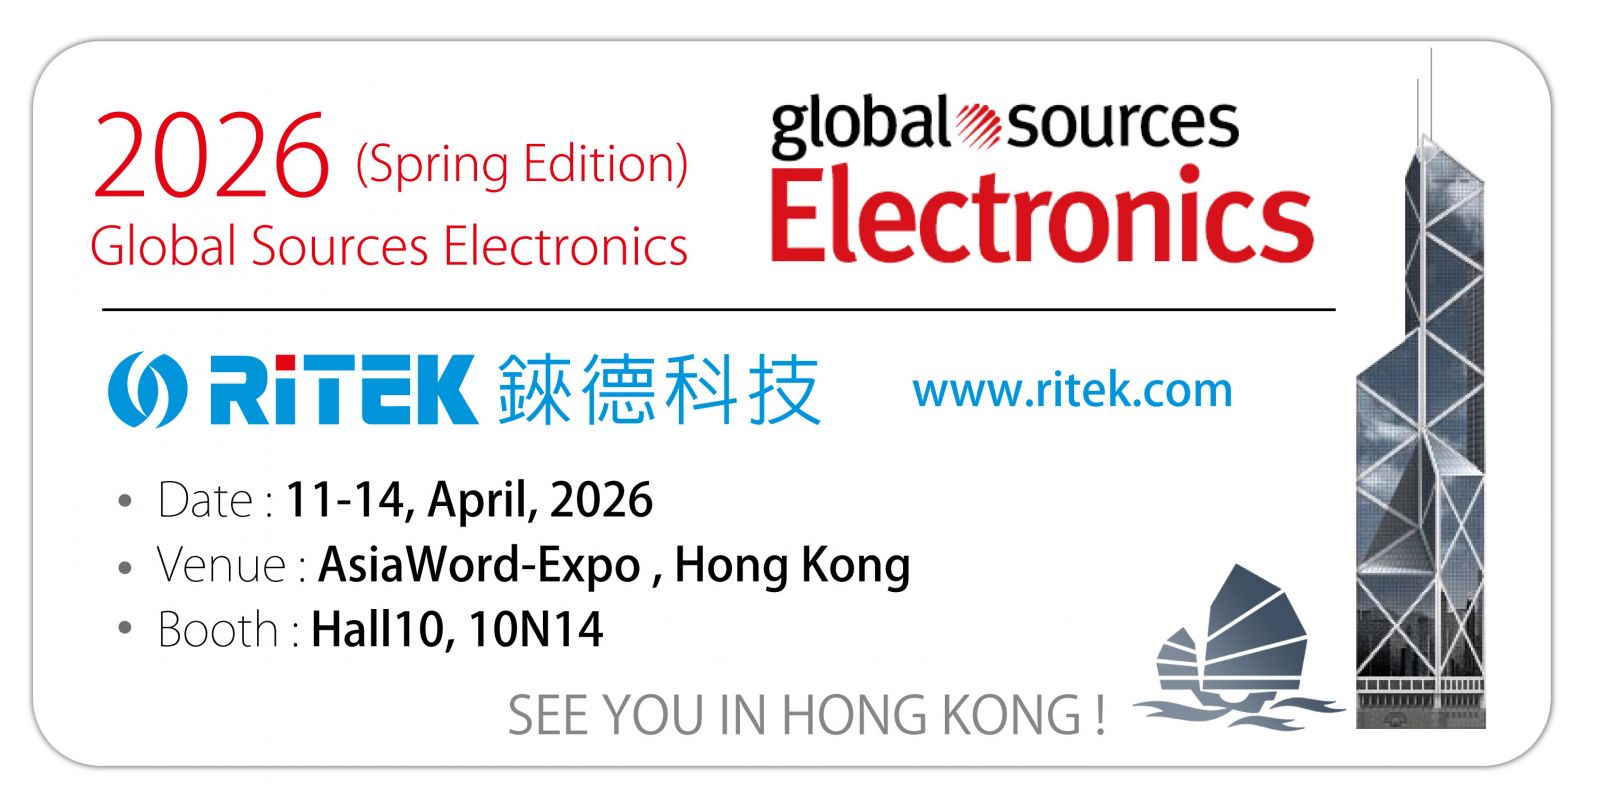
2026 Global Sources Electronics (Autumn Edition), welcome to RITEK booth! - RITEK Group
Bull 0
Bear 0
Routine

==========================================================================================================
Language

2026 Global Sources Electronics (Autumn Edition), welcome to RITEK booth!
2026-09-08
Date:11 - 14, October, 2026
Venue:AsiaWord-Expo, Hong Kong
Booth:10N14


©RITEK CORPORATION. All Rights Reserved. | Privacy
Designed by Da-vinci
公告本公司火災事件說明
Bull 0
Bear 0
Other
Prompts
Click prompts to add them under the company line, click again to take one out, then copy the result into your AI chat. Shared by Asian Century Stocks and Uncovered Thai Stocks. Thank you.
RITEK Corporation (ticker 2349.TW), listed in Taiwan.
Copied
ETFs Holding RITEK Corporation
Exchange-traded funds whose newest published daily portfolio holds one of the company's listings, largest weight first.
| ETF | Weight in ETF | Shares | Market value | As of |
|---|---|---|---|---|
| AVEE | 0.01% | 61,000 | $ 18.485K | Nov 16, 2026 |
| DFSE | 0.01% | 103,000 | $ 29.929K | Nov 12, 2026 |
| DFEM | 0.00% | 963,000 | $ 279.82K | Nov 12, 2026 |
| DFEV | 0.00% | 236,000 | $ 68.575K | Nov 12, 2026 |
| DFAE | 0.00% | 586,000 | $ 170.275K | Nov 12, 2026 |
| DFAX | 0.00% | 430,547 | $ 125.105K | Nov 12, 2026 |
| AVEM | 0.00% | 64,281 | $ 19.479K | Nov 16, 2026 |
| AVSE | 0.00% | 10,000 | $ 3,030.28 | Nov 16, 2026 |
| AVXC | 0.00% | 15,000 | $ 4,545.42 | Nov 16, 2026 |