代子公司D-Link JAPAN K.K Ltd(簡稱DJP)公告資金貸與相關事宜
Bull 0
Bear 0
Routine
2332.TW
|
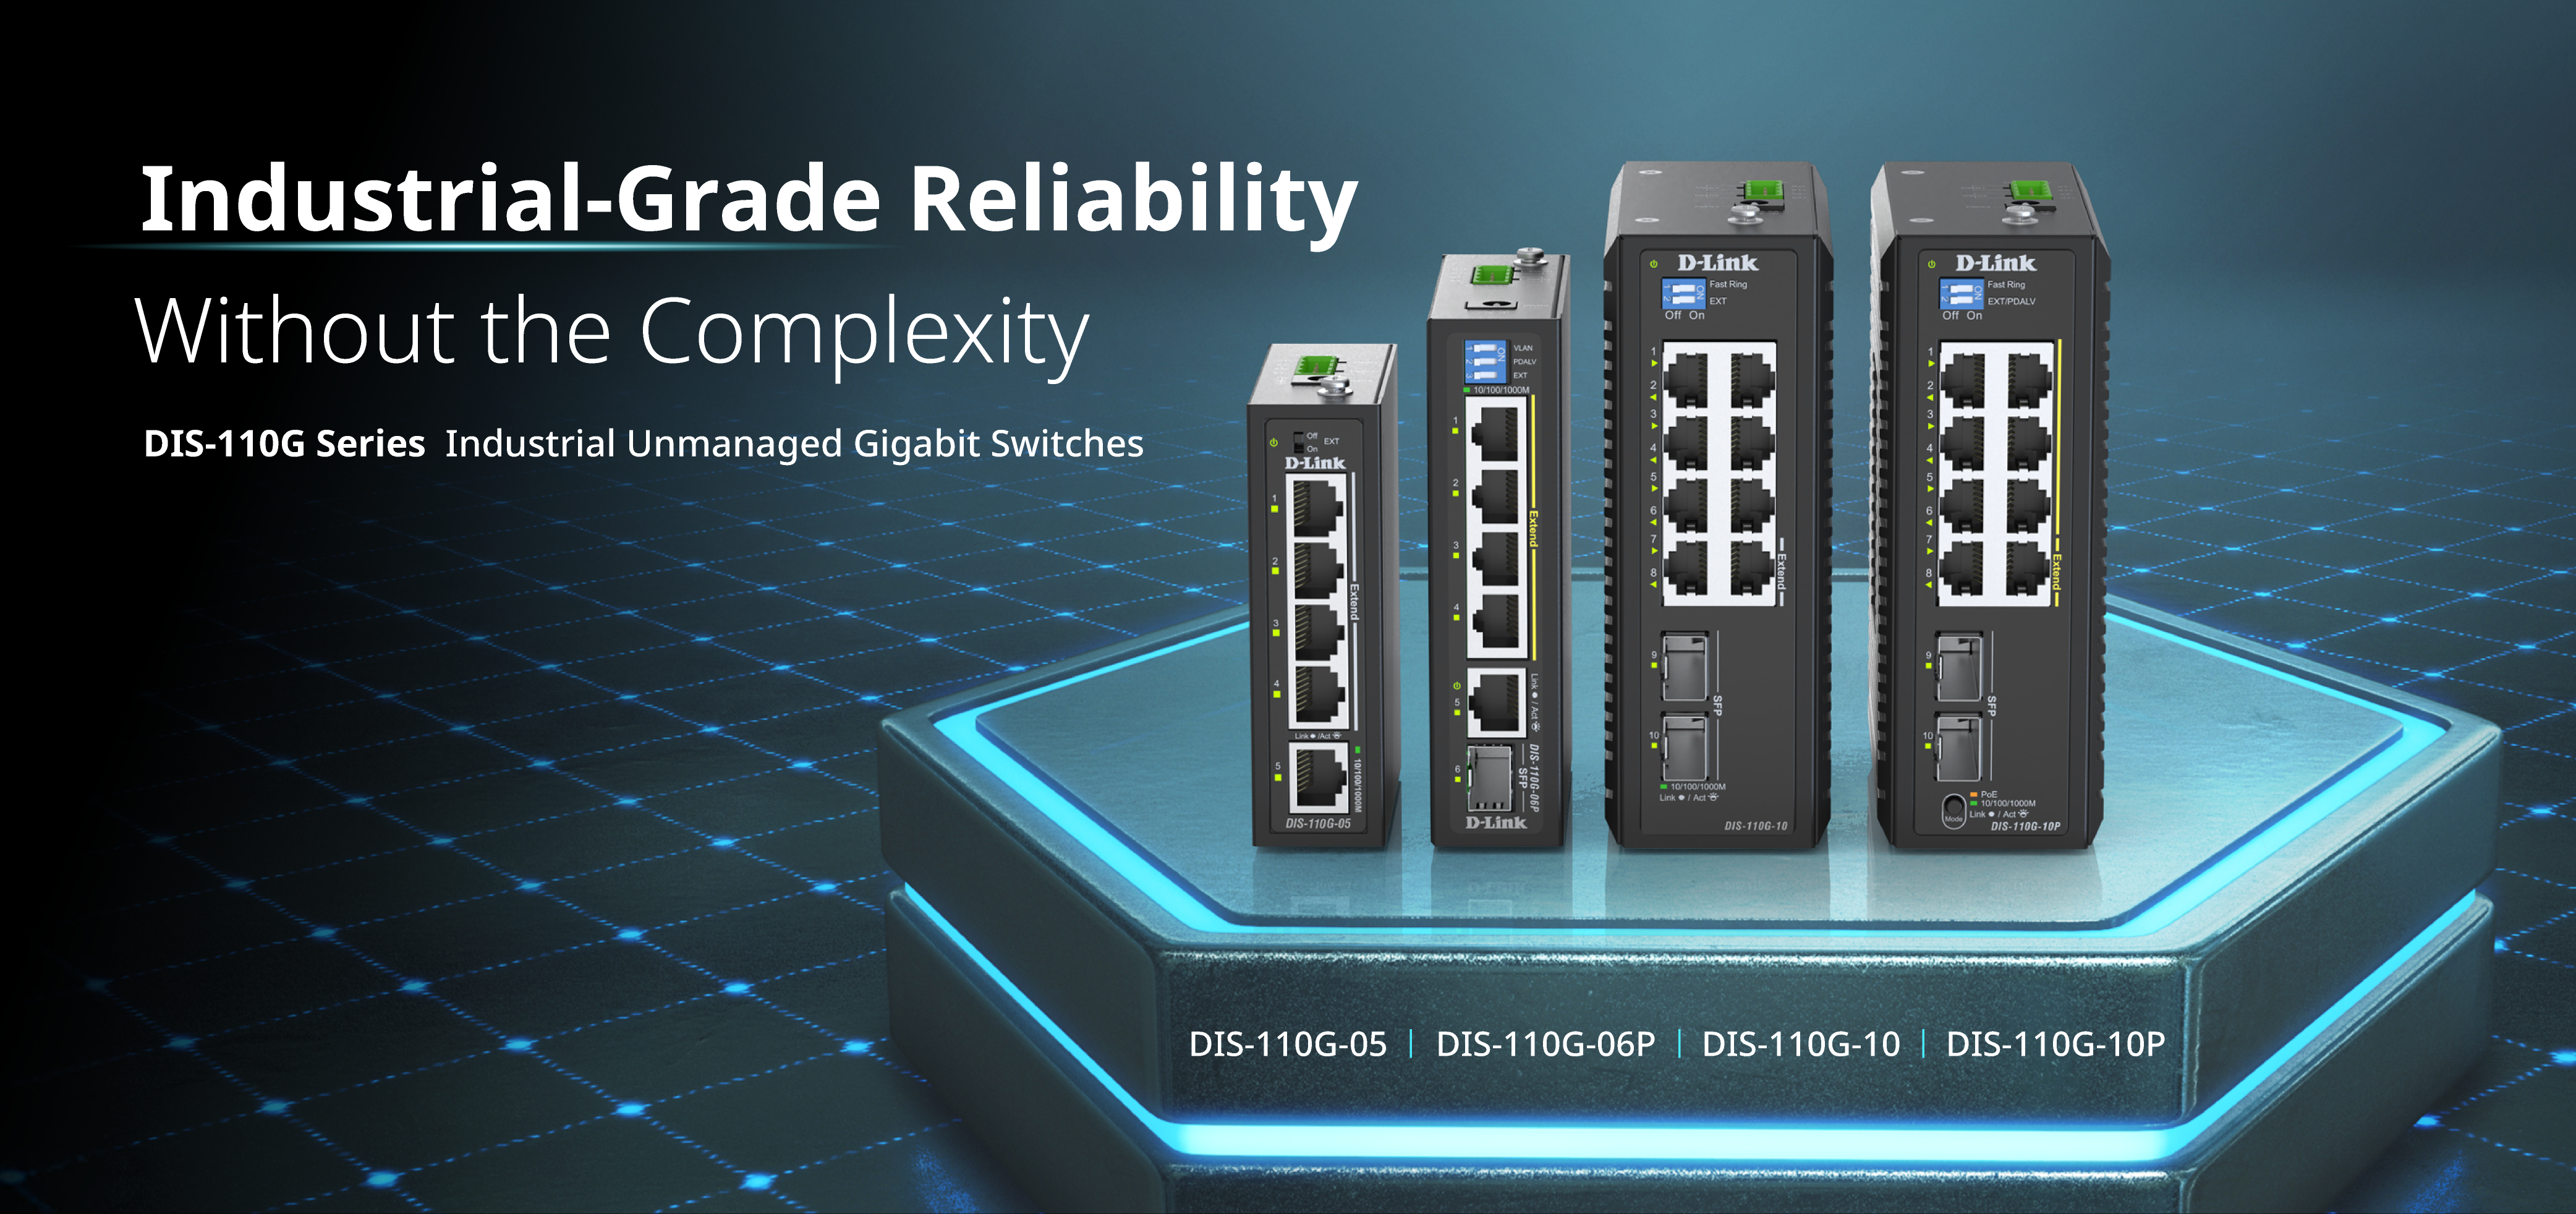
D-Link Corporation is a networking equipment manufacturer established in 1987. The company provides a portfolio of consumer, business, and industrial networking solutions, including Wi-Fi routers, range extenders, mesh Wi-Fi systems, smart home security cameras, and smart plugs. Its business segment offers enterprise-grade networking, wireless LAN, and surveillance solutions, along with managed gigabit switches featuring Layer 2 and Layer 3 capabilities. D-Link serves individuals, homes, small businesses, enterprises, governments, and service providers globally. The company provides AI-powered cloud management services through its Nuclias platform for remote network control. It also offers scalable IIoT connectivity solutions for industrial applications, including the DIS-110G series industrial switches. D-Link operates sales locations in multiple countries and serves customers across diverse industries. Summarised from the company's own disclosures, fiscal year ended Oct 2026 |
Industry Communication Equipment | Homepage dlink.com |
| Sector Technology | IR page dlink.com | |
|
Tags
wi-fi routers, mesh wi-fi, smart home security, enterprise networking, wireless lan, managed switches, cloud management, industrial iot, surveillance solutions, network infrastructure, Nuclias, DIS-110G Series, S Series, DAP-E3620 Series, D-Link Green
|
Press page dlink.com/en/press-centre/press-releases |
Metrics
| Valuation | |
|---|---|
| Market cap | NT$ 9.312B |
| Market cap (USD) | $ 282.626M |
| P/E | -48.75 |
| PEG | — |
| P/BV | 1.13 |
| P/S | 0.66 |
| P/OCF | 7.93 |
| P/FCF | — |
| Dividend yield | — |
| Turnover / mcap | — |
| Returns | |
|---|---|
| ROE | -6.2% |
| ROI | -6.5% |
| ROIC | -3.1% |
| Profit margin | -4.0% |
| Growth | |
|---|---|
| Revenue growing | No |
| Profits growing | No |
| Revenue up 3y | No |
| Revenue up 5y | No |
| Earnings growth 3y (net profit CAGR) | — |
| Quality | |
|---|---|
| Profitable | No |
| Margin expanding | No |
| Buying back stock | No |
| Diluting (TTM) | No |
| Debt/Equity | — |
| Podcast bulls (TTM) | Sign up |
| Podcast bears (TTM) | Sign up |
| Podcast sentiment (TTM) | Sign up |
| Podcast sentiment % (TTM) | Sign up |
| News sentiment (TTM) | 13 |
| Quality score | -47.1% |
| Insiders | |
|---|---|
| Buys, 1w | Sign up |
| Buys, 1m | Sign up |
| Buys, 1y | Sign up |
| Sells, 1w | Sign up |
| Sells, 1m | Sign up |
| Sells, 1y | Sign up |
Sign up to see this company's insider trades
| Figure | FY 2025 | FY 2024 | FY 2023 | FY 2022 | FY 2021 | FY 2020 | FY 2019 | FY 2018 | FY 2017 | FY 2016 | FY 2015 | FY 2014 | FY 2013 | FY 2012 | FY 2011 | FY 2010 |
|---|---|---|---|---|---|---|---|---|---|---|---|---|---|---|---|---|
| Revenue | 13.367B | 14.395B | 15.941B | 17.078B | 15.525B | 15.179B | 16.996B | 19.383B | 19.316B | 22.922B | 26.614B | 30.306B | 30.558B | 32.467B | 32.506B | 33.857B |
| Net profit | -539.535M | 35.319M | 567.581M | 109.233M | 239.197M | 1.24B | -508.327M | 106.374M | -193.451M | -953.572M | -1.871B | 61.543M | 647.609M | 778.964M | 970.265M | 1.222B |
| Figure | FY 2025 | FY 2024 | FY 2023 | FY 2022 | FY 2021 | FY 2020 | FY 2019 | FY 2018 | FY 2017 | FY 2016 | FY 2015 | FY 2014 | FY 2013 | FY 2012 | FY 2011 | FY 2010 |
|---|---|---|---|---|---|---|---|---|---|---|---|---|---|---|---|---|
| Share price | 15.05 | 25.45 | 19.95 | 14.85 | 19 | 28.7 | — | — | — | — | — | — | — | — | — | — |
| Price performance 12m | -0.41 | 0.28 | 0.34 | -0.22 | -0.34 | — | — | — | — | — | — | — | — | — | — | — |
Sign up to see institutional holdings
Sign UpPodcast Mentions
Sign up to see podcast mentions and sentiment
Sign UpMaterial information published on MOPS, newest first, subjects as filed in Chinese, guarantee and loan balance notices and routine equipment purchases included. The link opens the company's material information on MOPS. Press releases from the company's own website, newest first.
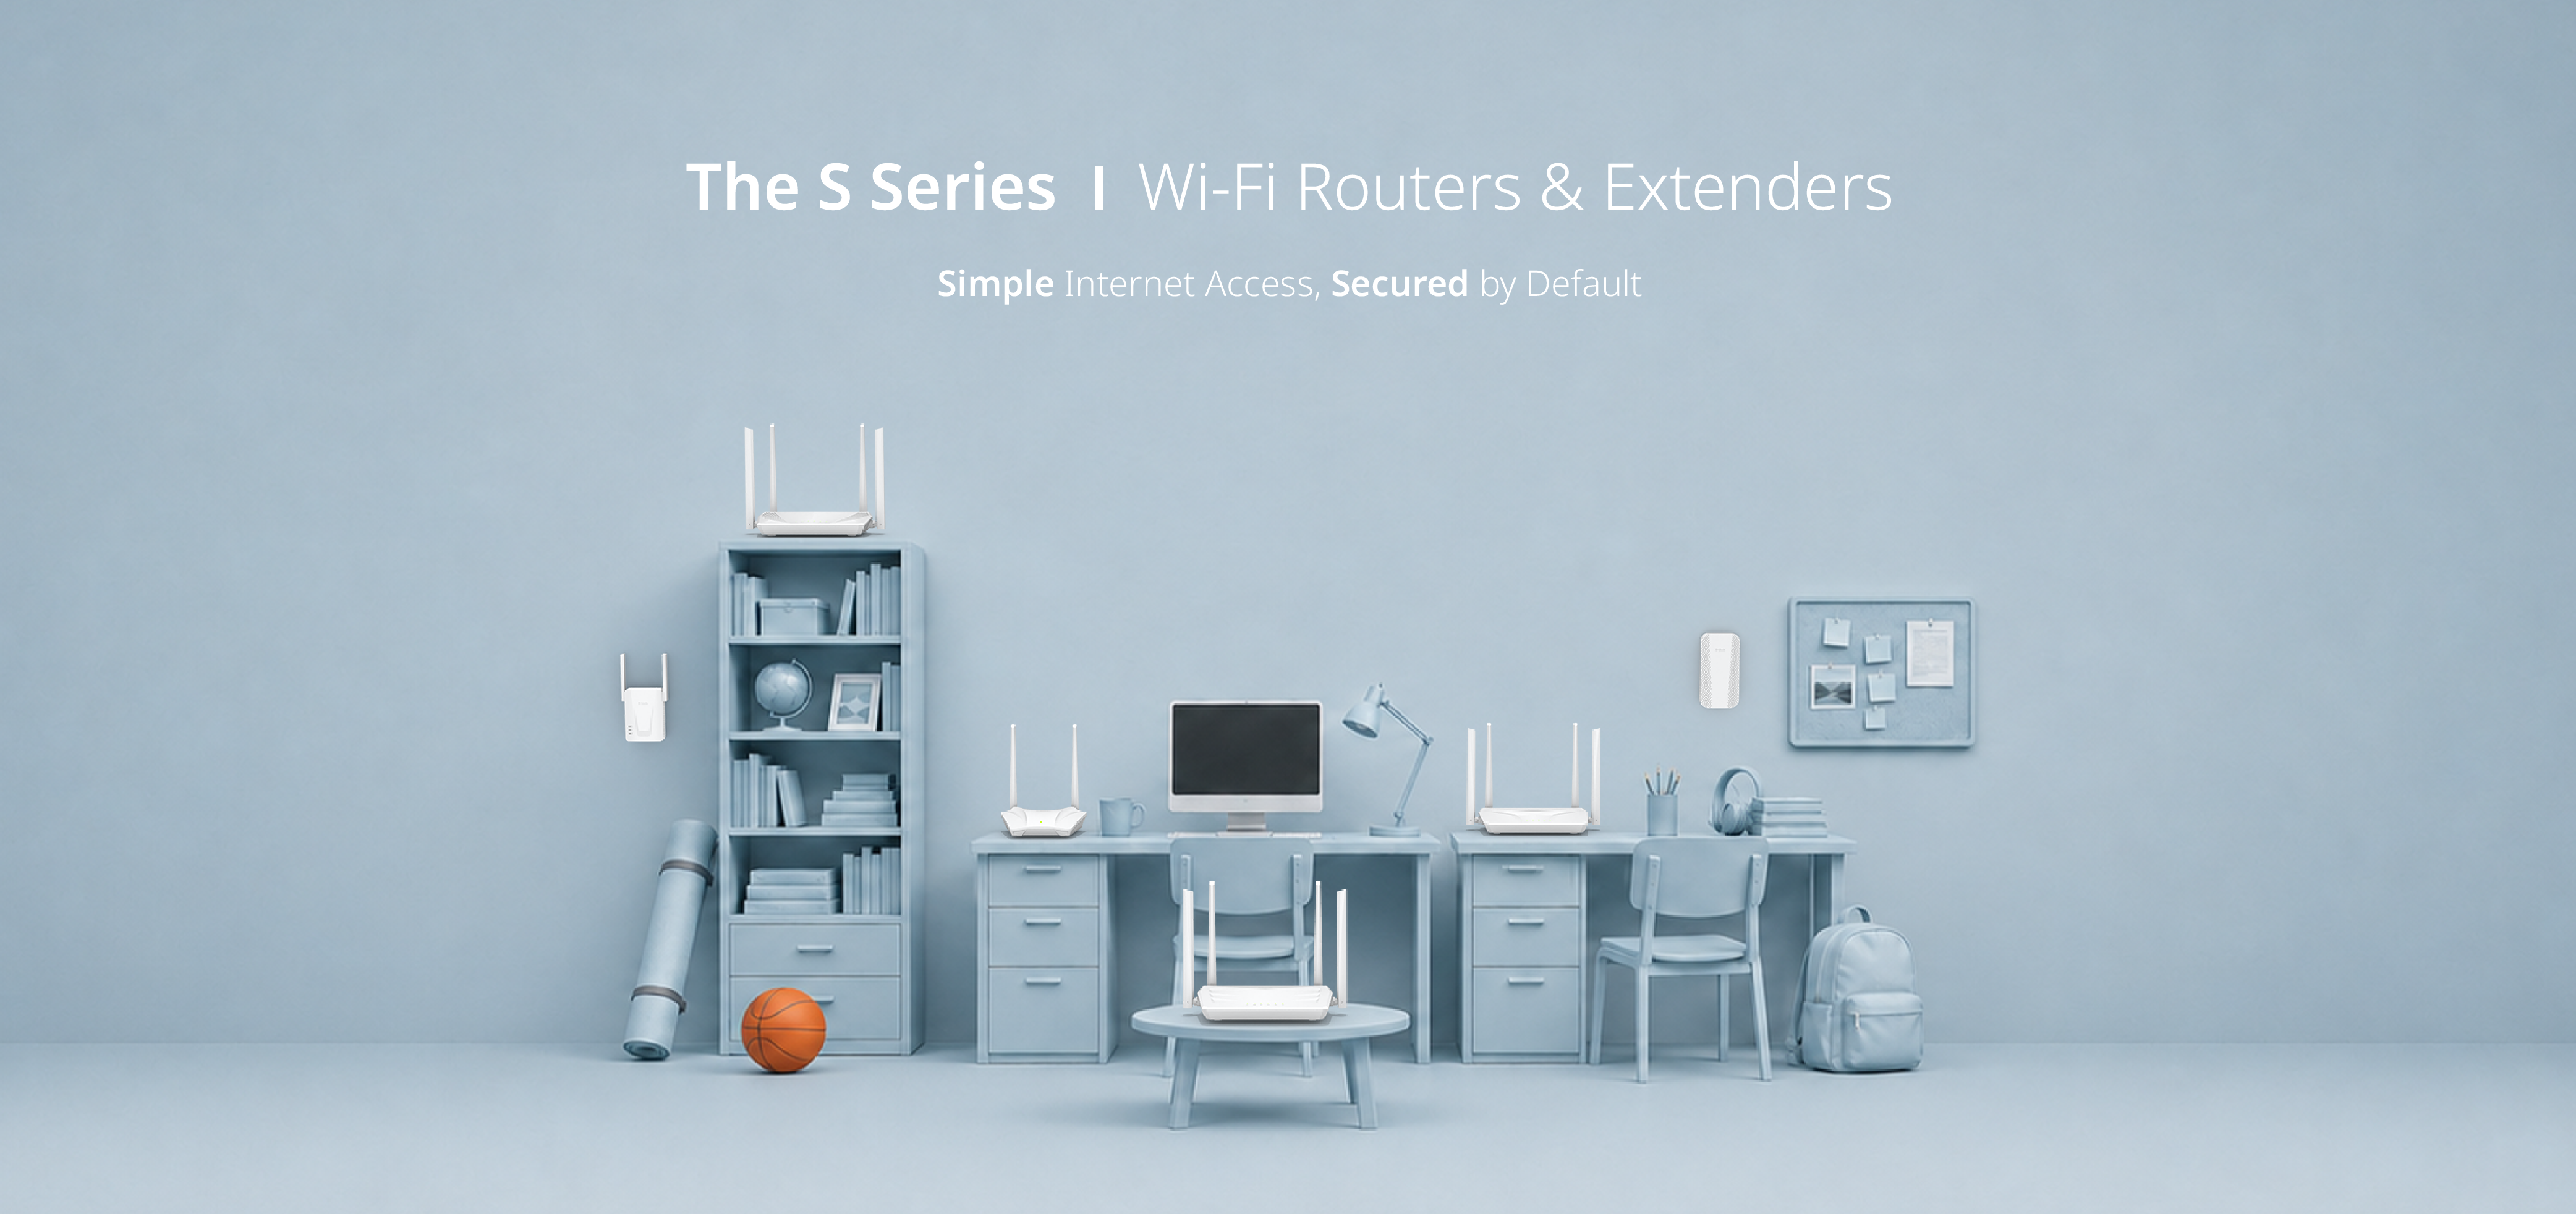 (Image: D-Link S Series - Simple Internet Access, Secured by Default)
 (Image: D-Link S15 - Everyday Wi-Fi Made Simple)
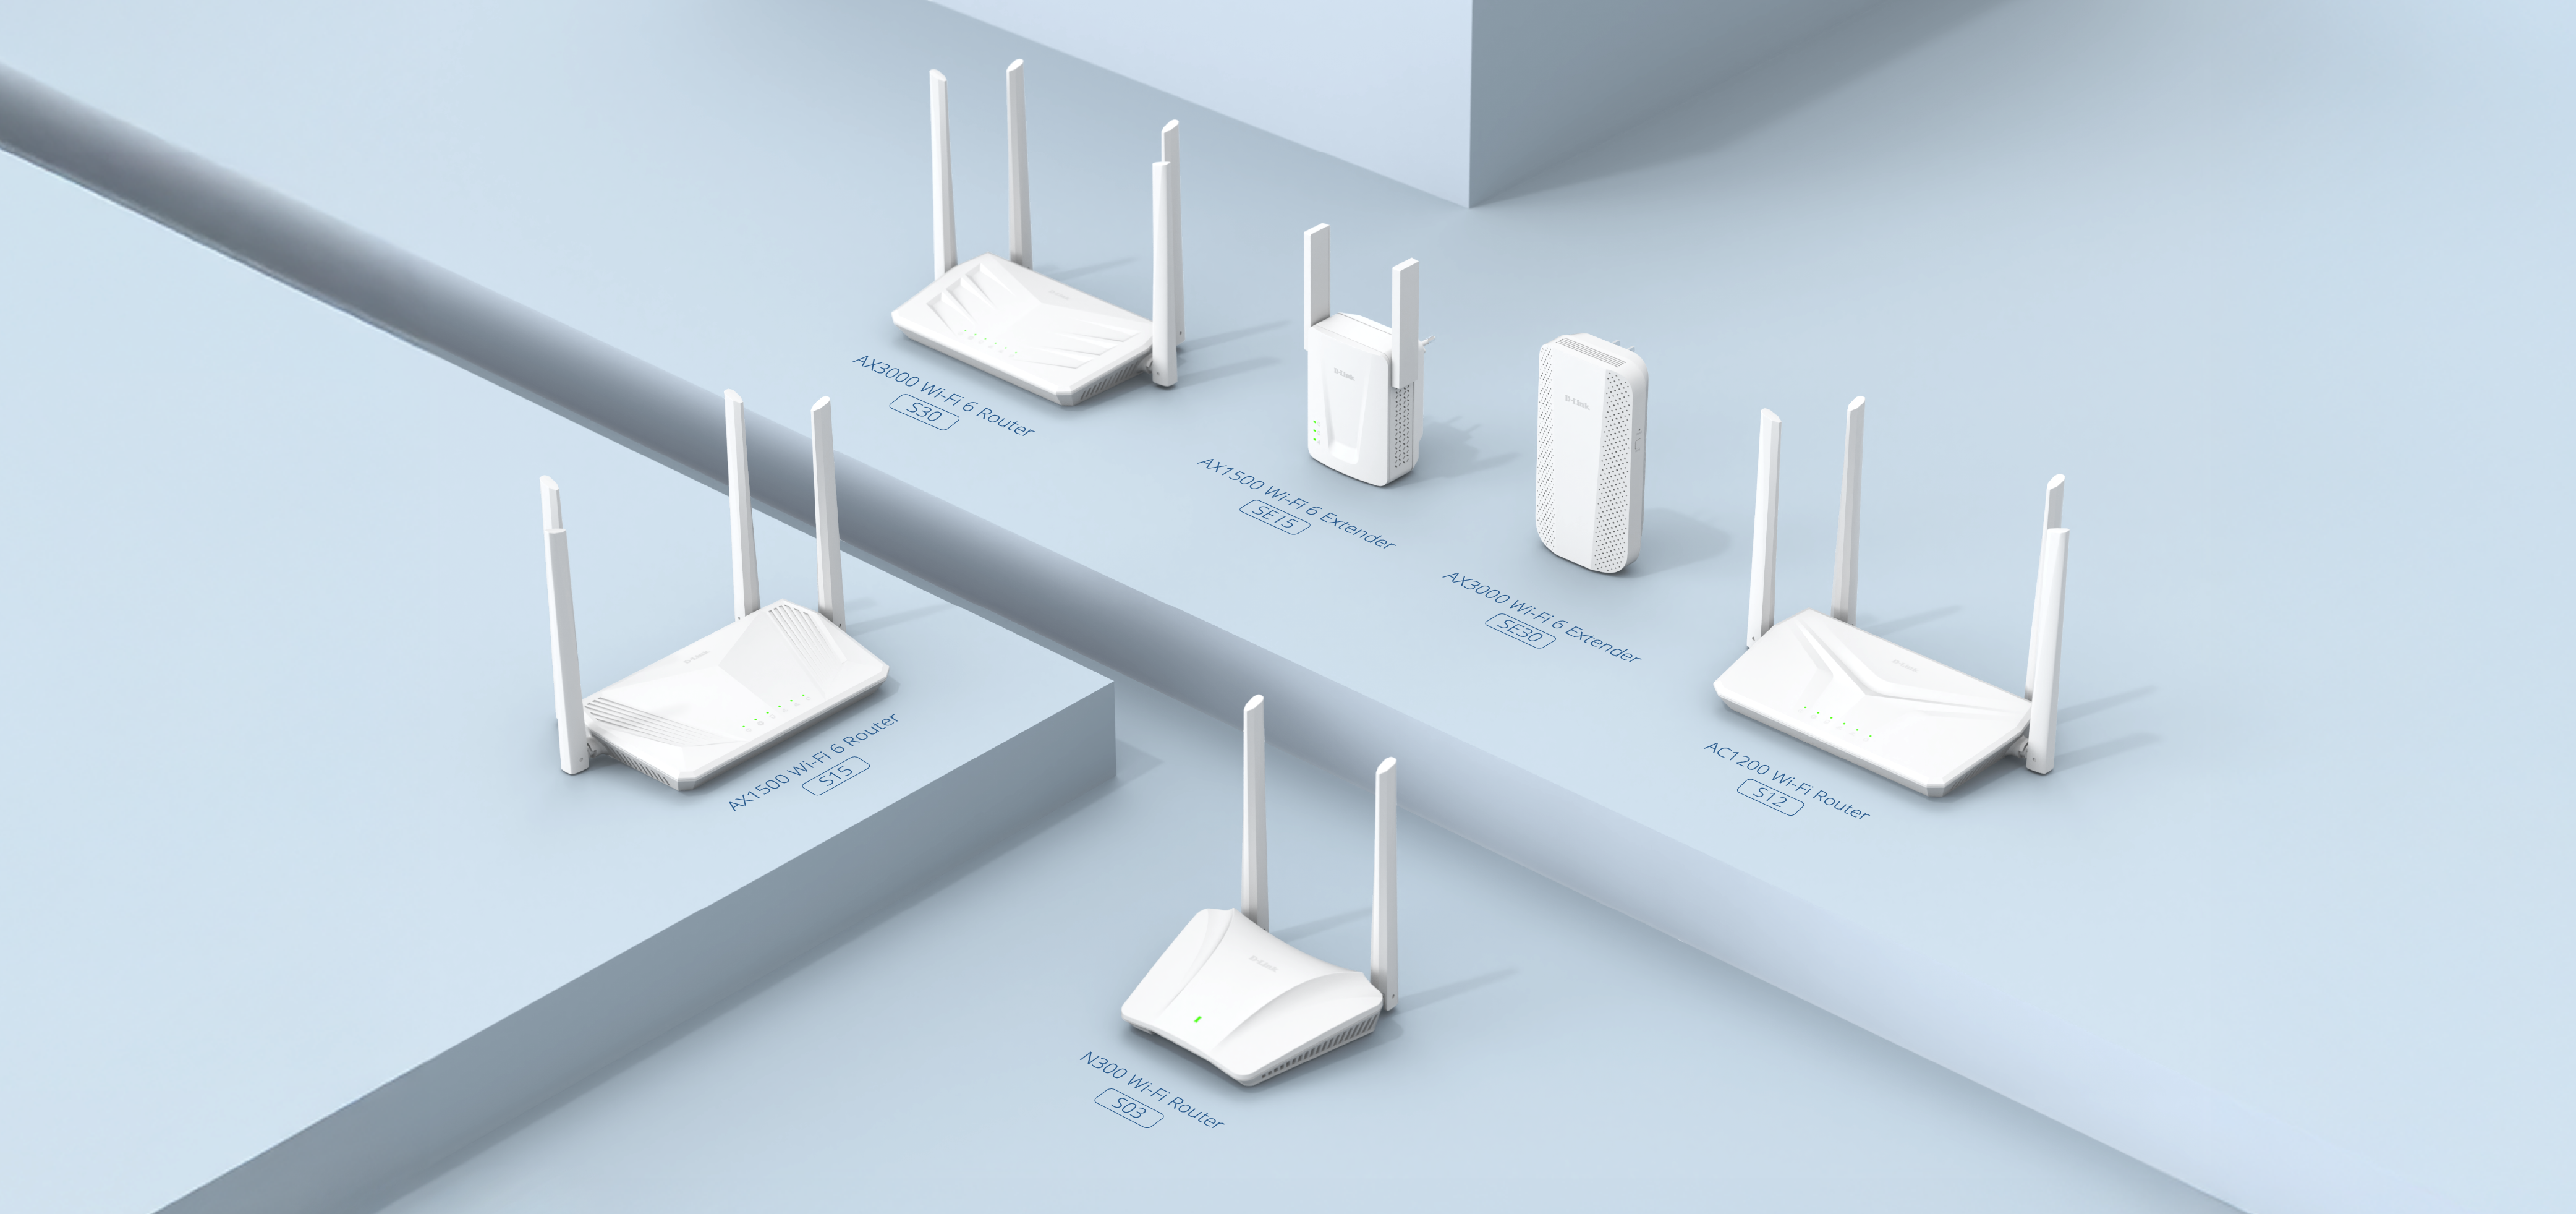 (Image: D-Link S Series – Wi-Fi Routers and Extenders)
 (Image: D-Link SE15 - Expand Wi-Fi Coverage to Every Corner of Your Home)


 (Image: D-Link DCS-8610 Uses AI to Detect Falls and Alert Families in Real Time)
 (Image: D-Link DCS-8610 Hybrid Privacy Mode Protects Privacy While Keeping Seniors Visible )
 (Image: Smart Home Care for Seniors, Families & Caregivers Powered by D-Link AI)


Prompts
Click prompts to add them under the company line, click again to take one out, then copy the result into your AI chat. Shared by Asian Century Stocks and Uncovered Thai Stocks. Thank you.
D-Link Corporation (ticker 2332.TW), listed in Taiwan.
Copied
ETFs Holding D-Link Corporation
Exchange-traded funds whose newest published daily portfolio holds one of the company's listings, largest weight first.
| ETF | Weight in ETF | Shares | Market value | As of |
|---|---|---|---|---|
| DEXC | 0.01% | 53,000 | $ 26.766K | Nov 12, 2026 |
| DFSE | 0.01% | 116,000 | $ 58.581K | Nov 12, 2026 |
| AVEE | 0.01% | 34,000 | $ 16.686K | Nov 16, 2026 |
| DFEM | 0.01% | 1,275,000 | $ 643.891K | Nov 12, 2026 |
| DFAE | 0.00% | 539,080 | $ 272.242K | Nov 12, 2026 |
| DFAX | 0.00% | 455,897 | $ 230.234K | Nov 12, 2026 |
| AVEM | 0.00% | 1,473,600 | $ 723.174K | Nov 16, 2026 |
| AVSE | 0.00% | 3,000 | $ 1,472.26 | Nov 16, 2026 |
| AVXC | 0.00% | 17,000 | $ 8,342.80 | Nov 16, 2026 |