代子公司和泰興業(股)公司公告向關係人取得不動產使用權資產
Bull 0
Bear 0
Routine
2207.TW
|
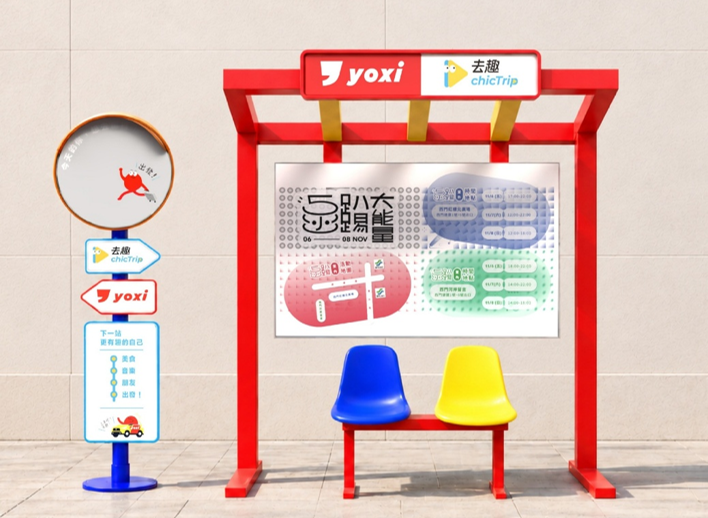
Hotai Motor Co., Ltd. is an automotive distributor and mobility service provider founded in 1947. The company serves as the first overseas agent for Toyota Motor Corporation and the general distributor in Taiwan for TOYOTA, Lexus, and HINO vehicles. It also acts as the general agent for YOKOHAMA tires in the region. Beyond vehicle sales, Hotai Motor offers comprehensive after-sales services, parts distribution, and logistics support to build a one-stop value chain for customers. The company has expanded into Mobility as a Service (MaaS) through digital platforms such as iRent and yoxi, facilitating car-sharing and ride-hailing services. Its operations include a dense network of dealerships and service centers across Taiwan, supporting both passenger and commercial vehicle segments. Hotai Motor also engages in hybrid vehicle promotion and local manufacturing initiatives to address energy efficiency demands. Summarised from the company's own disclosures, fiscal year ended Oct 2026 |
Industry Auto & Truck Dealerships | Homepage hotaimotor.com.tw |
| Sector Consumer Cyclical | IR page hotaimotor.com.tw | |
|
Tags
automotive distribution, after-sales service, mobility as a service, car sharing, tire distribution, commercial vehicles, luxury vehicles, hybrid vehicles, parts logistics, TOYOTA, Lexus, HINO, YOKOHAMA, iRent, yoxi
|
Press page hotaimotor.com.tw/News |
Metrics
| Valuation | |
|---|---|
| Market cap | NT$ 304.175B |
| Market cap (USD) | $ 9.232B |
| P/E | 13.34 |
| PEG | — |
| P/BV | 3.28 |
| P/S | 0.96 |
| P/OCF | 12.43 |
| P/FCF | — |
| Dividend yield | — |
| Turnover / mcap | — |
| Returns | |
|---|---|
| ROE | 23.0% |
| ROI | 21.9% |
| ROIC | 21.9% |
| Profit margin | 6.7% |
| Growth | |
|---|---|
| Revenue growing | No |
| Profits growing | No |
| Revenue up 3y | No |
| Revenue up 5y | No |
| Earnings growth 3y (net profit CAGR) | — |
| Quality | |
|---|---|
| Profitable | Yes |
| Margin expanding | Yes |
| Buying back stock | No |
| Diluting (TTM) | No |
| Debt/Equity | — |
| Podcast bulls (TTM) | Sign up |
| Podcast bears (TTM) | Sign up |
| Podcast sentiment (TTM) | Sign up |
| Podcast sentiment % (TTM) | Sign up |
| News sentiment (TTM) | 5 |
| Quality score | 6.3% |
| Insiders | |
|---|---|
| Buys, 1w | Sign up |
| Buys, 1m | Sign up |
| Buys, 1y | Sign up |
| Sells, 1w | Sign up |
| Sells, 1m | Sign up |
| Sells, 1y | Sign up |
Sign up to see this company's insider trades
| Figure | FY 2025 | FY 2024 | FY 2023 | FY 2022 | FY 2021 | FY 2020 | FY 2019 | FY 2018 | FY 2017 | FY 2016 | FY 2015 | FY 2014 | FY 2013 | FY 2012 | FY 2011 | FY 2010 |
|---|---|---|---|---|---|---|---|---|---|---|---|---|---|---|---|---|
| Revenue | 282.609B | 282.802B | 279.477B | 246.482B | 246.917B | 231.813B | 213.745B | 187.028B | 181.254B | 172.532B | 160.608B | 160.214B | 146.467B | 135.244B | 127.166B | 110.884B |
| Net profit | 18.9B | 20.467B | 22.858B | -19.33B | 16.211B | 13.849B | 11.769B | 10.026B | 10.116B | 10.74B | 9.777B | 9.197B | 7.65B | 7.516B | 6.586B | 4.854B |
| Figure | FY 2025 | FY 2024 | FY 2023 | FY 2022 | FY 2021 | FY 2020 | FY 2019 | FY 2018 | FY 2017 | FY 2016 | FY 2015 | FY 2014 | FY 2013 | FY 2012 | FY 2011 | FY 2010 |
|---|---|---|---|---|---|---|---|---|---|---|---|---|---|---|---|---|
| Share price | 550 | 619 | 709 | 588 | 614 | 643 | — | — | — | — | — | — | — | — | — | — |
| Price performance 12m | -0.11 | -0.13 | 0.21 | -0.04 | -0.05 | — | — | — | — | — | — | — | — | — | — | — |
Sign up to see institutional holdings
Sign UpPodcast Mentions
Sign up to see podcast mentions and sentiment
Sign UpMaterial information published on MOPS, newest first, subjects as filed in Chinese, guarantee and loan balance notices and routine equipment purchases included. The link opens the company's material information on MOPS. Press releases from the company's own website, newest first.
公告本公司將受邀參加台新證券所舉辦之法人說明會
Bull 0
Bear 0
Routine
代子公司和泰服務行銷(股)公司公告說明線上商店平台 委外服務廠商資安事件
Bull 0
Bear 1
Legal


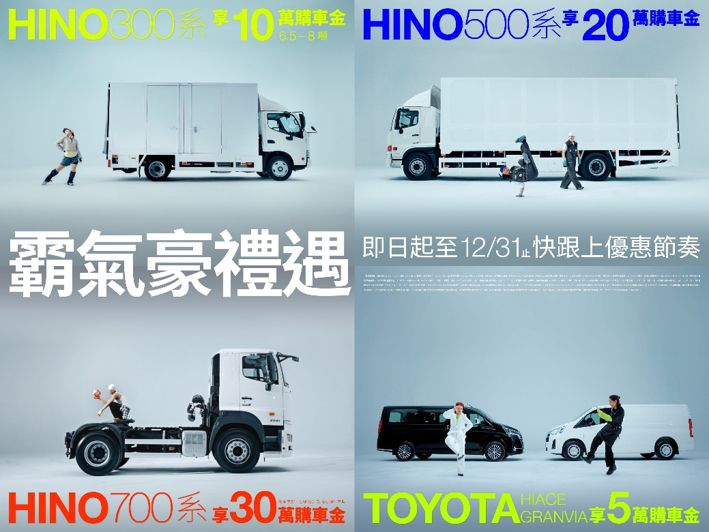
 新聞中心

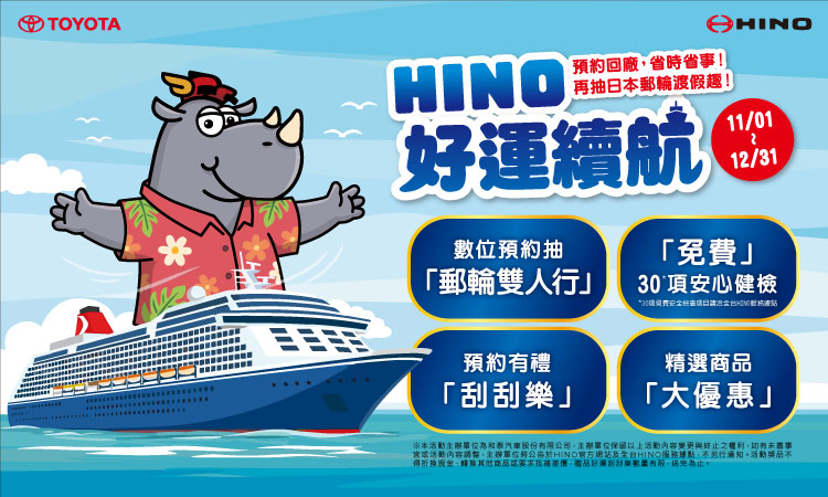



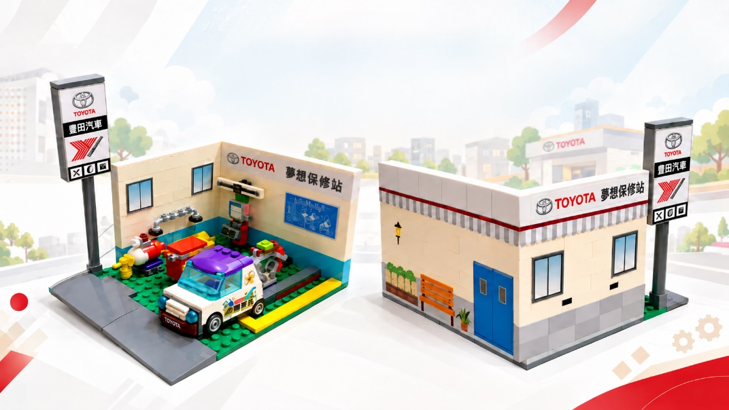


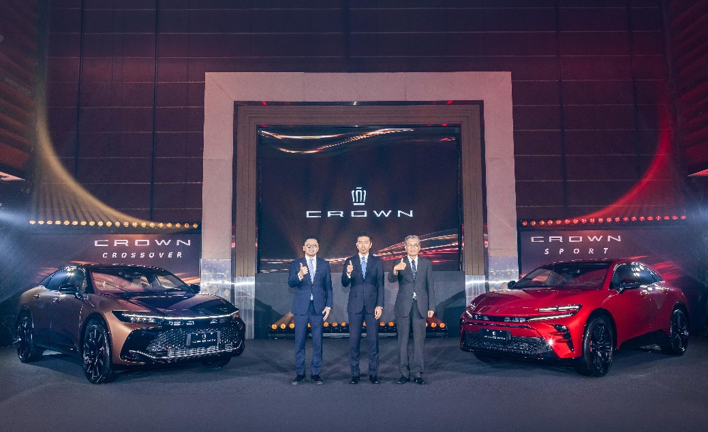



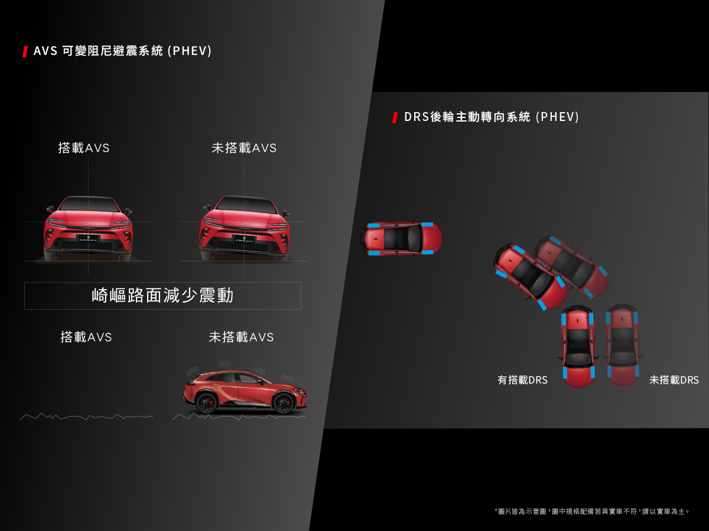
















































Prompts
Click prompts to add them under the company line, click again to take one out, then copy the result into your AI chat. Shared by Asian Century Stocks and Uncovered Thai Stocks. Thank you.
Hotai Motor Co., Ltd. (ticker 2207.TW), listed in Taiwan.
Copied
ETFs Holding Hotai Motor Co., Ltd.
Exchange-traded funds whose newest published daily portfolio holds one of the company's listings, largest weight first.
| ETF | Weight in ETF | Shares | Market value | As of |
|---|---|---|---|---|
| DFSE | 0.09% | 32,060 | $ 506.628K | Nov 12, 2026 |
| DFEV | 0.08% | 114,000 | $ 1.801M | Nov 12, 2026 |
| AVES | 0.06% | 58,000 | $ 925.946K | Nov 16, 2026 |
| NTSE | 0.05% | 2,060 | $ 30.102K | Jun 30, 2026 |
| DEXC | 0.05% | 8,000 | $ 126.42K | Nov 12, 2026 |
| DFEM | 0.03% | 176,410 | $ 2.788M | Nov 12, 2026 |
| AVSE | 0.02% | 2,020 | $ 32.248K | Nov 16, 2026 |
| AVXC | 0.02% | 5,000 | $ 79.823K | Nov 16, 2026 |
| DFAE | 0.02% | 91,240 | $ 1.442M | Nov 12, 2026 |
| DFAX | 0.01% | 78,800 | $ 1.245M | Nov 12, 2026 |
| AVEM | 0.01% | 152,760 | $ 2.439M | Nov 16, 2026 |
| DEHP | 0.01% | 2,000 | $ 31.605K | Nov 12, 2026 |