本公司受邀參加康和證券主辦之線上法說會
Bull 0
Bear 0
Routine
2206.TW
|
Sanyang Motor Co., Ltd. is a manufacturer of motorcycles and automobiles, established in 1954. The company operates two main business segments: the motorcycle business, which develops and produces vehicles under the SYM brand, and the automobile business, which manufactures vehicles and components as a partner to HYUNDAI. Sanyang Motor utilizes a global production model involving manufacturing bases in multiple regions to support international sales. The company produces powertrain components, including engines, crankshafts, camshafts, cylinders, gears, and drive shafts, alongside complete vehicle assembly. Its automotive operations focus on strengthening the product lineup and distribution channels for HYUNDAI models, such as the IONIQ 5 and STARIA. The firm serves markets in Taiwan, Southeast Asia, and other international regions, maintaining a presence through local production and sales networks. Summarised from the company's own disclosures, fiscal year ended Oct 2026 |
Industry Auto Manufacturers | Homepage sanyang.com.tw |
| Sector Consumer Cyclical | IR page sanyang.com.tw/investor | |
|
Tags
motorcycles, automobiles, powertrain components, engine manufacturing, vehicle assembly, automotive parts, electric vehicles, suvs, minivans, SYM, HYUNDAI, IONIQ 5, STARIA
|
Press page — |
Metrics
| Valuation | |
|---|---|
| Market cap | NT$ 46.196B |
| Market cap (USD) | $ 1.402B |
| P/E | 11.05 |
| PEG | 0.83 |
| P/BV | 1.73 |
| P/S | 0.76 |
| P/OCF | 6.96 |
| P/FCF | — |
| Dividend yield | — |
| Turnover / mcap | — |
| Returns | |
|---|---|
| ROE | 17.6% |
| ROI | 17.2% |
| ROIC | 16.5% |
| Profit margin | 7.2% |
| Growth | |
|---|---|
| Revenue growing | No |
| Profits growing | No |
| Revenue up 3y | No |
| Revenue up 5y | No |
| Earnings growth 3y (net profit CAGR) | 13.3% |
| Quality | |
|---|---|
| Profitable | Yes |
| Margin expanding | No |
| Buying back stock | Yes |
| Diluting (TTM) | No |
| Debt/Equity | — |
| Podcast bulls (TTM) | Sign up |
| Podcast bears (TTM) | Sign up |
| Podcast sentiment (TTM) | Sign up |
| Podcast sentiment % (TTM) | Sign up |
| News sentiment (TTM) | 0 |
| Quality score | 18.8% |
| Insiders | |
|---|---|
| Buys, 1w | Sign up |
| Buys, 1m | Sign up |
| Buys, 1y | Sign up |
| Sells, 1w | Sign up |
| Sells, 1m | Sign up |
| Sells, 1y | Sign up |
Sign up to see this company's insider trades
| Figure | FY 2025 | FY 2024 | FY 2023 | FY 2022 | FY 2021 | FY 2020 | FY 2019 | FY 2018 | FY 2017 | FY 2016 | FY 2015 | FY 2014 | FY 2013 | FY 2012 | FY 2011 | FY 2010 |
|---|---|---|---|---|---|---|---|---|---|---|---|---|---|---|---|---|
| Revenue | 62.632B | 65.625B | 64.461B | 50.851B | 41.617B | 40.775B | 33.383B | 31.351B | 31.679B | 35.451B | 32.884B | 36.457B | 32.626B | 34.409B | 36.826B | 31.841B |
| Net profit | 4.533B | 4.77B | 6.298B | 3.116B | 1.83B | 1.938B | 2.226B | 1.038B | 509.136M | -321.861M | 3.093B | -278.539M | -474.054M | 356.725M | 1.238B | 692.45M |
| Figure | FY 2025 | FY 2024 | FY 2023 | FY 2022 | FY 2021 | FY 2020 | FY 2019 | FY 2018 | FY 2017 | FY 2016 | FY 2015 | FY 2014 | FY 2013 | FY 2012 | FY 2011 | FY 2010 |
|---|---|---|---|---|---|---|---|---|---|---|---|---|---|---|---|---|
| Share price | 61.4 | 69.1 | 71.4 | 33.85 | 27.05 | 35.7 | — | — | — | — | — | — | — | — | — | — |
| Price performance 12m | -0.11 | -0.03 | 1.11 | 0.25 | -0.24 | — | — | — | — | — | — | — | — | — | — | — |
Sign up to see institutional holdings
Sign UpPodcast Mentions
Sign up to see podcast mentions and sentiment
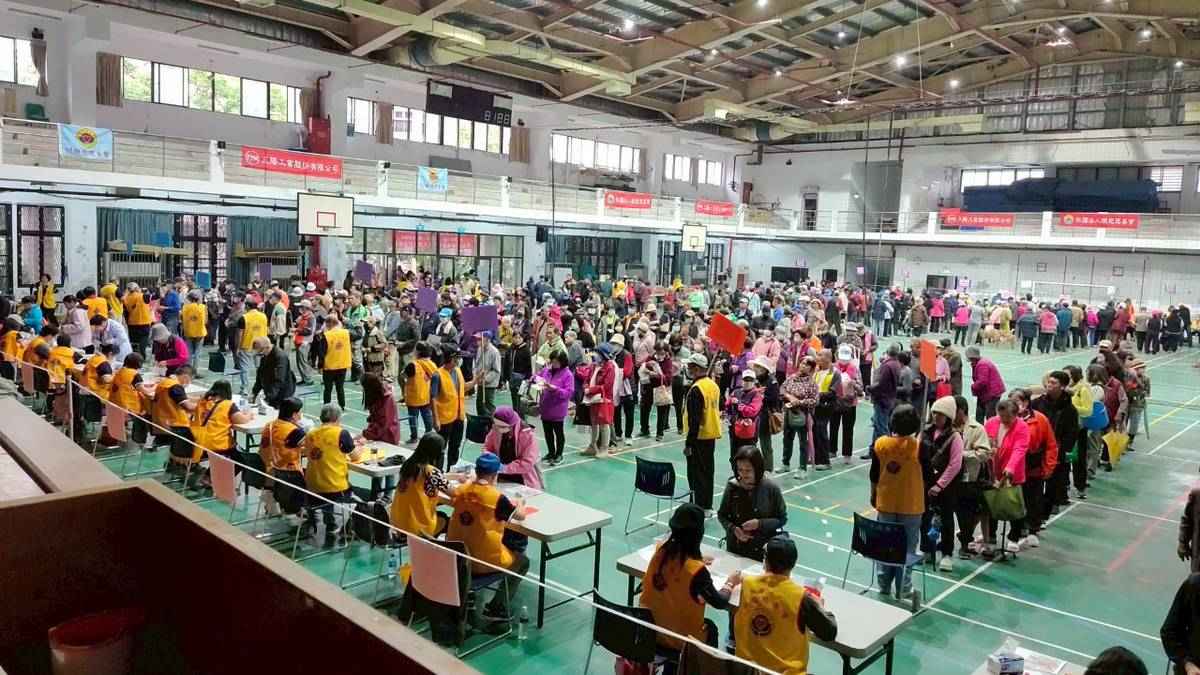
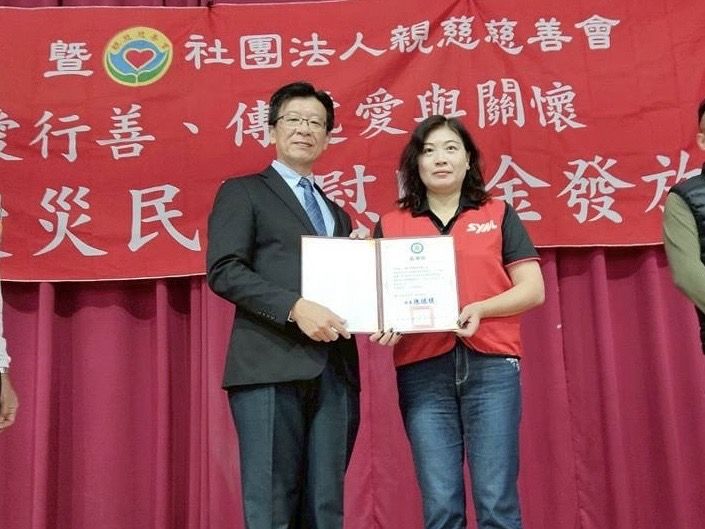
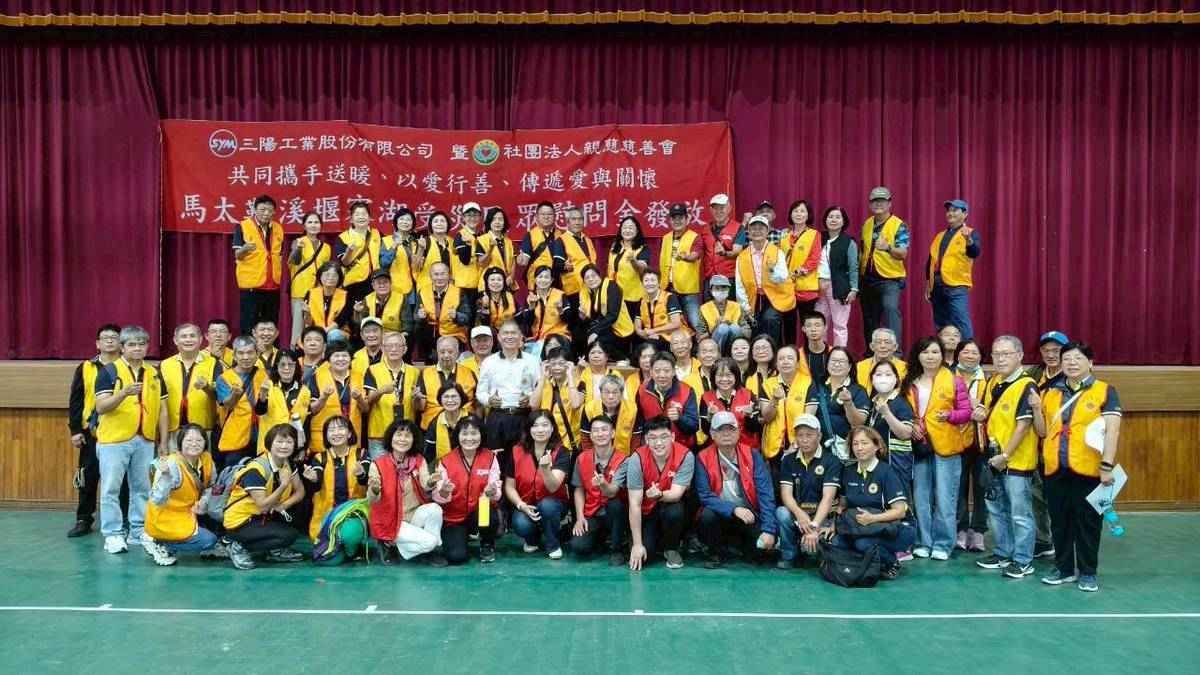
Sign UpMaterial information published on MOPS, newest first, subjects as filed in Chinese, guarantee and loan balance notices and routine equipment purchases included. The link opens the company's material information on MOPS. Press releases from the company's own website, newest first.





Prompts
Click prompts to add them under the company line, click again to take one out, then copy the result into your AI chat. Shared by Asian Century Stocks and Uncovered Thai Stocks. Thank you.
Sanyang Motor Co., Ltd. (ticker 2206.TW), listed in Taiwan.
Copied
ETFs Holding Sanyang Motor Co., Ltd.
Exchange-traded funds whose newest published daily portfolio holds one of the company's listings, largest weight first.
| ETF | Weight in ETF | Shares | Market value | As of |
|---|---|---|---|---|
| AVEE | 0.08% | 54,000 | $ 101.33K | Nov 16, 2026 |
| DFEV | 0.02% | 238,000 | $ 446.121K | Nov 12, 2026 |
| DFSE | 0.02% | 60,000 | $ 112.468K | Nov 12, 2026 |
| DFEM | 0.02% | 729,000 | $ 1.366M | Nov 12, 2026 |
| AVSE | 0.01% | 10,000 | $ 18.765K | Nov 16, 2026 |
| DEXC | 0.01% | 13,000 | $ 24.368K | Nov 12, 2026 |
| DFAE | 0.01% | 399,000 | $ 747.909K | Nov 12, 2026 |
| DFAX | 0.01% | 410,900 | $ 770.216K | Nov 12, 2026 |
| AVEM | 0.00% | 653,000 | $ 1.225M | Nov 16, 2026 |
| AVXC | 0.00% | 3,000 | $ 5,629.46 | Nov 16, 2026 |