公告本公司薪酬委員會委員異動
Bull 0
Bear 0
Routine
2105.TW
|
Cheng Shin Rubber Ind. Co., Ltd. is a tire manufacturer producing passenger car, bicycle, motorcycle, and truck tires. The company operates under the brands Cheng Shin, CST, MAXXIS, and PRESA. Its product portfolio includes high-performance passenger car tires such as the HP5 and MAP1 models, as well as tires for commercial vehicles and two-wheelers. The company supplies original equipment to a wide range of automotive manufacturers, including Aston Martin, Audi, BMW, Ferrari, Ford, Honda, Mercedes-Benz, Porsche, Tesla, Toyota, and Volkswagen. Cheng Shin markets its products globally and is recognized as one of Taiwan's major tire producers. Summarised from the company's own disclosures, fiscal year ended Oct 2026 |
Industry Auto Parts | Homepage cst.com.tw |
| Sector Consumer Cyclical | IR page cst.com.tw | |
|
Tags
passenger car tires, motorcycle tires, truck tires, bicycle tires, original equipment, replacement tires, Cheng Shin, CST, MAXXIS, PRESA, HP5, MAP1, Premitra HP6
|
Press page — |
Metrics
| Valuation | |
|---|---|
| Market cap | NT$ 92.548B |
| Market cap (USD) | $ 2.809B |
| P/E | 16.99 |
| PEG | — |
| P/BV | 1.04 |
| P/S | 0.97 |
| P/OCF | 5.23 |
| P/FCF | — |
| Dividend yield | — |
| Turnover / mcap | — |
| Returns | |
|---|---|
| ROE | 5.5% |
| ROI | 5.6% |
| ROIC | 5.8% |
| Profit margin | 5.3% |
| Growth | |
|---|---|
| Revenue growing | No |
| Profits growing | No |
| Revenue up 3y | No |
| Revenue up 5y | No |
| Earnings growth 3y (net profit CAGR) | -0.72% |
| Quality | |
|---|---|
| Profitable | Yes |
| Margin expanding | No |
| Buying back stock | No |
| Diluting (TTM) | No |
| Debt/Equity | — |
| Podcast bulls (TTM) | Sign up |
| Podcast bears (TTM) | Sign up |
| Podcast sentiment (TTM) | Sign up |
| Podcast sentiment % (TTM) | Sign up |
| News sentiment (TTM) | 0 |
| Quality score | -6.3% |
| Insiders | |
|---|---|
| Buys, 1w | Sign up |
| Buys, 1m | Sign up |
| Buys, 1y | Sign up |
| Sells, 1w | Sign up |
| Sells, 1m | Sign up |
| Sells, 1y | Sign up |
Sign up to see this company's insider trades
| Figure | FY 2025 | FY 2024 | FY 2023 | FY 2022 | FY 2021 | FY 2020 | FY 2019 | FY 2018 | FY 2017 | FY 2016 | FY 2015 | FY 2014 | FY 2013 | FY 2012 | FY 2011 | FY 2010 |
|---|---|---|---|---|---|---|---|---|---|---|---|---|---|---|---|---|
| Revenue | 90.781B | 96.247B | 96.201B | 98.623B | 101.537B | 96.209B | 109.508B | 109.221B | 112.309B | 117.388B | 116.726B | 129.014B | 133.087B | 130.269B | 119.961B | 99.97B |
| Net profit | 4.854B | 8.017B | 7.182B | 4.961B | 5.27B | 5.989B | 3.467B | 3.52B | 5.542B | 13.251B | 12.777B | 16.016B | 18.549B | 15.894B | 8.536B | 10.315B |
| Figure | FY 2025 | FY 2024 | FY 2023 | FY 2022 | FY 2021 | FY 2020 | FY 2019 | FY 2018 | FY 2017 | FY 2016 | FY 2015 | FY 2014 | FY 2013 | FY 2012 | FY 2011 | FY 2010 |
|---|---|---|---|---|---|---|---|---|---|---|---|---|---|---|---|---|
| Share price | 29.5 | 49.05 | 44.9 | 33.9 | 36.1 | 44.05 | — | — | — | — | — | — | — | — | — | — |
| Price performance 12m | -0.4 | 0.09 | 0.32 | -0.06 | -0.18 | — | — | — | — | — | — | — | — | — | — | — |
Sign up to see institutional holdings
Sign UpPodcast Mentions
Sign up to see podcast mentions and sentiment
Sign UpMaterial information published on MOPS, newest first, subjects as filed in Chinese, guarantee and loan balance notices and routine equipment purchases included. The link opens the company's material information on MOPS. Press releases from the company's own website, newest first.
本公司董事會通過由本公司現金增資Maxxis Rubber India Private Limited案
Bull 1
Bear 0
M&A
公告本公司董事會通過115年第三季合併財務報告
Bull 0
Bear 0
Routine

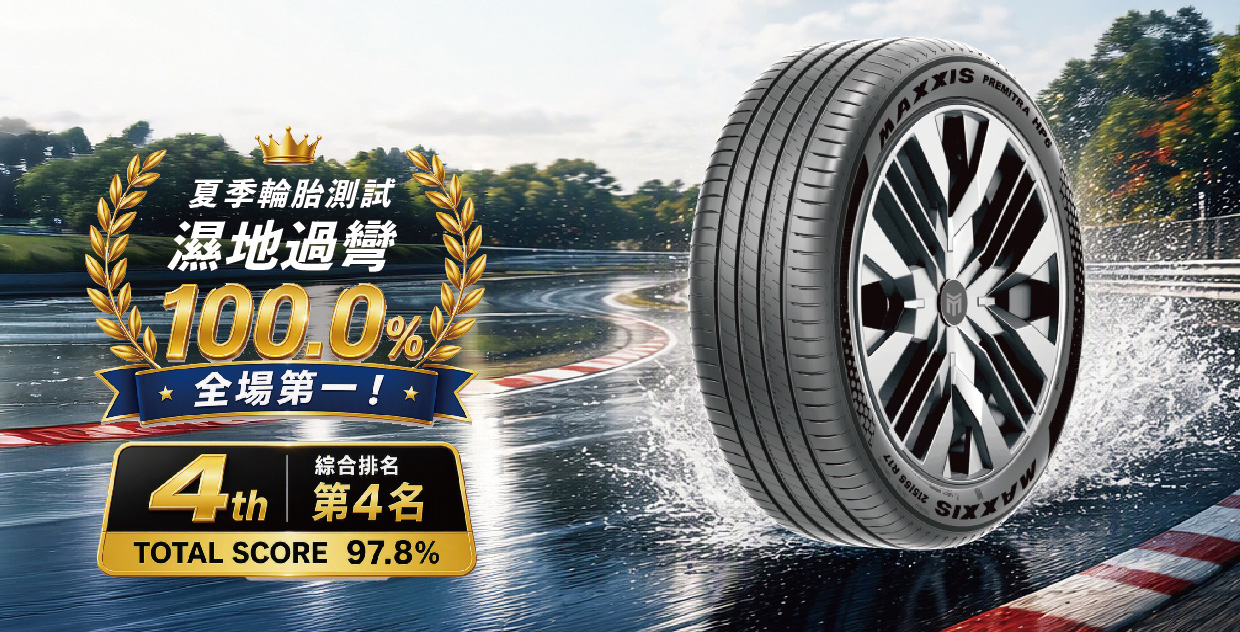
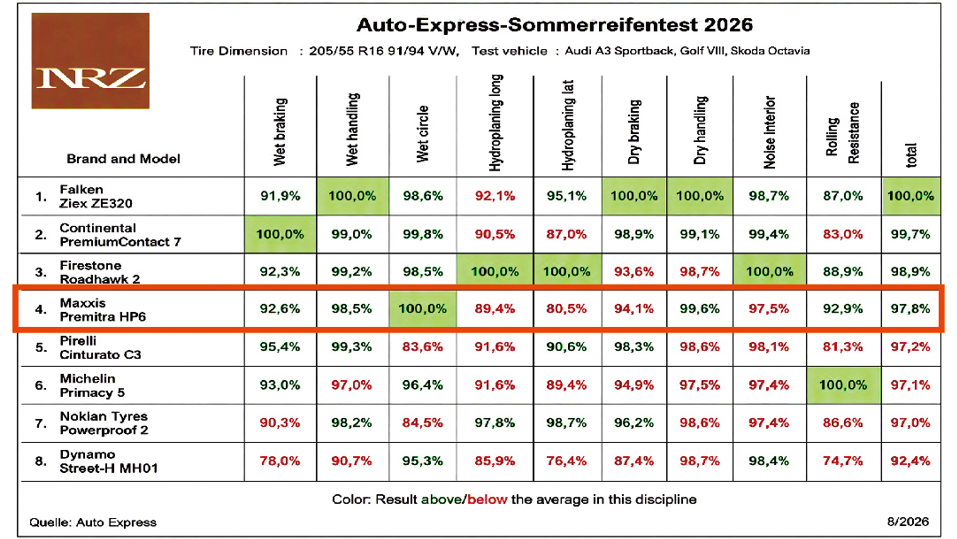


 **VS6 導入新世代環保稻殼白碳黑配方,提升胎面抓地力、降低滾動阻力並改善磨耗壽命, 綠色科技兼顧高效性能。**同時搭載 Kevlar 高強度纖維材料,使胎體更輕量、更堅固, 提升操控穩定度並改善舒適性。

Prompts
Click prompts to add them under the company line, click again to take one out, then copy the result into your AI chat. Shared by Asian Century Stocks and Uncovered Thai Stocks. Thank you.
Cheng Shin Rubber Ind. Co., Ltd. (ticker 2105.TW), listed in Taiwan.
Copied
ETFs Holding Cheng Shin Rubber Ind. Co., Ltd.
Exchange-traded funds whose newest published daily portfolio holds one of the company's listings, largest weight first.
| ETF | Weight in ETF | Shares | Market value | As of |
|---|---|---|---|---|
| AVEE | 0.14% | 209,000 | $ 184.128K | Nov 16, 2026 |
| AVES | 0.08% | 1,366,000 | $ 1.203M | Nov 16, 2026 |
| DFEV | 0.04% | 904,000 | $ 803.385K | Nov 12, 2026 |
| DFEM | 0.02% | 2,204,000 | $ 1.959M | Nov 12, 2026 |
| AVSE | 0.02% | 54,000 | $ 47.574K | Nov 16, 2026 |
| AVXC | 0.02% | 105,000 | $ 92.505K | Nov 16, 2026 |
| DEXC | 0.01% | 42,000 | $ 37.325K | Nov 12, 2026 |
| DFAE | 0.01% | 1,426,000 | $ 1.267M | Nov 12, 2026 |
| AVEM | 0.01% | 3,511,000 | $ 3.093M | Nov 16, 2026 |
| NTSE | 0.01% | 6,000 | $ 5,640.92 | Jun 30, 2026 |
| DFAX | 0.01% | 1,148,341 | $ 1.021M | Nov 12, 2026 |