代子公司台橡(南通)實業有限公司公告解除 董事競業禁止之限制
Bull 0
Bear 0
Routine
2103.TW
|
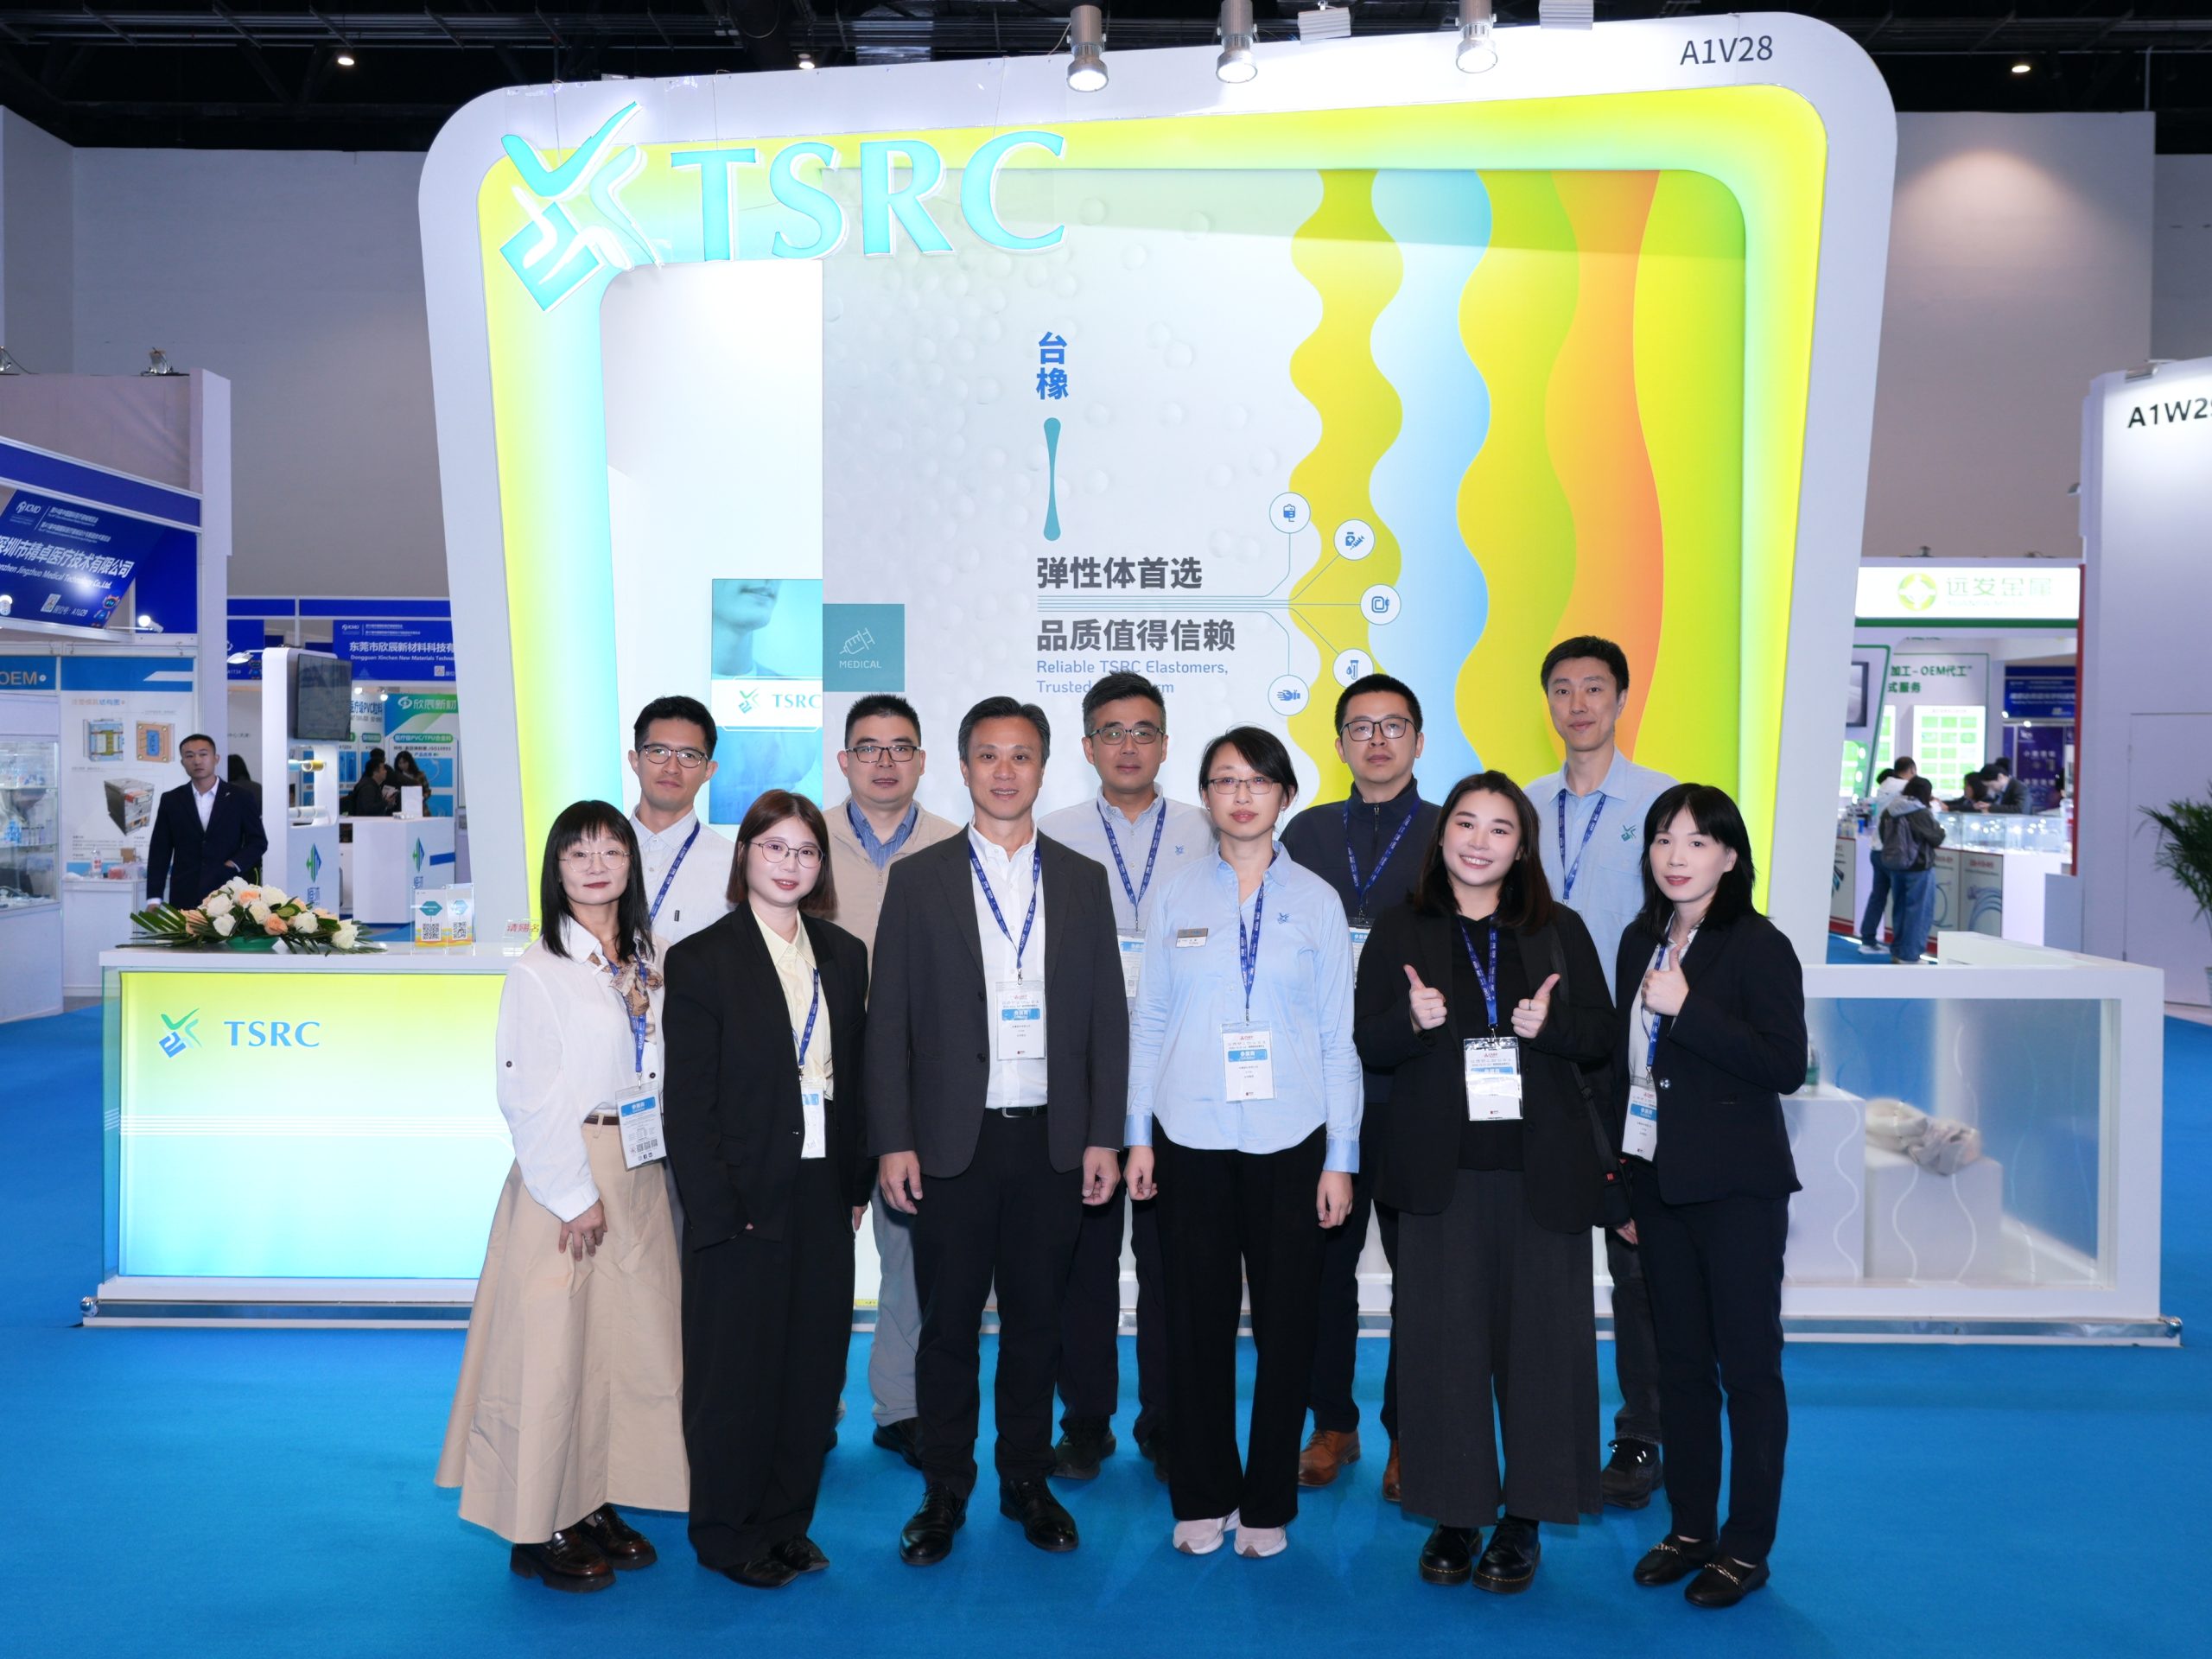
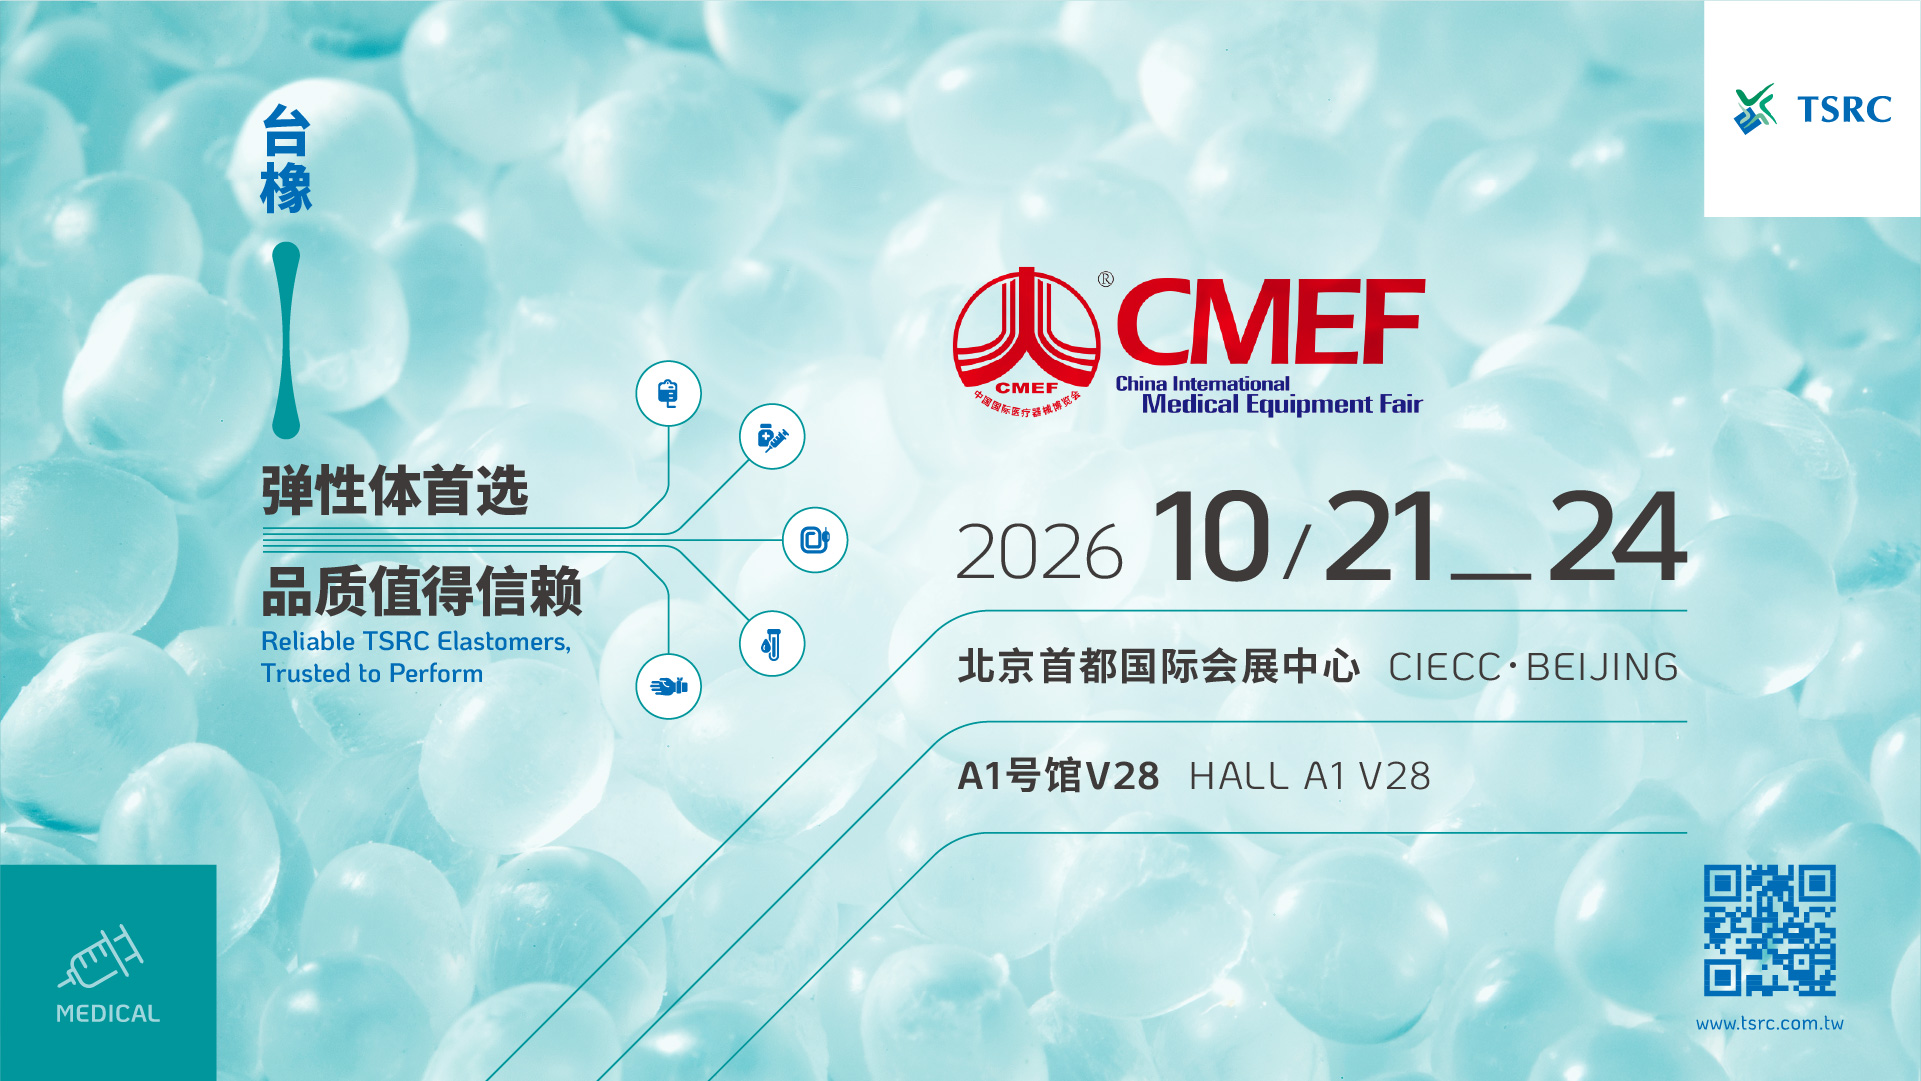
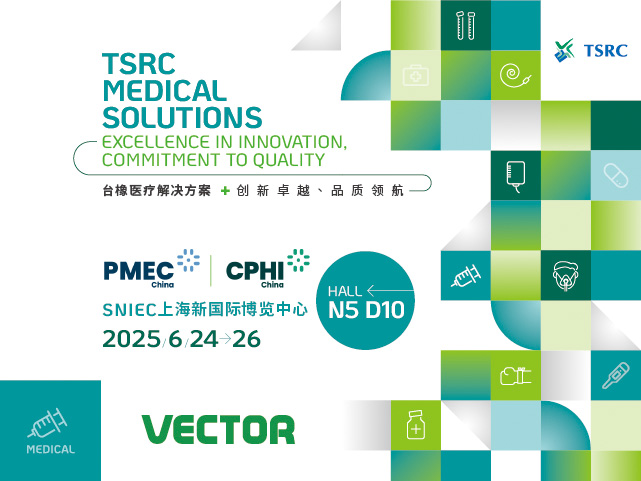
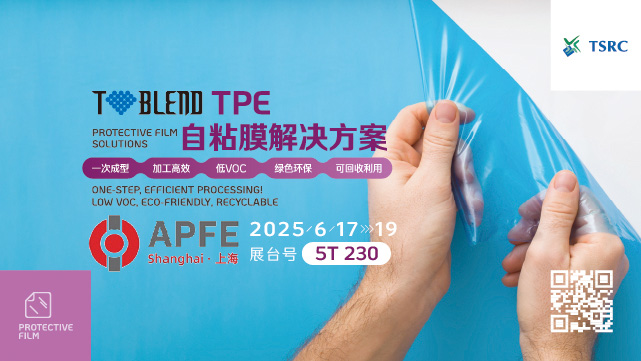
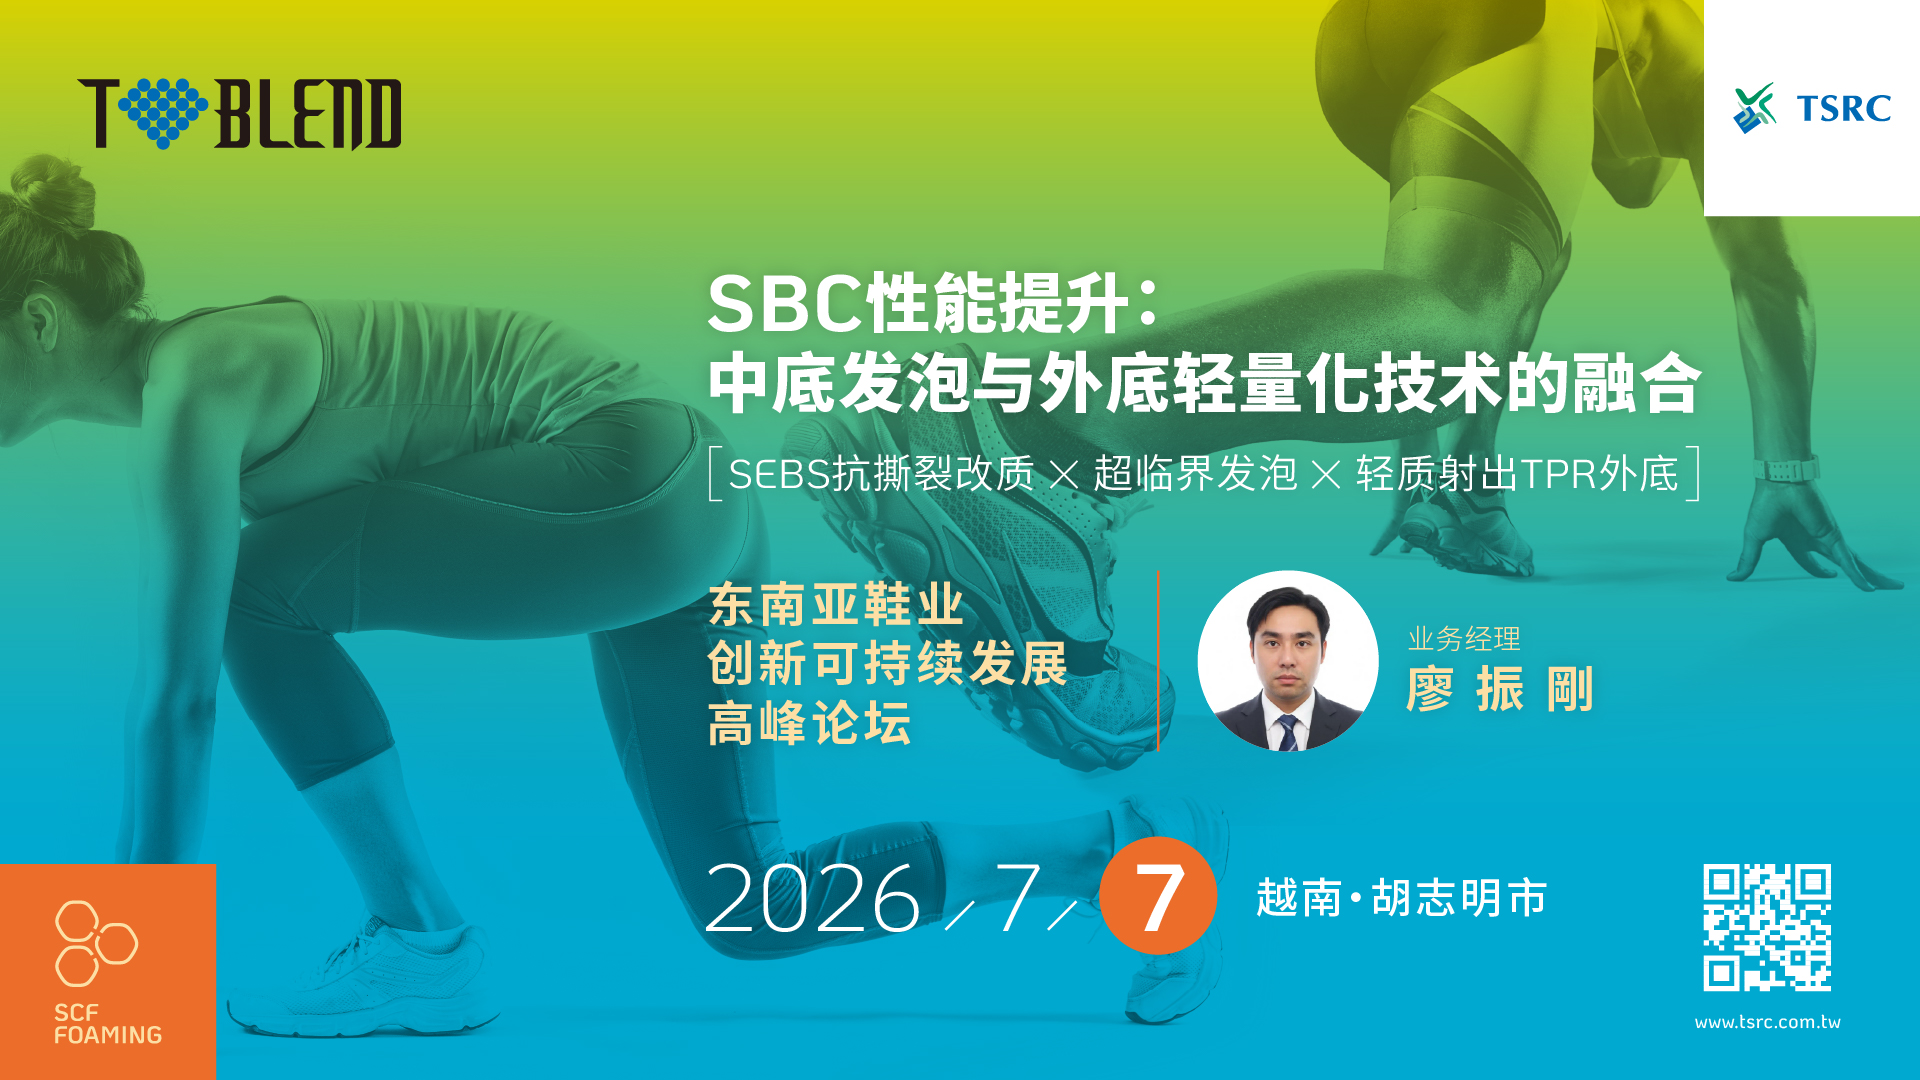
TSRC Corporation is a manufacturer of synthetic rubber and specialty materials. The company produces Styrene Block Copolymers (SBC), including SIS, SBS, and SEBS, as well as synthetic rubbers such as SBR, BR, and NBR. Key product brands include TAIPOL, VECTOR, and T-BLEND, with VECTOR SEBS specifically designed for medical applications such as IV bags, tubing, and stoppers as an alternative to PVC. TSRC serves global markets with production bases in Taiwan, China, Thailand, India, Vietnam, and the United States. The company operates through subsidiaries including TSRC (Nantong) Industries Ltd., TSRC-UBE Chemical Industrial Ltd., and TSRC Specialty Materials LLC. Notable partnerships include joint ventures with UBE Industrial Ltd., Marubeni Corporation, Indian Oil Corporation Ltd., and LANXESS for the development of BR, SBR, and NBR plants. Founded in 1973, the company was formerly known as Taiwan Synthetic Rubber Corp. and acquired Dexco Polymers in 2011 to expand its specialty materials portfolio. Summarised from the company's own disclosures, fiscal year ended Oct 2026 |
Industry Specialty Chemicals | Homepage tsrc.com.tw |
| Sector Basic Materials | IR page tsrc.com.tw/investor-relations | |
|
Tags
synthetic rubber, styrenic block copolymers, medical materials, tire compounds, thermoplastic elastomers, polymer manufacturing, specialty polymers, TAIPOL, VECTOR, T-BLEND, TSRC (Nantong) Industries Ltd., TSRC-UBE Chemical Industrial Ltd., TSRC Specialty Materials LLC, Shen Hua Chemical Industrial Co. Ltd., Dexco Polymers, Lanxess-TSRC (Nantong) Chemical Industrial Co. Ltd., Indian Synthetic Rubber Private Ltd., Thai Synthetic Rubbers Co. Ltd., TSRC (Vietnam) Co. Ltd.
|
Press page tsrc.com.tw/news |
Metrics
| Valuation | |
|---|---|
| Market cap | NT$ 17.302B |
| Market cap (USD) | $ 525.14M |
| P/E | 7.38 |
| PEG | — |
| P/BV | 0.78 |
| P/S | 0.42 |
| P/OCF | 23.12 |
| P/FCF | — |
| Dividend yield | — |
| Turnover / mcap | — |
| Returns | |
|---|---|
| ROE | 2.2% |
| ROI | 2.2% |
| ROIC | 2.7% |
| Profit margin | 1.2% |
| Growth | |
|---|---|
| Revenue growing | No |
| Profits growing | No |
| Revenue up 3y | No |
| Revenue up 5y | No |
| Earnings growth 3y (net profit CAGR) | -36.9% |
| Quality | |
|---|---|
| Profitable | Yes |
| Margin expanding | No |
| Buying back stock | No |
| Diluting (TTM) | No |
| Debt/Equity | — |
| Podcast bulls (TTM) | Sign up |
| Podcast bears (TTM) | Sign up |
| Podcast sentiment (TTM) | Sign up |
| Podcast sentiment % (TTM) | Sign up |
| News sentiment (TTM) | 10 |
| Quality score | -25.0% |
| Insiders | |
|---|---|
| Buys, 1w | Sign up |
| Buys, 1m | Sign up |
| Buys, 1y | Sign up |
| Sells, 1w | Sign up |
| Sells, 1m | Sign up |
| Sells, 1y | Sign up |
Sign up to see this company's insider trades
| Figure | FY 2025 | FY 2024 | FY 2023 | FY 2022 | FY 2021 | FY 2020 | FY 2019 | FY 2018 | FY 2017 | FY 2016 | FY 2015 | FY 2014 | FY 2013 | FY 2012 | FY 2011 | FY 2010 |
|---|---|---|---|---|---|---|---|---|---|---|---|---|---|---|---|---|
| Revenue | 36.473B | 37.209B | 31.427B | 33.841B | 32.533B | 24.024B | 28.911B | 29.751B | 31.766B | 26.955B | 25.982B | 31.869B | 34.423B | 45.364B | 55.075B | 36.686B |
| Net profit | 448.455M | 862.265M | 680.018M | 1.783B | 3.931B | -21.891M | 740.316M | 1.192B | 874.107M | 988.352M | 529.115M | 1.141B | 1.495B | 2.574B | 5.742B | 3.279B |
| Figure | FY 2025 | FY 2024 | FY 2023 | FY 2022 | FY 2021 | FY 2020 | FY 2019 | FY 2018 | FY 2017 | FY 2016 | FY 2015 | FY 2014 | FY 2013 | FY 2012 | FY 2011 | FY 2010 |
|---|---|---|---|---|---|---|---|---|---|---|---|---|---|---|---|---|
| Share price | 15.5 | 20.15 | 24.1 | 27.05 | 40.4 | 23.3 | — | — | — | — | — | — | — | — | — | — |
| Price performance 12m | -0.23 | -0.16 | -0.11 | -0.33 | 0.73 | — | — | — | — | — | — | — | — | — | — | — |
Sign up to see institutional holdings
Sign UpPodcast Mentions
Sign up to see podcast mentions and sentiment
Sign UpMaterial information published on MOPS, newest first, subjects as filed in Chinese, guarantee and loan balance notices and routine equipment purchases included. The link opens the company's material information on MOPS. Press releases from the company's own website, newest first.
代子公司申華化學工業有限公司公告解除 董事競業禁止之限制
Bull 0
Bear 0
Routine
代子公司台橡(南通)實業有限公司公告股東臨時會 重要決議事宜
Bull 0
Bear 0
Routine









Prompts
Click prompts to add them under the company line, click again to take one out, then copy the result into your AI chat. Shared by Asian Century Stocks and Uncovered Thai Stocks. Thank you.
TSRC Corporation (ticker 2103.TW), listed in Taiwan.
Copied
ETFs Holding TSRC Corporation
Exchange-traded funds whose newest published daily portfolio holds one of the company's listings, largest weight first.
| ETF | Weight in ETF | Shares | Market value | As of |
|---|---|---|---|---|
| AVEE | 0.03% | 59,000 | $ 39.018K | Nov 16, 2026 |
| DFEV | 0.01% | 408,000 | $ 286.483K | Nov 12, 2026 |
| DEXC | 0.01% | 31,000 | $ 21.767K | Nov 12, 2026 |
| DFSE | 0.01% | 49,000 | $ 34.406K | Nov 12, 2026 |
| DFEM | 0.01% | 701,000 | $ 492.217K | Nov 12, 2026 |
| DFAE | 0.00% | 495,000 | $ 347.571K | Nov 12, 2026 |
| DFAX | 0.00% | 443,717 | $ 311.562K | Nov 12, 2026 |
| AVEM | 0.00% | 1,030,000 | $ 681.163K | Nov 16, 2026 |
| AVES | 0.00% | 82,000 | $ 54.229K | Nov 16, 2026 |
| AVSE | 0.00% | 13,000 | $ 8,597.21 | Nov 16, 2026 |
| AVXC | 0.00% | 29,000 | $ 19.178K | Nov 16, 2026 |