本公司受邀參加群益證券舉辦之線上法人說明會,說明營運狀況
Bull 0
Bear 0
Routine
1810.TW
|
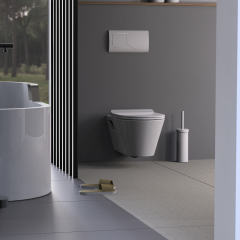
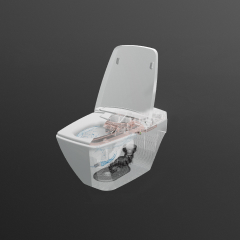
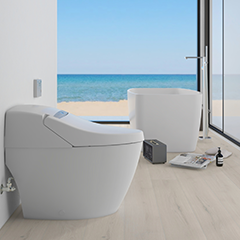
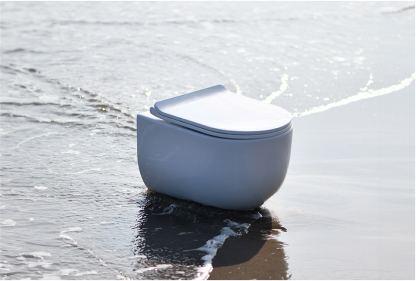
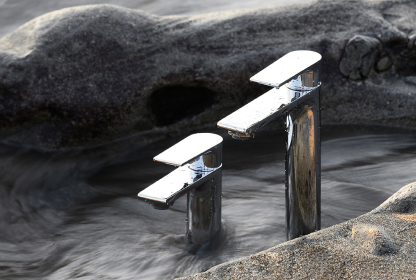
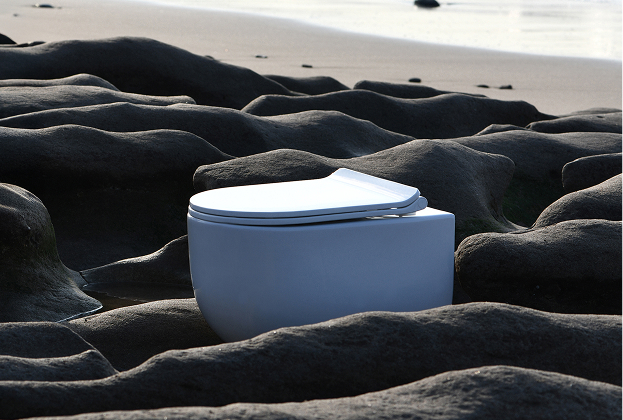
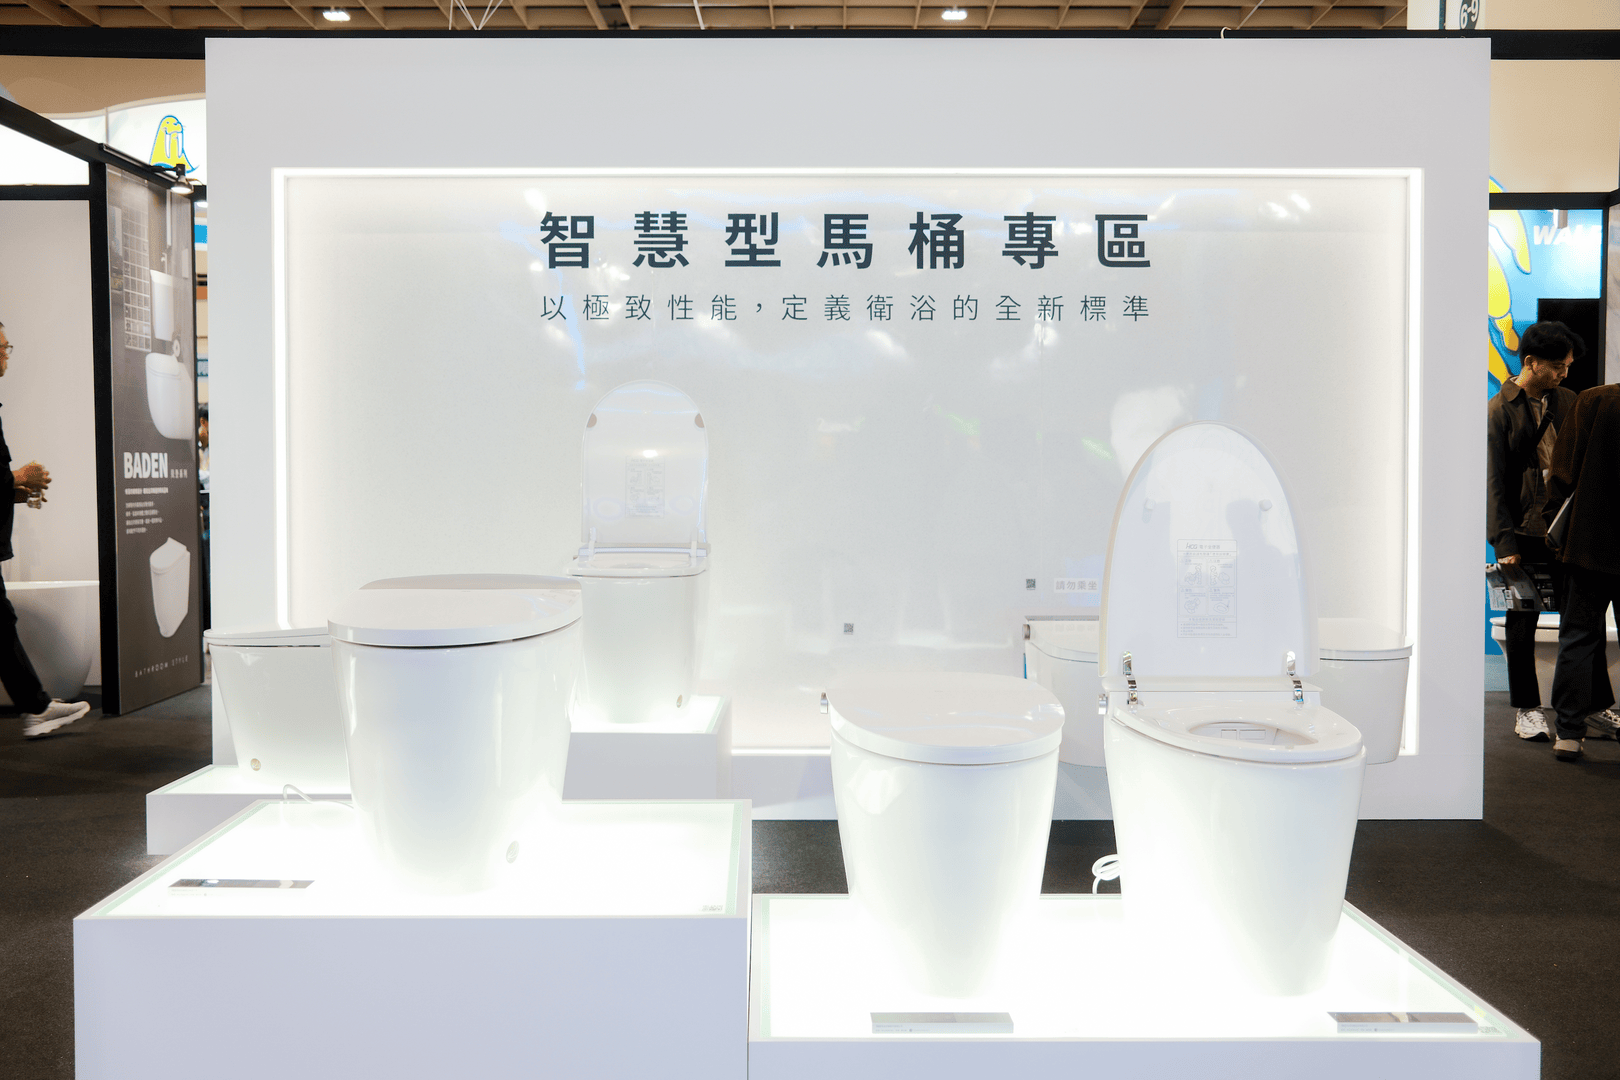
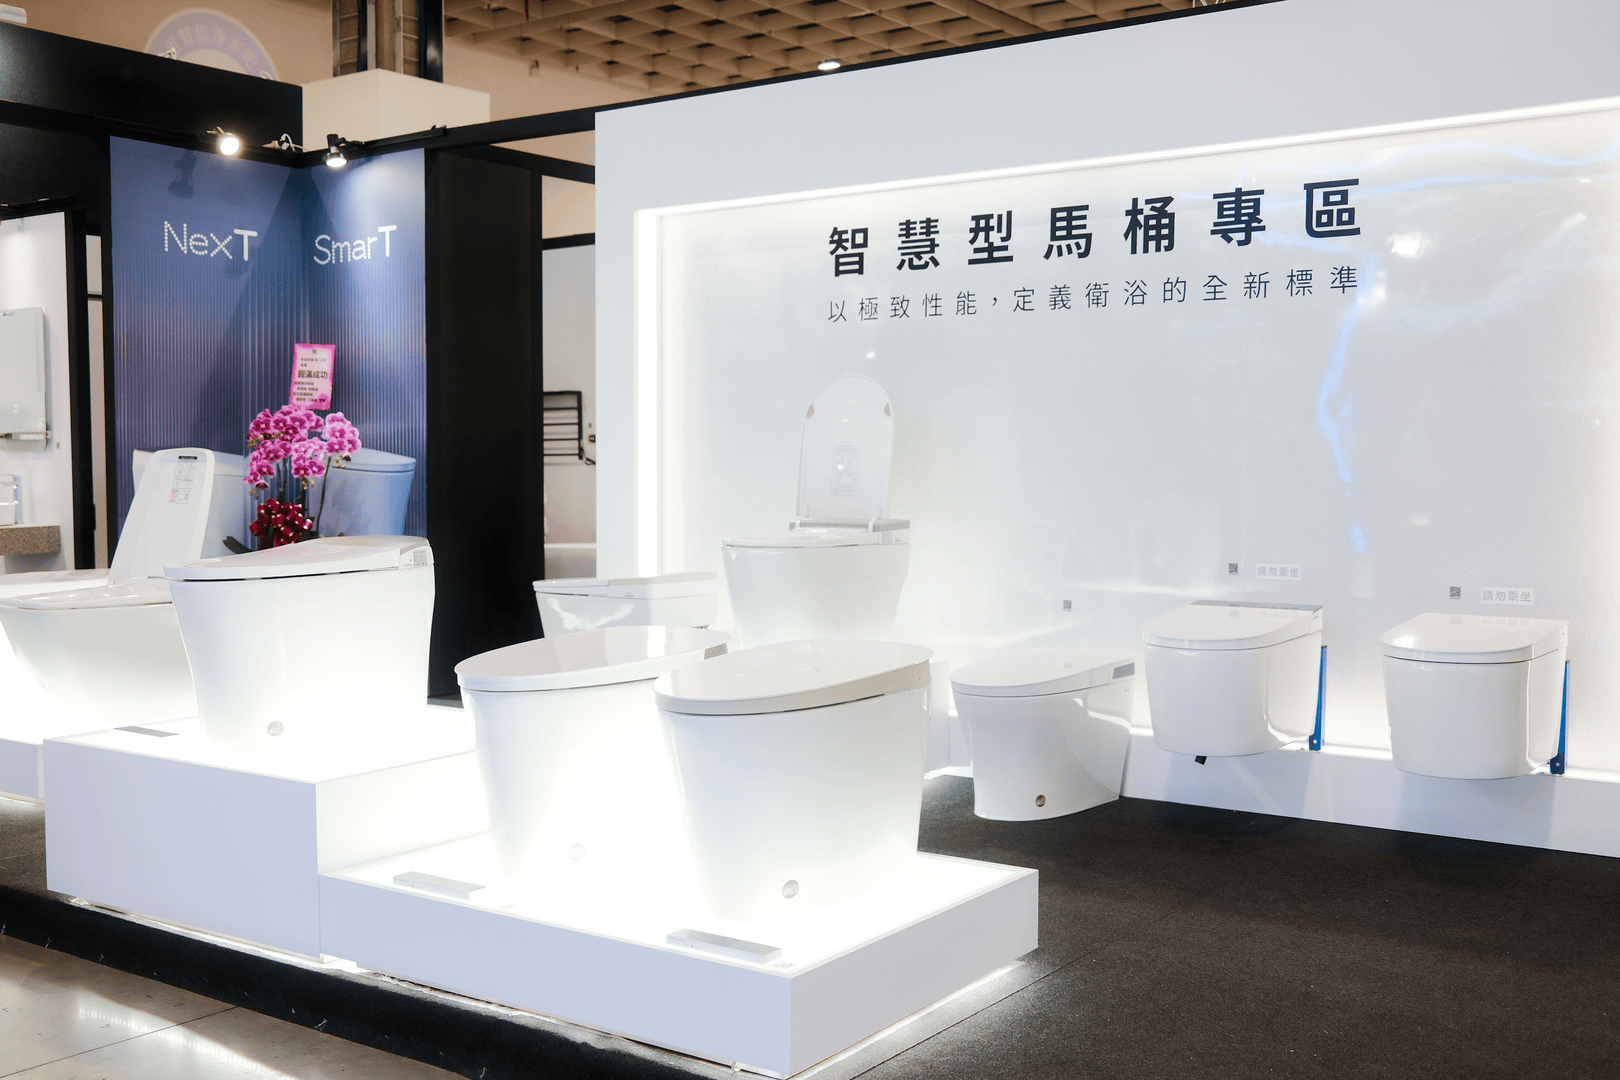
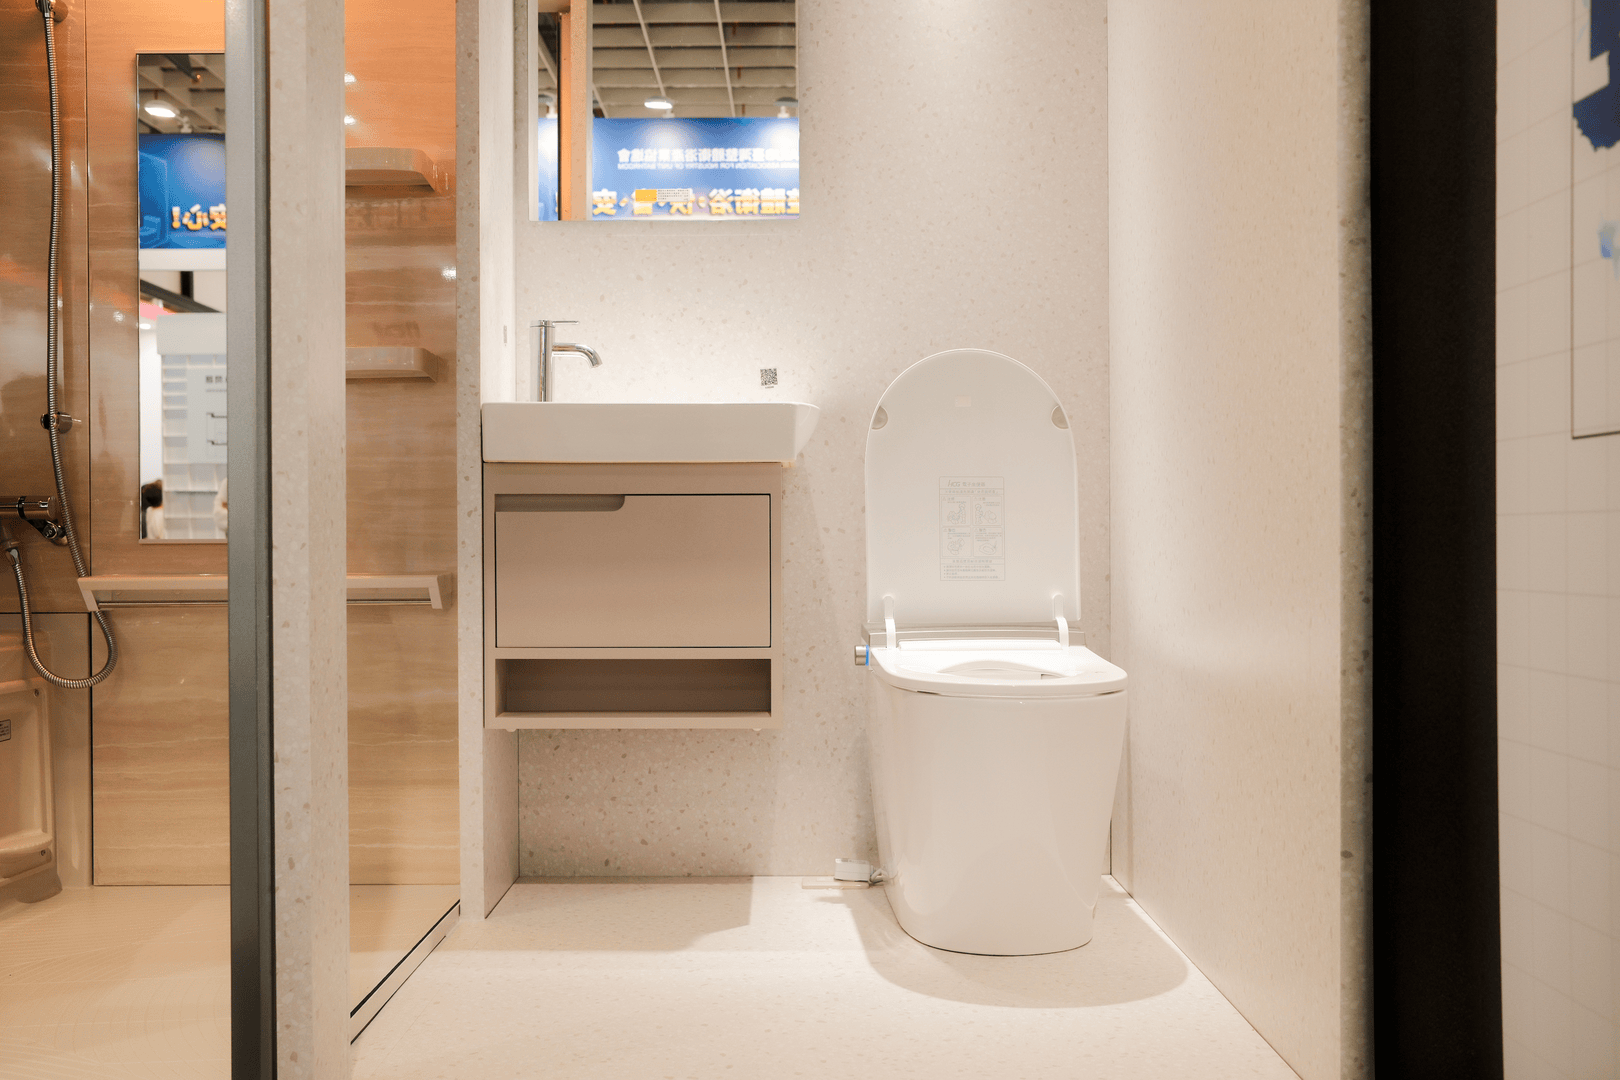
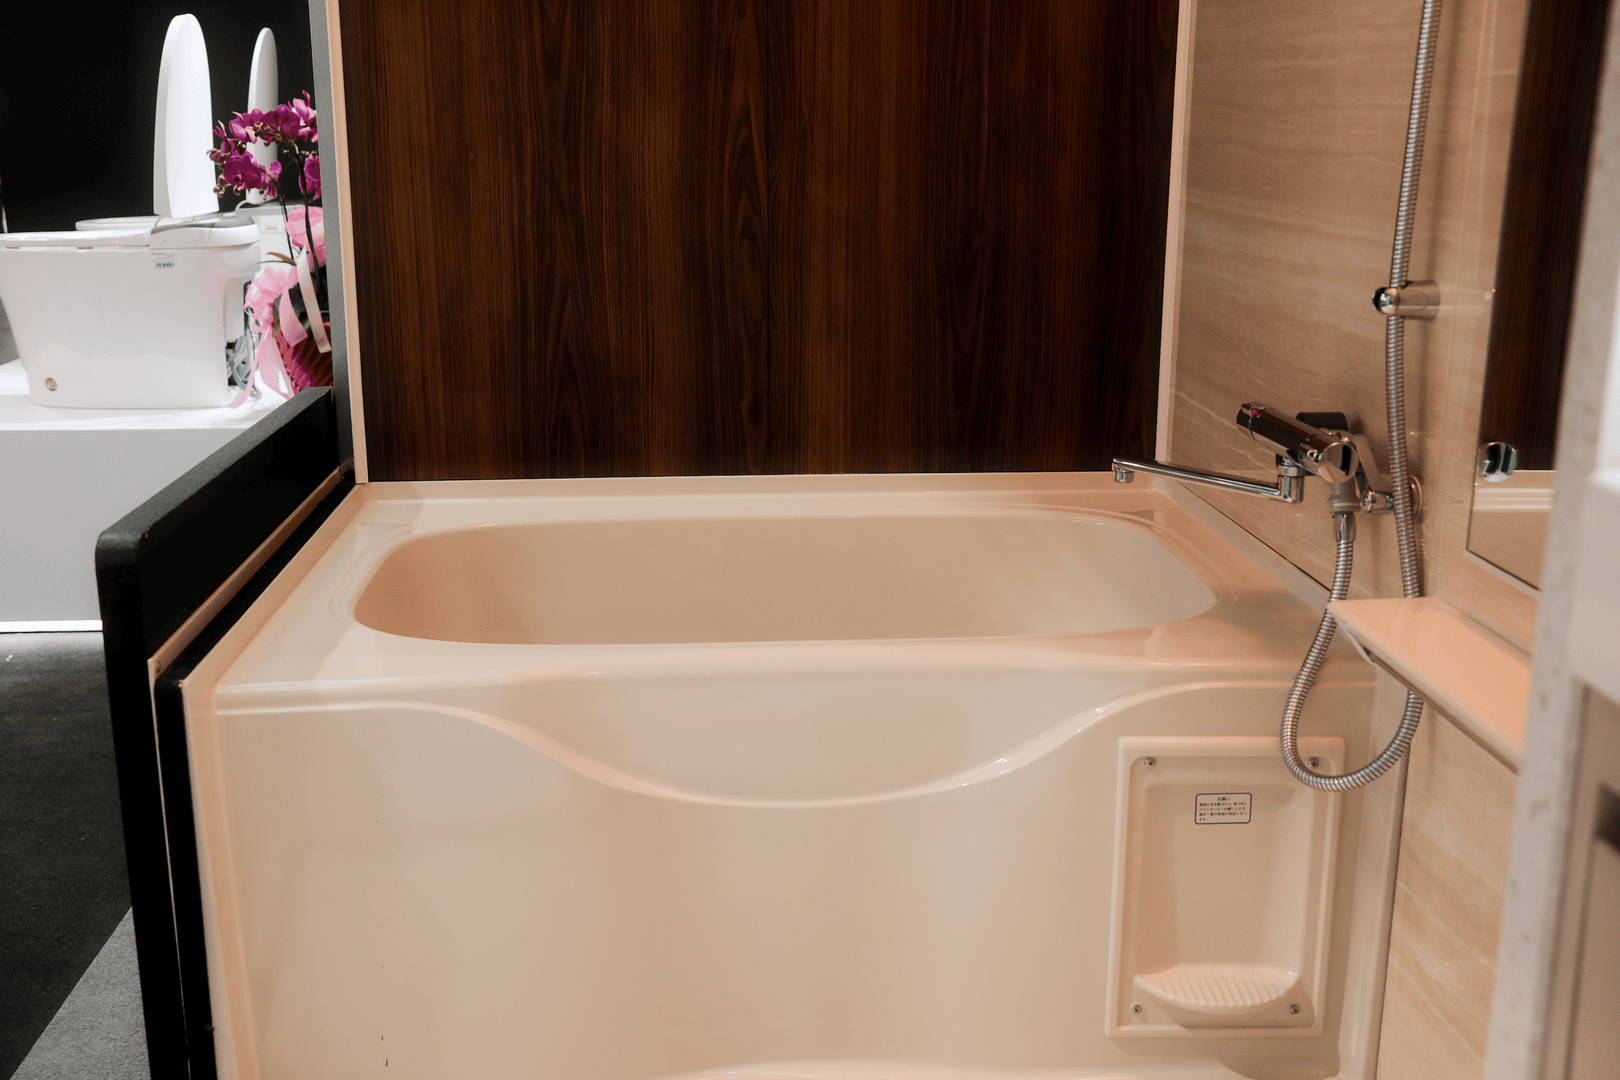
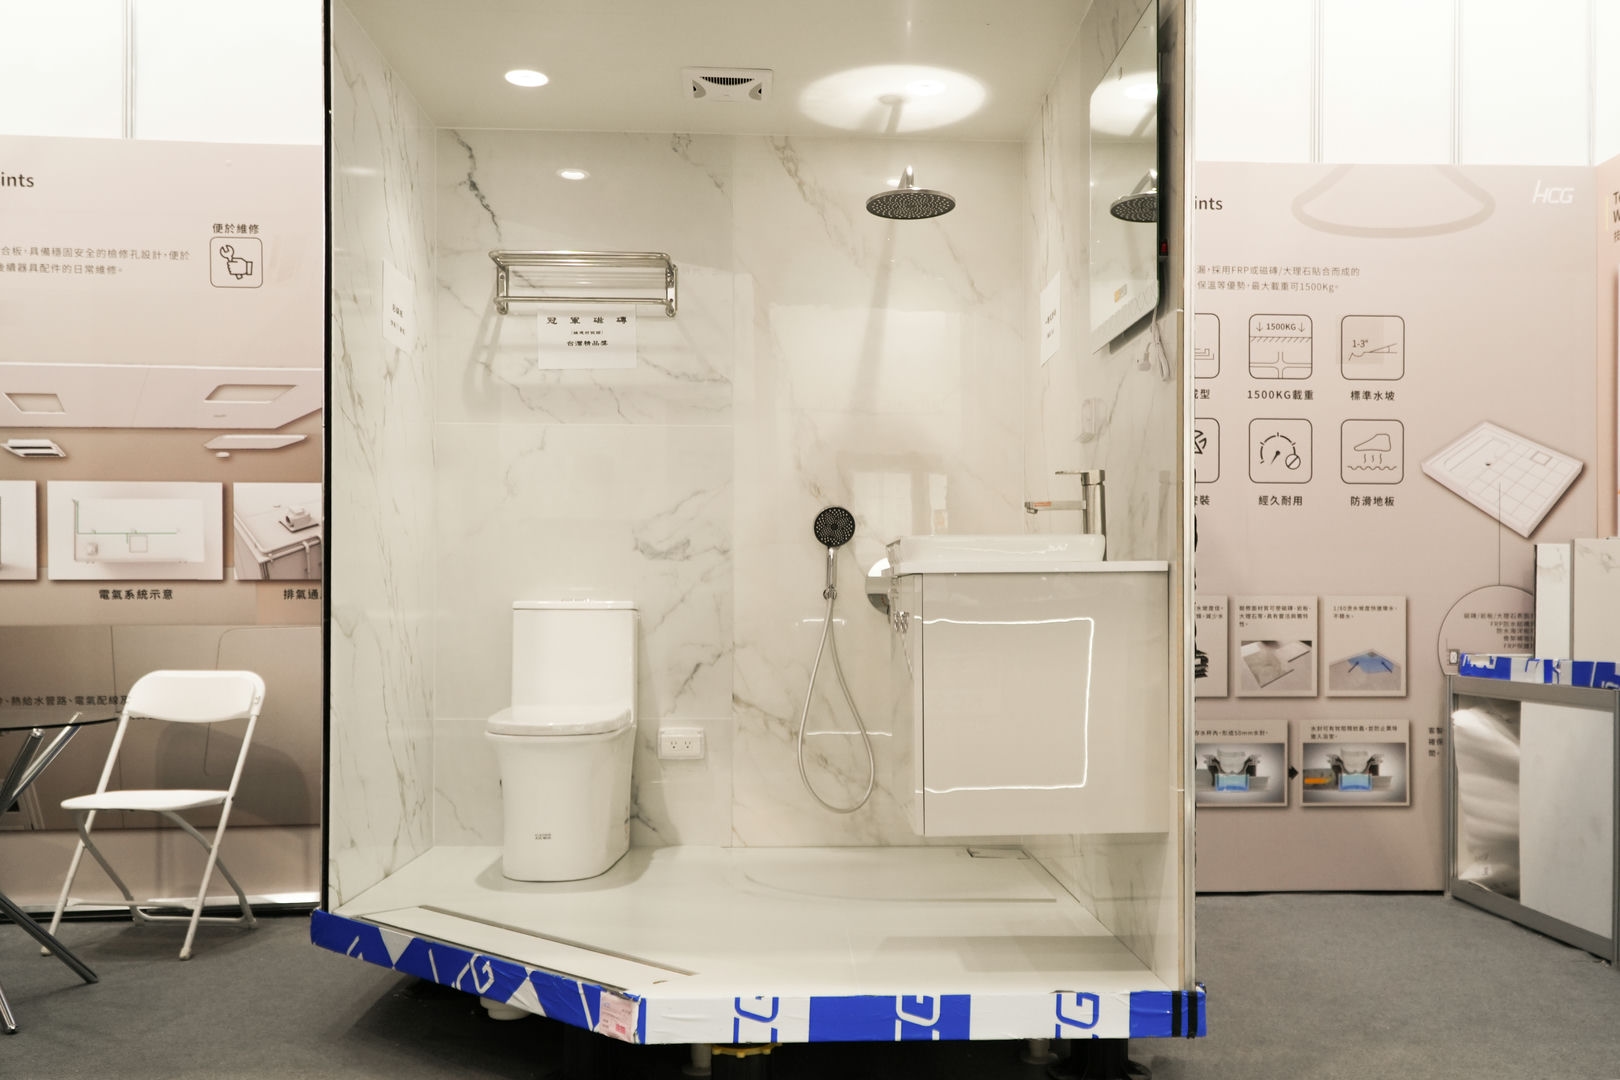
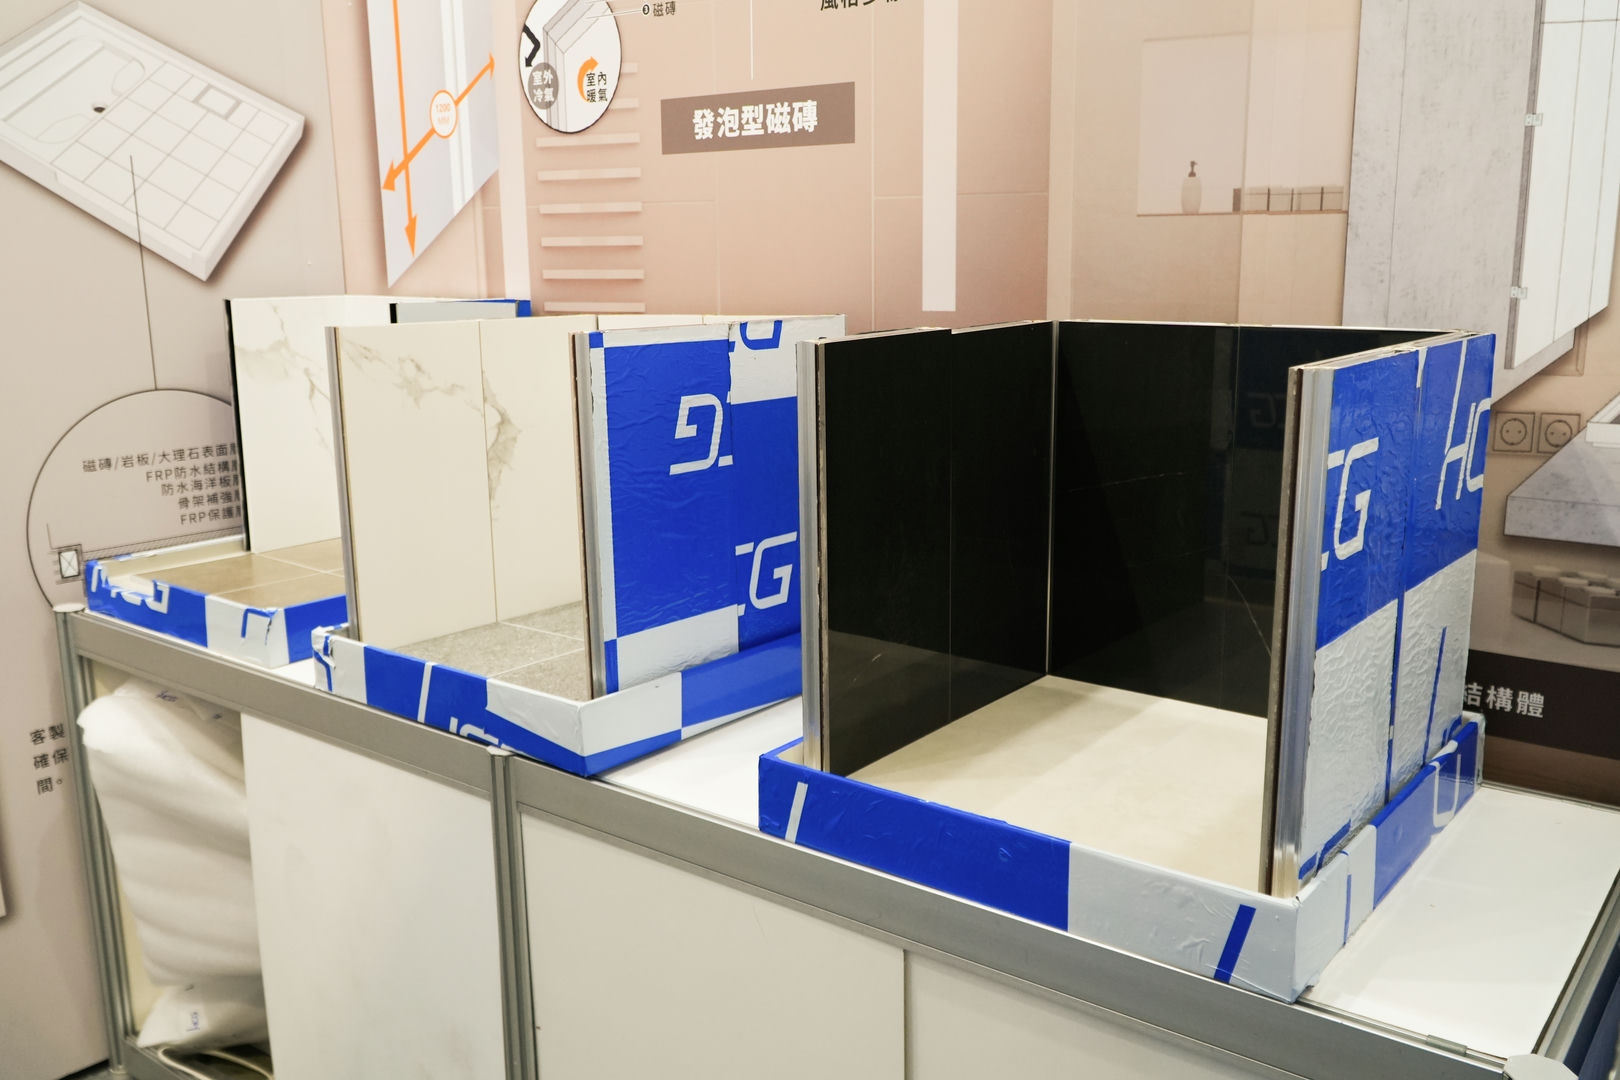
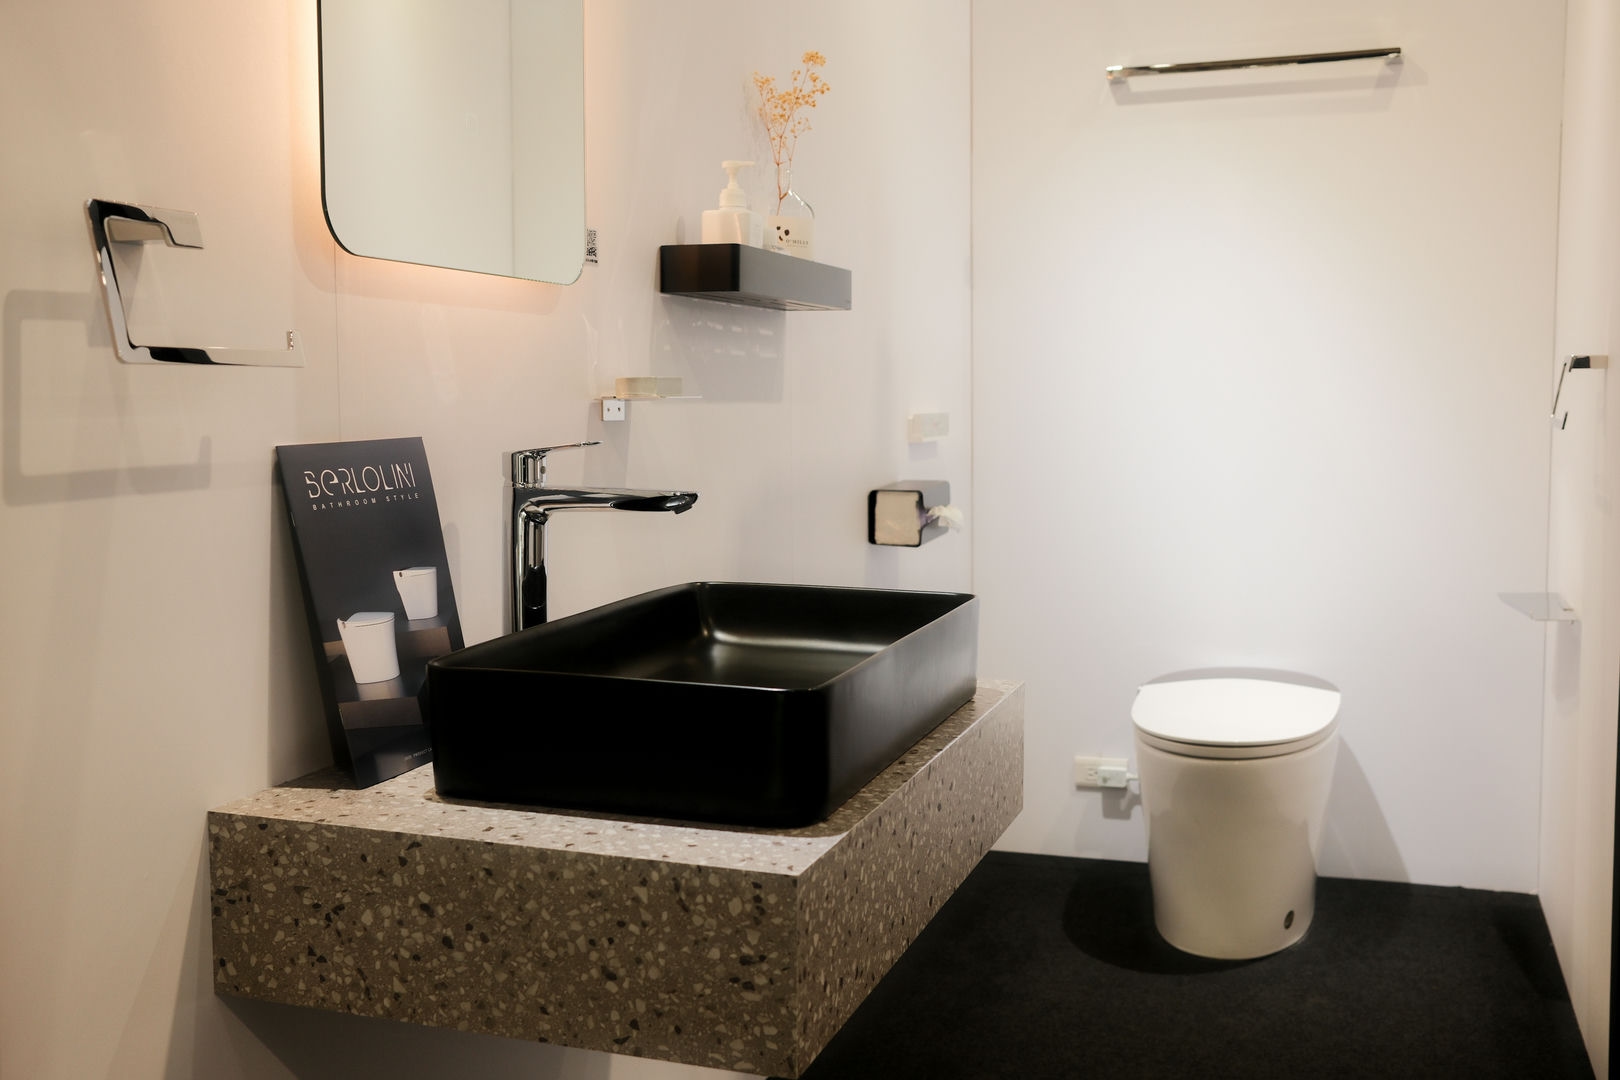
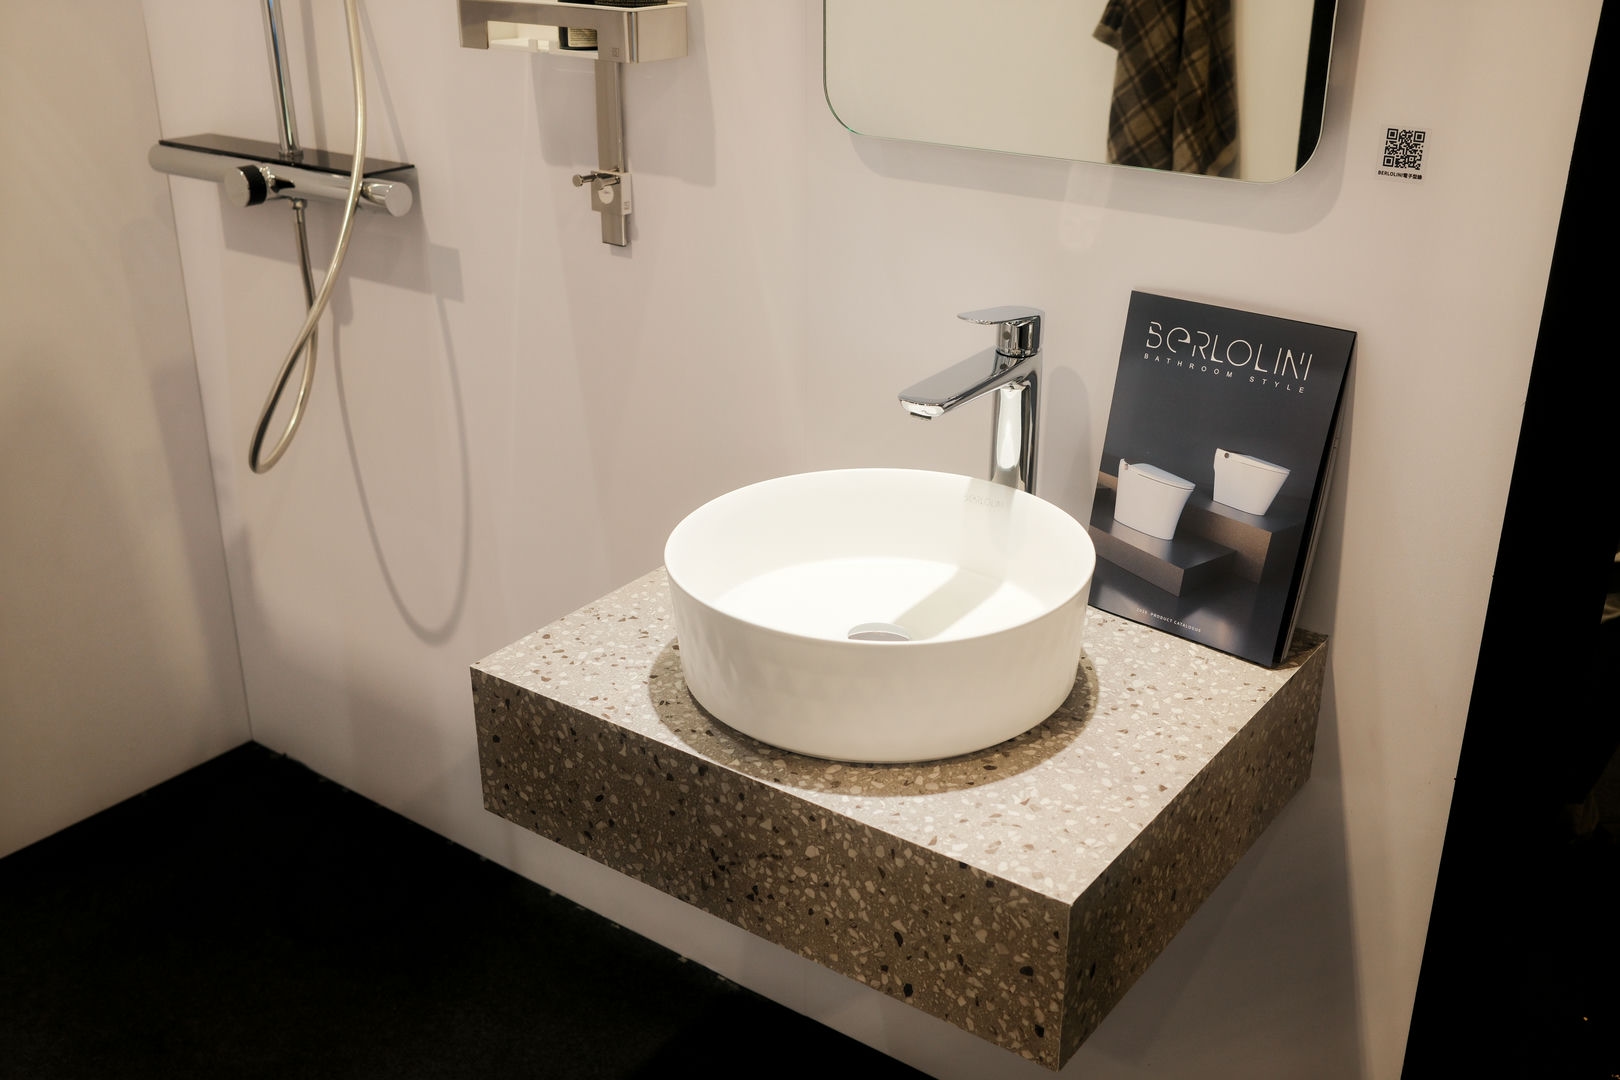
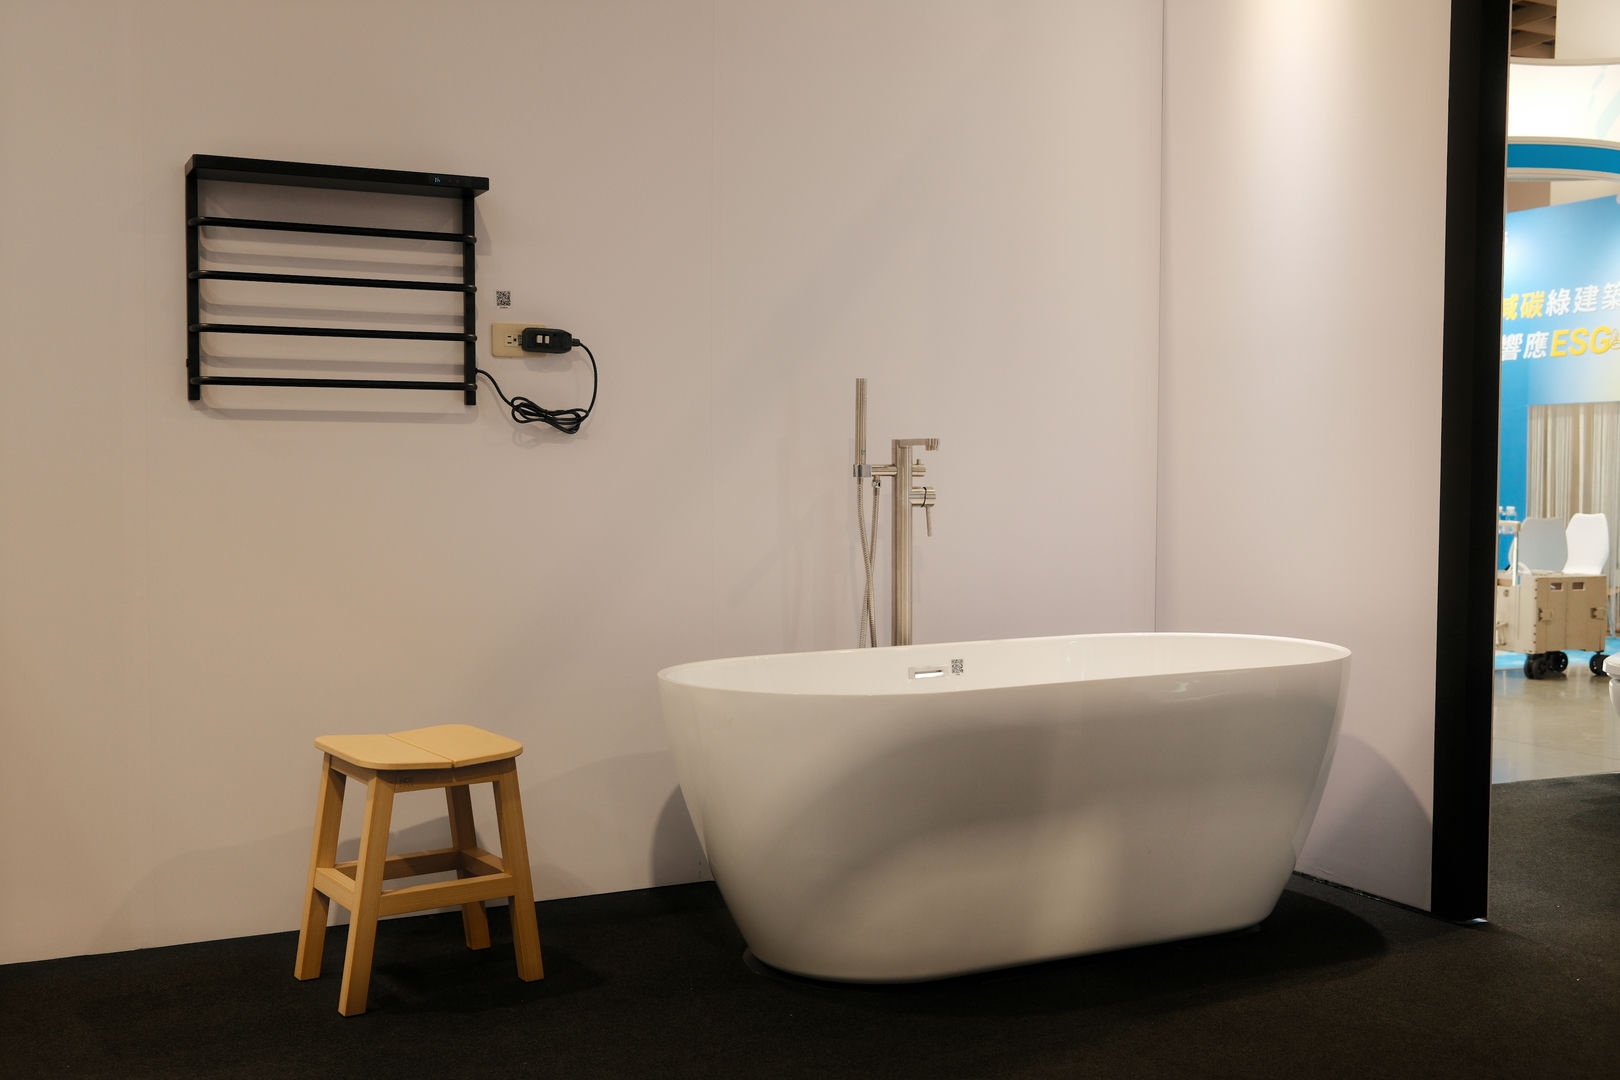
Hocheng Corporation is a diversified manufacturer of residential equipment and building materials, founded in 1931. The company's core business involves the production of sanitary ware, kitchen equipment, and copper water supply components, with a product range that includes smart toilets, washbasins, faucets, bathtubs, and handrails. Beyond its primary consumer-facing segments, the company operates in the fields of precision ceramics, composite materials, and ballistic ceramics. Hocheng also develops building-related products and residential equipment, including stoves and smart home devices such as electric clothes dryers. The company serves the construction and residential markets, providing products for both new builds and renovations. Its operations extend to the development of barrier-free products for aging populations and the integration of energy-saving technologies into home appliances. The group includes subsidiaries involved in these various manufacturing and material science sectors. Summarised from the company's own disclosures, fiscal year ended Oct 2026 |
Industry Building Products & Equipment | Homepage hcg.com.tw |
| Sector Industrials | IR page hcg.com.tw/tw/investor | |
|
Tags
sanitary ware, kitchen equipment, copper water supply, precision ceramics, composite materials, ballistic ceramics, smart toilets, residential equipment, building materials, barrier-free products, HCG, Hocheng Corporation, Hocheng Xinye Co. Ltd., AFC6695, PURO, LAZULI, Gao Fen
|
Press page hcg.com.tw/tw/news |
Metrics
| Valuation | |
|---|---|
| Market cap | NT$ 5.495B |
| Market cap (USD) | $ 166.77M |
| P/E | 5.06 |
| PEG | — |
| P/BV | 0.65 |
| P/S | 1.25 |
| P/OCF | -30.39 |
| P/FCF | — |
| Dividend yield | — |
| Turnover / mcap | — |
| Returns | |
|---|---|
| ROE | 0.21% |
| ROI | 0.21% |
| ROIC | -0.36% |
| Profit margin | 0.31% |
| Growth | |
|---|---|
| Revenue growing | No |
| Profits growing | No |
| Revenue up 3y | No |
| Revenue up 5y | No |
| Earnings growth 3y (net profit CAGR) | -55.0% |
| Quality | |
|---|---|
| Profitable | Yes |
| Margin expanding | No |
| Buying back stock | No |
| Diluting (TTM) | No |
| Debt/Equity | — |
| Podcast bulls (TTM) | Sign up |
| Podcast bears (TTM) | Sign up |
| Podcast sentiment (TTM) | Sign up |
| Podcast sentiment % (TTM) | Sign up |
| News sentiment (TTM) | 0 |
| Quality score | -43.8% |
| Insiders | |
|---|---|
| Buys, 1w | Sign up |
| Buys, 1m | Sign up |
| Buys, 1y | Sign up |
| Sells, 1w | Sign up |
| Sells, 1m | Sign up |
| Sells, 1y | Sign up |
Sign up to see this company's insider trades
| Figure | FY 2025 | FY 2024 | FY 2023 | FY 2022 | FY 2021 | FY 2020 | FY 2019 | FY 2018 | FY 2017 | FY 2016 | FY 2015 | FY 2014 | FY 2013 | FY 2012 | FY 2011 | FY 2010 |
|---|---|---|---|---|---|---|---|---|---|---|---|---|---|---|---|---|
| Revenue | 4.557B | 4.857B | 4.871B | 5.004B | 5.313B | 5.102B | 5.526B | 5.466B | 5.709B | 5.921B | 5.973B | 5.984B | 6.019B | 5.697B | 5.499B | 5.049B |
| Net profit | 14.304M | 58.418M | 19.347M | 157.29M | 1.225B | 86.793M | 47.916M | -65.536M | 167.992M | 296.619M | 127.431M | 181.562M | 179.238M | 42.745M | 45.255M | 26.143M |
| Figure | FY 2025 | FY 2024 | FY 2023 | FY 2022 | FY 2021 | FY 2020 | FY 2019 | FY 2018 | FY 2017 | FY 2016 | FY 2015 | FY 2014 | FY 2013 | FY 2012 | FY 2011 | FY 2010 |
|---|---|---|---|---|---|---|---|---|---|---|---|---|---|---|---|---|
| Share price | 17.55 | 17.3 | 18.15 | 18.5 | 17.65 | 10.2 | — | — | — | — | — | — | — | — | — | — |
| Price performance 12m | 0.01 | -0.05 | -0.02 | 0.05 | 0.73 | — | — | — | — | — | — | — | — | — | — | — |
Sign up to see institutional holdings
Sign UpPodcast Mentions
Sign up to see podcast mentions and sentiment
Sign UpMaterial information published on MOPS, newest first, subjects as filed in Chinese, guarantee and loan balance notices and routine equipment purchases included. The link opens the company's material information on MOPS. Press releases from the company's own website, newest first.



















Prompts
Click prompts to add them under the company line, click again to take one out, then copy the result into your AI chat. Shared by Asian Century Stocks and Uncovered Thai Stocks. Thank you.
Hocheng Corporation (ticker 1810.TW), listed in Taiwan.
Copied
ETFs Holding Hocheng Corporation
Exchange-traded funds whose newest published daily portfolio holds one of the company's listings, largest weight first.
| ETF | Weight in ETF | Shares | Market value | As of |
|---|---|---|---|---|
| AVEE | 0.01% | 28,000 | $ 16.889K | Nov 16, 2026 |
| DFEM | 0.00% | 453,820 | $ 284.932K | Nov 12, 2026 |
| DFAE | 0.00% | 235,000 | $ 147.545K | Nov 12, 2026 |
| DFAX | 0.00% | 206,580 | $ 129.702K | Nov 12, 2026 |
| DFSE | 0.00% | 10,000 | $ 6,278.53 | Nov 12, 2026 |
| DEXC | 0.00% | 2,000 | $ 1,255.71 | Nov 12, 2026 |
| AVEM | 0.00% | 321,320 | $ 193.817K | Nov 16, 2026 |
| AVSE | 0.00% | 8,000 | $ 4,825.53 | Nov 16, 2026 |