Metrics
Market cap
NT$ 11.497B
Market cap (USD)
$ 348.961M
P/E
3.87
PEG
—
P/BV
1.03
P/S
0.89
P/OCF
9.84
P/FCF
—
Dividend yield
—
Turnover / mcap
—
ROE
26.9%
ROI
24.4%
ROIC
8.9%
Profit margin
20.6%
Revenue growing
Yes
Profits growing
Yes
Revenue up 3y
No
Revenue up 5y
No
Earnings growth 3y (net profit CAGR)
—
Profitable
Yes
Margin expanding
Yes
Buying back stock
No
Diluting (TTM)
No
Debt/Equity
—
Podcast bulls (TTM)
Sign up
Podcast bears (TTM)
Sign up
Podcast sentiment (TTM)
Sign up
Podcast sentiment % (TTM)
Sign up
News sentiment (TTM)
0
Quality score
43.8%
Buys, 1w
Sign up
Buys, 1m
Sign up
Buys, 1y
Sign up
Sells, 1w
Sign up
Sells, 1m
Sign up
Sells, 1y
Sign up
Sign up to see this company's insider trades
Fundamentals
(all numbers in TWD)
Compare
All 31 figures
Annual
Quarterly
Compare with
×
11.331B
11.329B
9.755B
10.75B
10.485B
7.44B
7.833B
8.56B
8.299B
7.084B
8.674B
9.917B
11.044B
13.884B
15.241B
16.418B
Net profit
2.335B
656.053M
947.847M
-36.464M
1.388B
323.664M
792.653M
-617.703M
439.569M
97.646M
-141.519M
-6.792M
415.513M
538.173M
-14.058M
254.311M
Share price
38.35
25.9
21.45
13.7
22.2
13.7
—
—
—
—
—
—
—
—
—
—
Price performance 12m
0.48
0.21
0.57
-0.38
0.62
—
—
—
—
—
—
—
—
—
—
—
Sign up to see institutional holdings
Sign Up
Podcast Mentions
Sign up to see podcast mentions and sentiment
Sign Up
Material information published on MOPS, newest first, subjects as filed in Chinese, guarantee and loan balance notices and routine equipment purchases included. The link opens the company's material information on MOPS. Press releases from the company's own website, newest first.
AI comment
This is a routine notice announcing the date, time, and location of an upcoming investor relations meeting to discuss the first three quarters of operations. It contains no new financial data, guidance, or material developments, only procedural information.
AI comment
The board approved a routine waiver of the non-compete restriction for the Corporate Governance Supervisor to hold a similar role in a group company, with no impact on finances. This is a standard corporate governance filing with no value implication.
AI comment
This is a routine administrative filing announcing the retirement of the corporate governance supervisor and the appointment of the accounting supervisor to fill the vacancy. Such routine management personnel changes do not impact the company's financial value or operations.
AI comment
This is a routine regulatory filing announcing that the board has approved the third-quarter consolidated financial report. It does not contain new operational insights or performance commentary beyond the raw figures, which are standard disclosures.
AI comment
Routine filing regarding the retirement of the corporate governance officer and the pending appointment of a successor; this is a standard management change with no impact on company value.
最新消息 最新消息 字級設定 : A A A 2026-08-06 115年第二季合併財務報表 相關連結或檔案下載 :檔案下載 上一頁 首頁 關於華榮 公司簡介 公司組織 歷程紀事 轉投資企業 營業據點 產品介紹 高品質無氧銅棒、銅線 各類型電力電纜(高、中、低壓) 電纜用銅線、鋁裸線…
最新消息
字級設定 :
A A A
2026-08-06
115年第二季合併財務報表
相關連結或檔案下載 :檔案下載
上一頁
AI comment
This is a routine filing notice for the Q2 consolidated financial statements. The text provides only the headline and website navigation elements, with no financial data or performance details included in the snippet.
AI comment
This is a routine filing announcing that the board has approved the Q2 consolidated financial report; it does not contain the actual financial results or commentary needed to assess performance.
AI comment
This is a routine administrative notice setting the record date and payment schedule for a cash dividend that was already approved by the board and shareholders. It provides no new information regarding the company's value or future performance.
AI comment
This is a routine corporate governance filing regarding the shareholder meeting's approval to lift non-compete restrictions for a specific director. It has no impact on the company's financial value or operations.
AI comment
This is a routine filing regarding the expiration of terms and reappointment of independent directors on the Remuneration Committee. It involves no contested decisions, strategic shifts, or financial implications, making it neutral for investors.
AI comment
Routine filing regarding the expiration of audit committee members' terms and their replacement with new independent directors; no substantive business impact.
AI comment
The company announced the re-election of Wang Hung-jen as Chairman following the expiration of his term during a routine board reshuffle. This is a standard corporate governance procedure with no change in leadership or strategic direction, representing routine news that conveys no new information about value.
AI comment
This is a routine announcement regarding the completion of the annual general meeting's board of directors election due to the expiration of terms. The changes involve standard reappointments and one new independent director, with no contested issues or strategic shifts that would impact company value.
AI comment
This is a routine announcement of the outcomes of the Annual General Meeting, including the approval of last year's financial statements, dividend distribution, and the election of directors. These are standard corporate formalities that convey no new information regarding the company's value or future prospects.
上一頁 首頁 關於華榮 公司簡介 公司組織 歷程紀事 轉投資企業 營業據點 產品介紹 高品質無氧銅棒、銅線 各類型電力電纜(高、中、低壓) 電纜用銅線、鋁裸線 各類型通信銅纜 超高壓、海纜統包工程 各類型光纖光纜 相關認證證書 投資人專區 投資人關係 股東會相關資料…
上一頁
AI comment
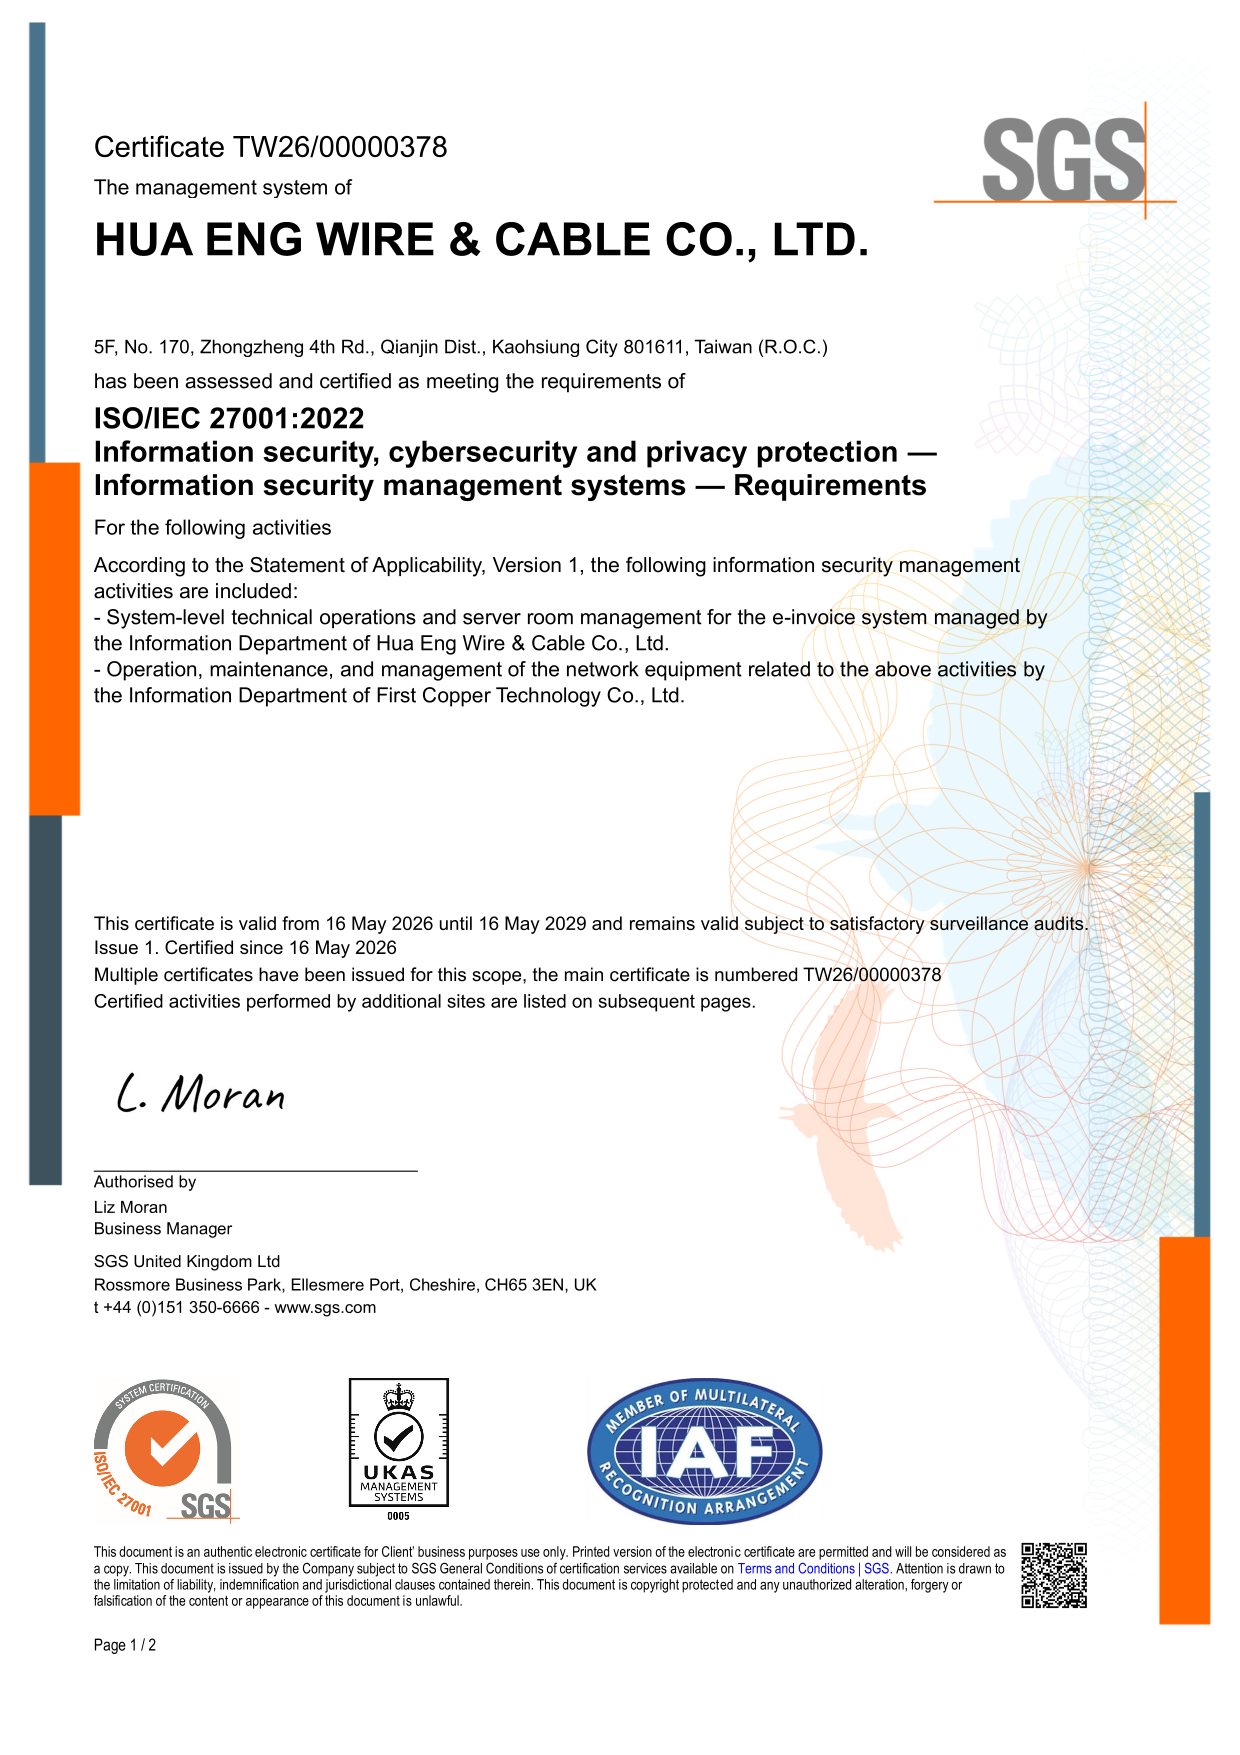
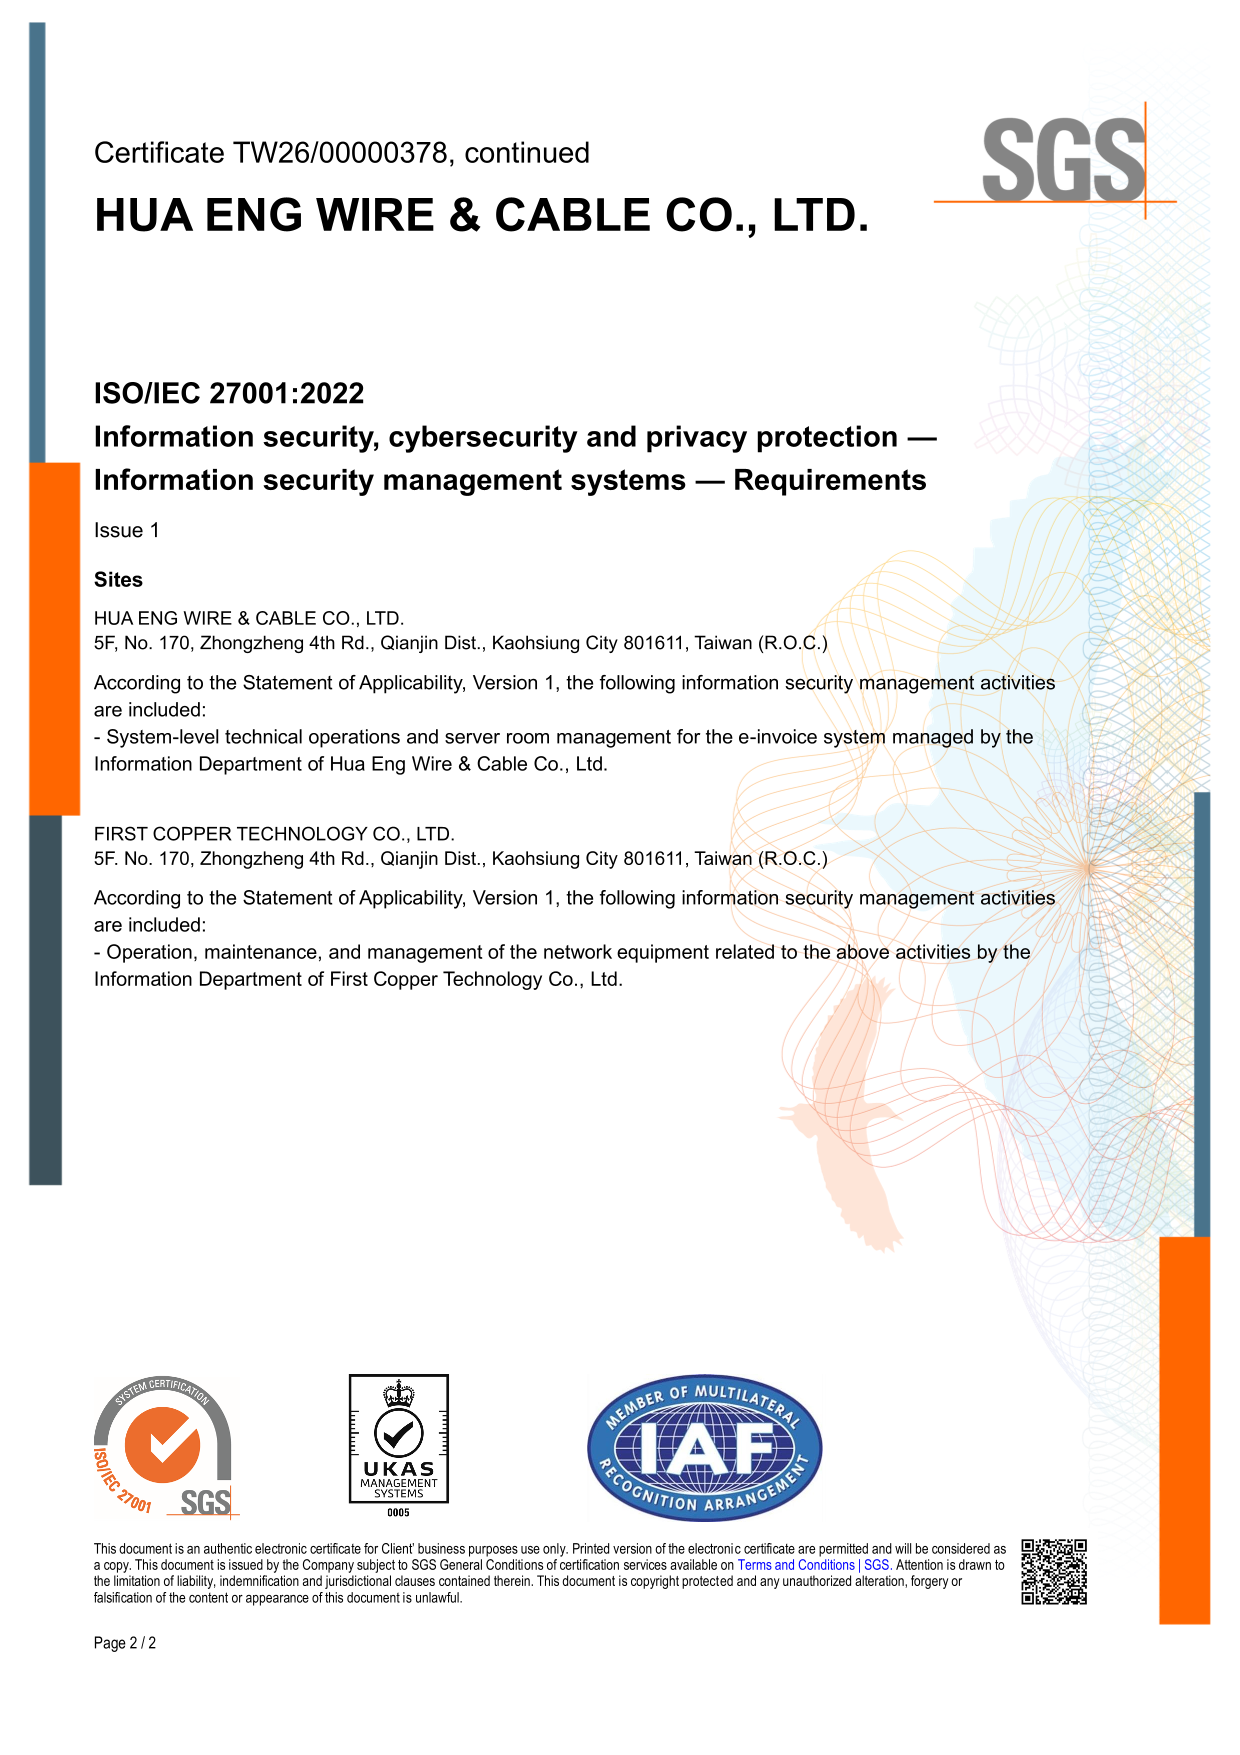
The company received ISO 27001 information security certification, which is a routine compliance and quality award that does not directly impact financial performance or market value.
AI comment
This is a routine notice announcing the date, time, and location of an upcoming investor relations meeting to discuss Q1 operations. It contains no substantive financial data, guidance, or strategic announcements that would impact valuation.
最新消息 最新消息 字級設定 : A A A 2026-05-06 115年第一季合併財務報表 相關連結或檔案下載 :檔案下載 上一頁 首頁 關於華榮 公司簡介 公司組織 歷程紀事 轉投資企業 營業據點 產品介紹 高品質無氧銅棒、銅線 各類型電力電纜(高、中、低壓) 電纜用銅線、鋁裸線…
最新消息
字級設定 :
A A A
2026-05-06
115年第一季合併財務報表
相關連結或檔案下載 :檔案下載
上一頁
AI comment
This is a routine filing notice for the Q1 consolidated financial statements, which is a standard regulatory requirement that provides no new substantive information on its own.
AI comment
This is a routine regulatory filing announcing the board's approval of the Q1 consolidated financial report. It provides preliminary figures but does not constitute a formal earnings release with commentary or a comparison to prior year performance that would allow for a substantive valuation adjustment on its own.
AI comment
Routine filing announcing the appointment of Huang Ching-hui as R&D Director, replacing Lee Hsien-chang. Management changes of this nature are routine and do not impact company value.
華榮電線電纜股份有限公司 最新消息News 首頁 最新消息 最新消息 114年度個體財報... 最新消息 最新消息 字級設定 : A A A 2026-03-11 114年度個體財報 相關連結或檔案下載 :檔案下載 上一頁 首頁 關於華榮 公司簡介 公司組織 歷程紀事 轉投資企業 營業據點…
華榮電線電纜股份有限公司
最新消息News
最新消息
字級設定 :
A A A
2026-03-11
114年度個體財報
相關連結或檔案下載 :檔案下載
上一頁
AI comment
This is a routine filing notice for the release of the individual financial statements for the year 2025 (fiscal year 114). It announces the availability of the report but does not contain the financial results or any new operational information itself.
華榮電線電纜股份有限公司 最新消息News 首頁 最新消息 最新消息 114年度合併財報... 最新消息 最新消息 字級設定 : A A A 2026-03-11 114年度合併財報 相關連結或檔案下載 :檔案下載 上一頁 首頁 關於華榮 公司簡介 公司組織 歷程紀事 轉投資企業 營業據點…
華榮電線電纜股份有限公司
最新消息News
最新消息
字級設定 :
A A A
2026-03-11
114年度合併財報
相關連結或檔案下載 :檔案下載
上一頁
AI comment
This is a routine filing notice for the 2025 consolidated financial statements. While the release of results is an important event, the notice itself provides no financial data, guidance, or commentary to assess value, making it neutral.
2026-03-09
董事會決議股利分派
Bull 3
Bear 0
Capital return
AI comment
The board proposed a cash dividend of 2.00 TWD per share, totaling approximately 1.27 billion TWD, which represents a yield of roughly 9.6% based on the 13.15 billion TWD market cap. This is a material capital return that directly benefits shareholders, though it is a routine annual distribution rather than a special dividend or buyback.
AI comment
This is a routine filing announcing that the board and audit committee have approved the consolidated financial report for the fiscal year ended December 31, 2024. It serves as a formal procedural step and does not contain new substantive information or surprises beyond the previously reported figures.
最新消息 最新消息 字級設定 : A A A 2025-11-06 114年第三季合併財務報表 相關連結或檔案下載 :檔案下載 上一頁 首頁 關於華榮 公司簡介 公司組織 歷程紀事 轉投資企業 營業據點 產品介紹 高品質無氧銅棒、銅線 各類型電力電纜(高、中、低壓) 電纜用銅線、鋁裸線…
最新消息
字級設定 :
A A A
2025-11-06
114年第三季合併財務報表
相關連結或檔案下載 :檔案下載
上一頁
AI comment
This is a routine filing notice for the Q3 consolidated financial statements. It provides no performance data or guidance, only a link to download the full report, which is a standard regulatory requirement.
Show all 26 news items
Click prompts to add them under the company line, click again to take one out, then copy the result into your AI chat.
Shared by
Asian Century Stocks and
Uncovered Thai Stocks .
Thank you.
Base
Enforce Recency
Overview
Bull Bear
Competitive Advantages
Supply Chain
Segments
Earnings Results
Earnings Calls
Management
Stock Price Analysis
Comps
Forward Projection
Red Flags
Management Questions
Devils Advocate
Constraints
Share Value Compliance
Equity Research
Hua Eng Wire & Cable Co., Ltd. (ticker 1608.TW), listed in Taiwan.
Copy
Clear
Copied
ETFs Holding Hua Eng Wire & Cable Co., Ltd.
Exchange-traded funds whose newest published daily portfolio holds one of the company's listings, largest weight first.
JSTC
0.16%
532,963
$ 465.95K
Nov 17, 2026
AVEE
0.02%
36,000
$ 31.32K
Nov 16, 2026
DEXC
0.01%
39,000
$ 35.665K
Nov 12, 2026
DFEV
0.01%
197,000
$ 180.153K
Nov 12, 2026
DFSE
0.01%
40,000
$ 36.579K
Nov 12, 2026
DFEM
0.00%
414,000
$ 378.595K
Nov 12, 2026
DFAE
0.00%
306,000
$ 279.831K
Nov 12, 2026
DFAX
0.00%
239,000
$ 218.561K
Nov 12, 2026