(代子公司華新能源電纜系統股份有限公司公告以租地委建廠房工程累積簽約金額
Bull 1
Bear 0
Order/contract
1605.TW
|
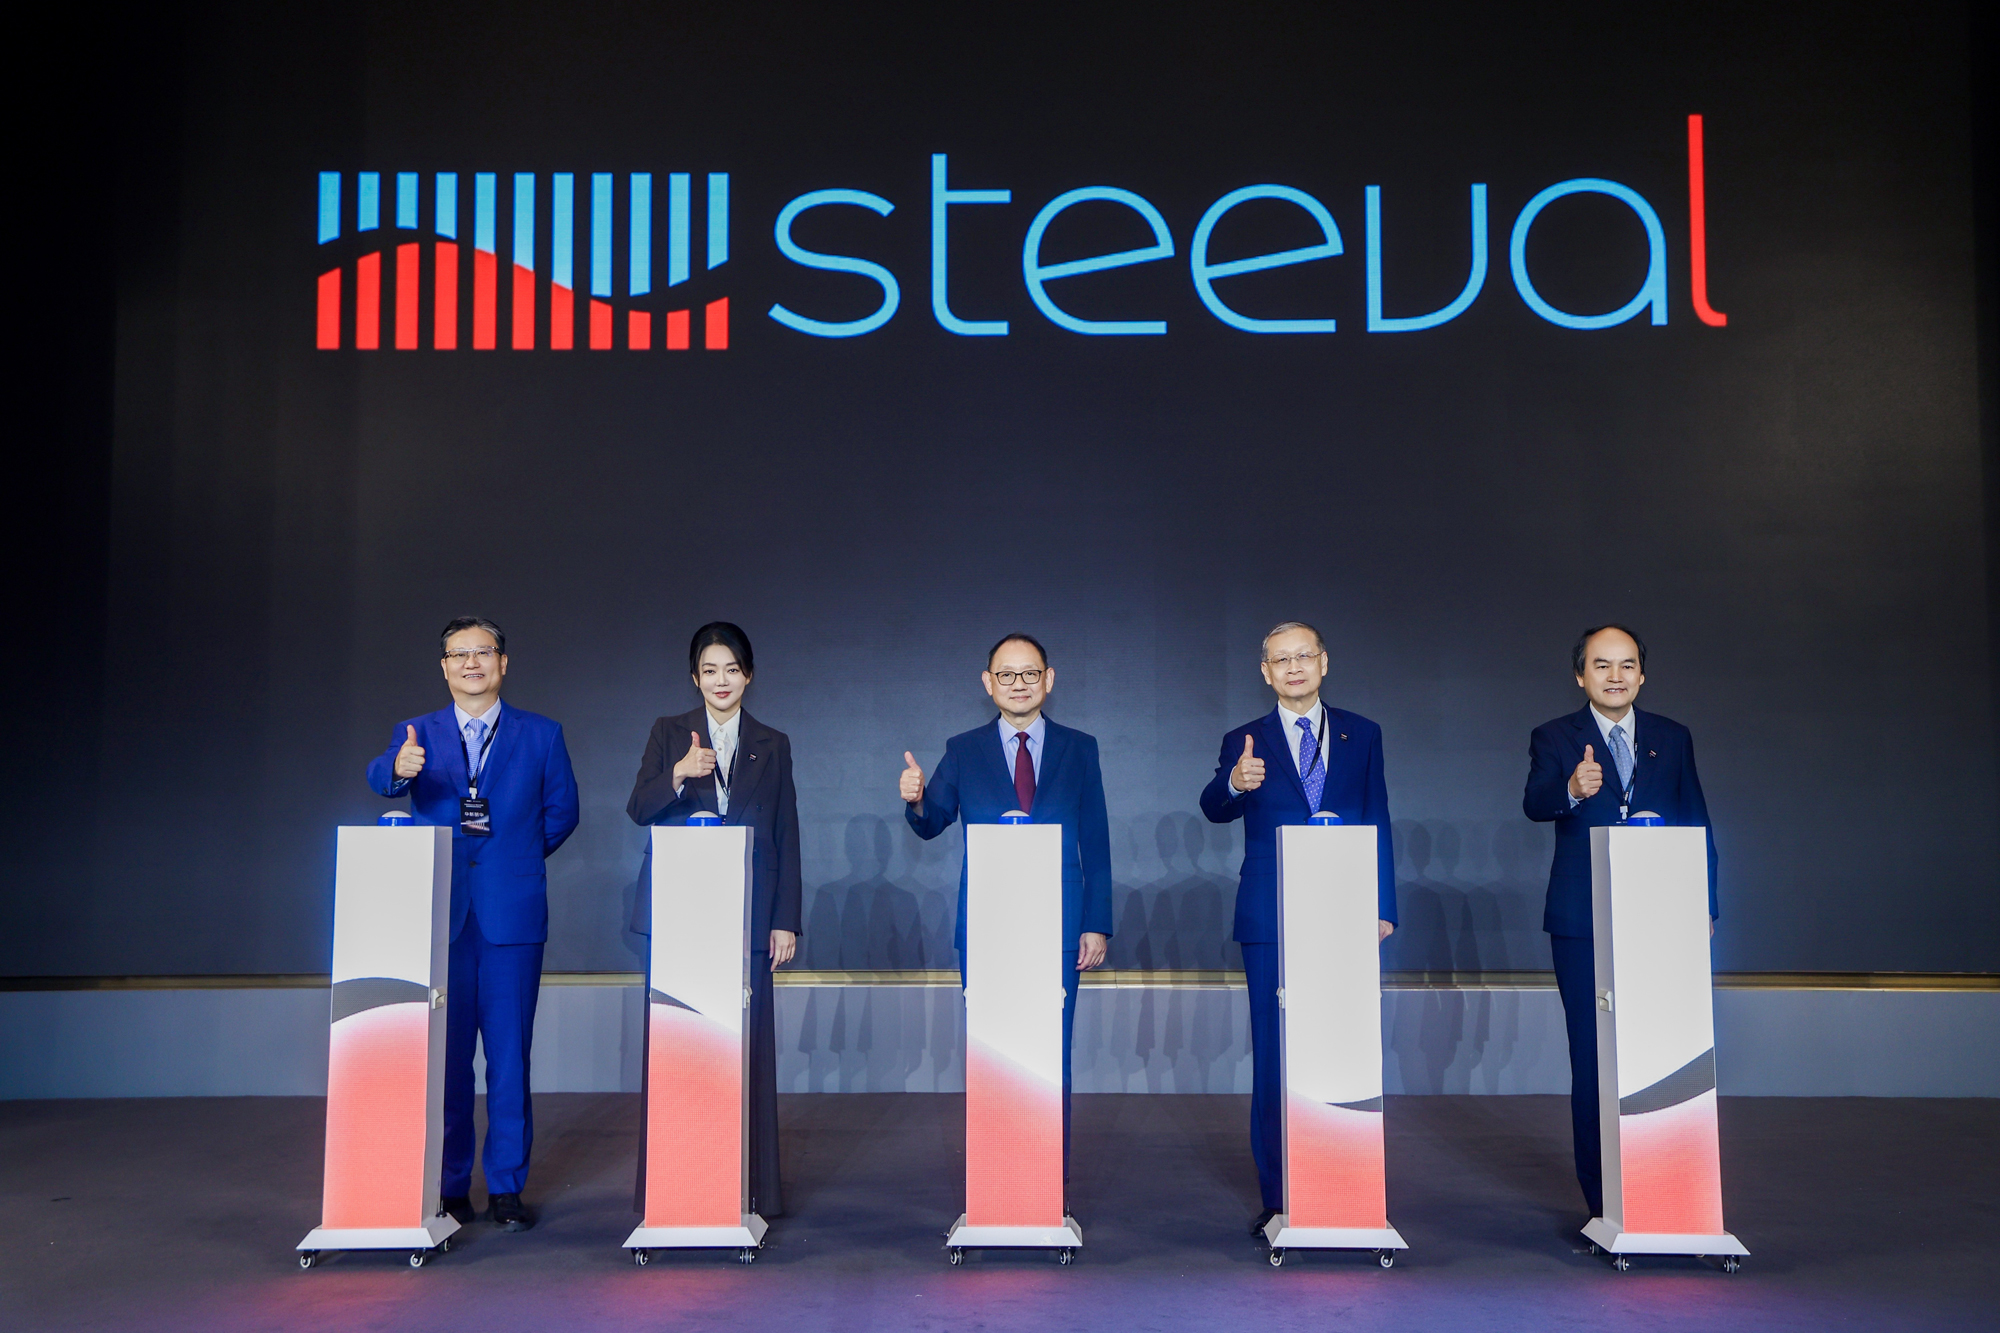
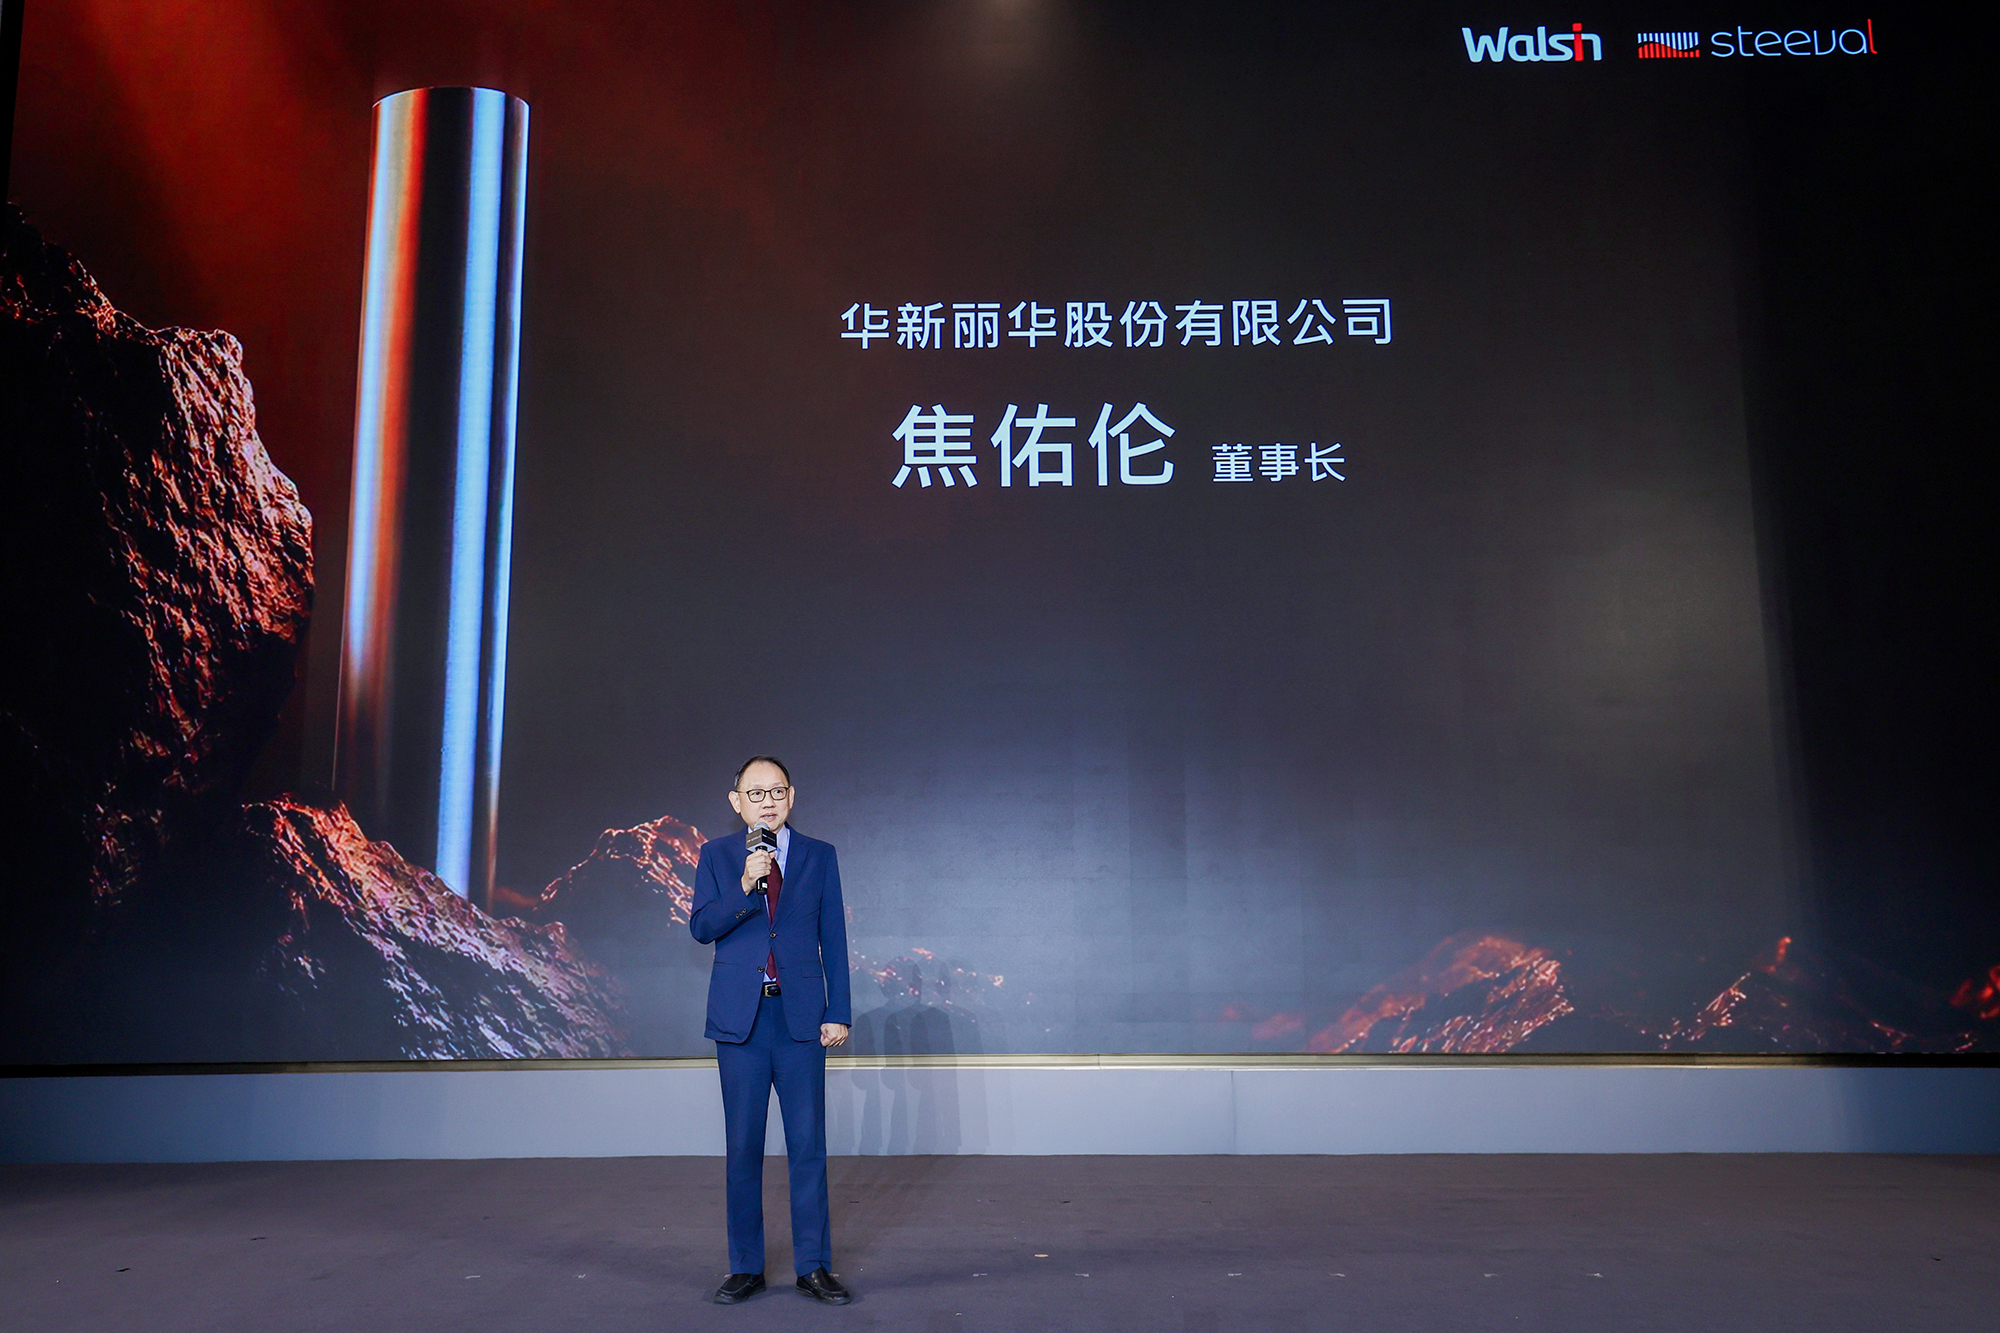
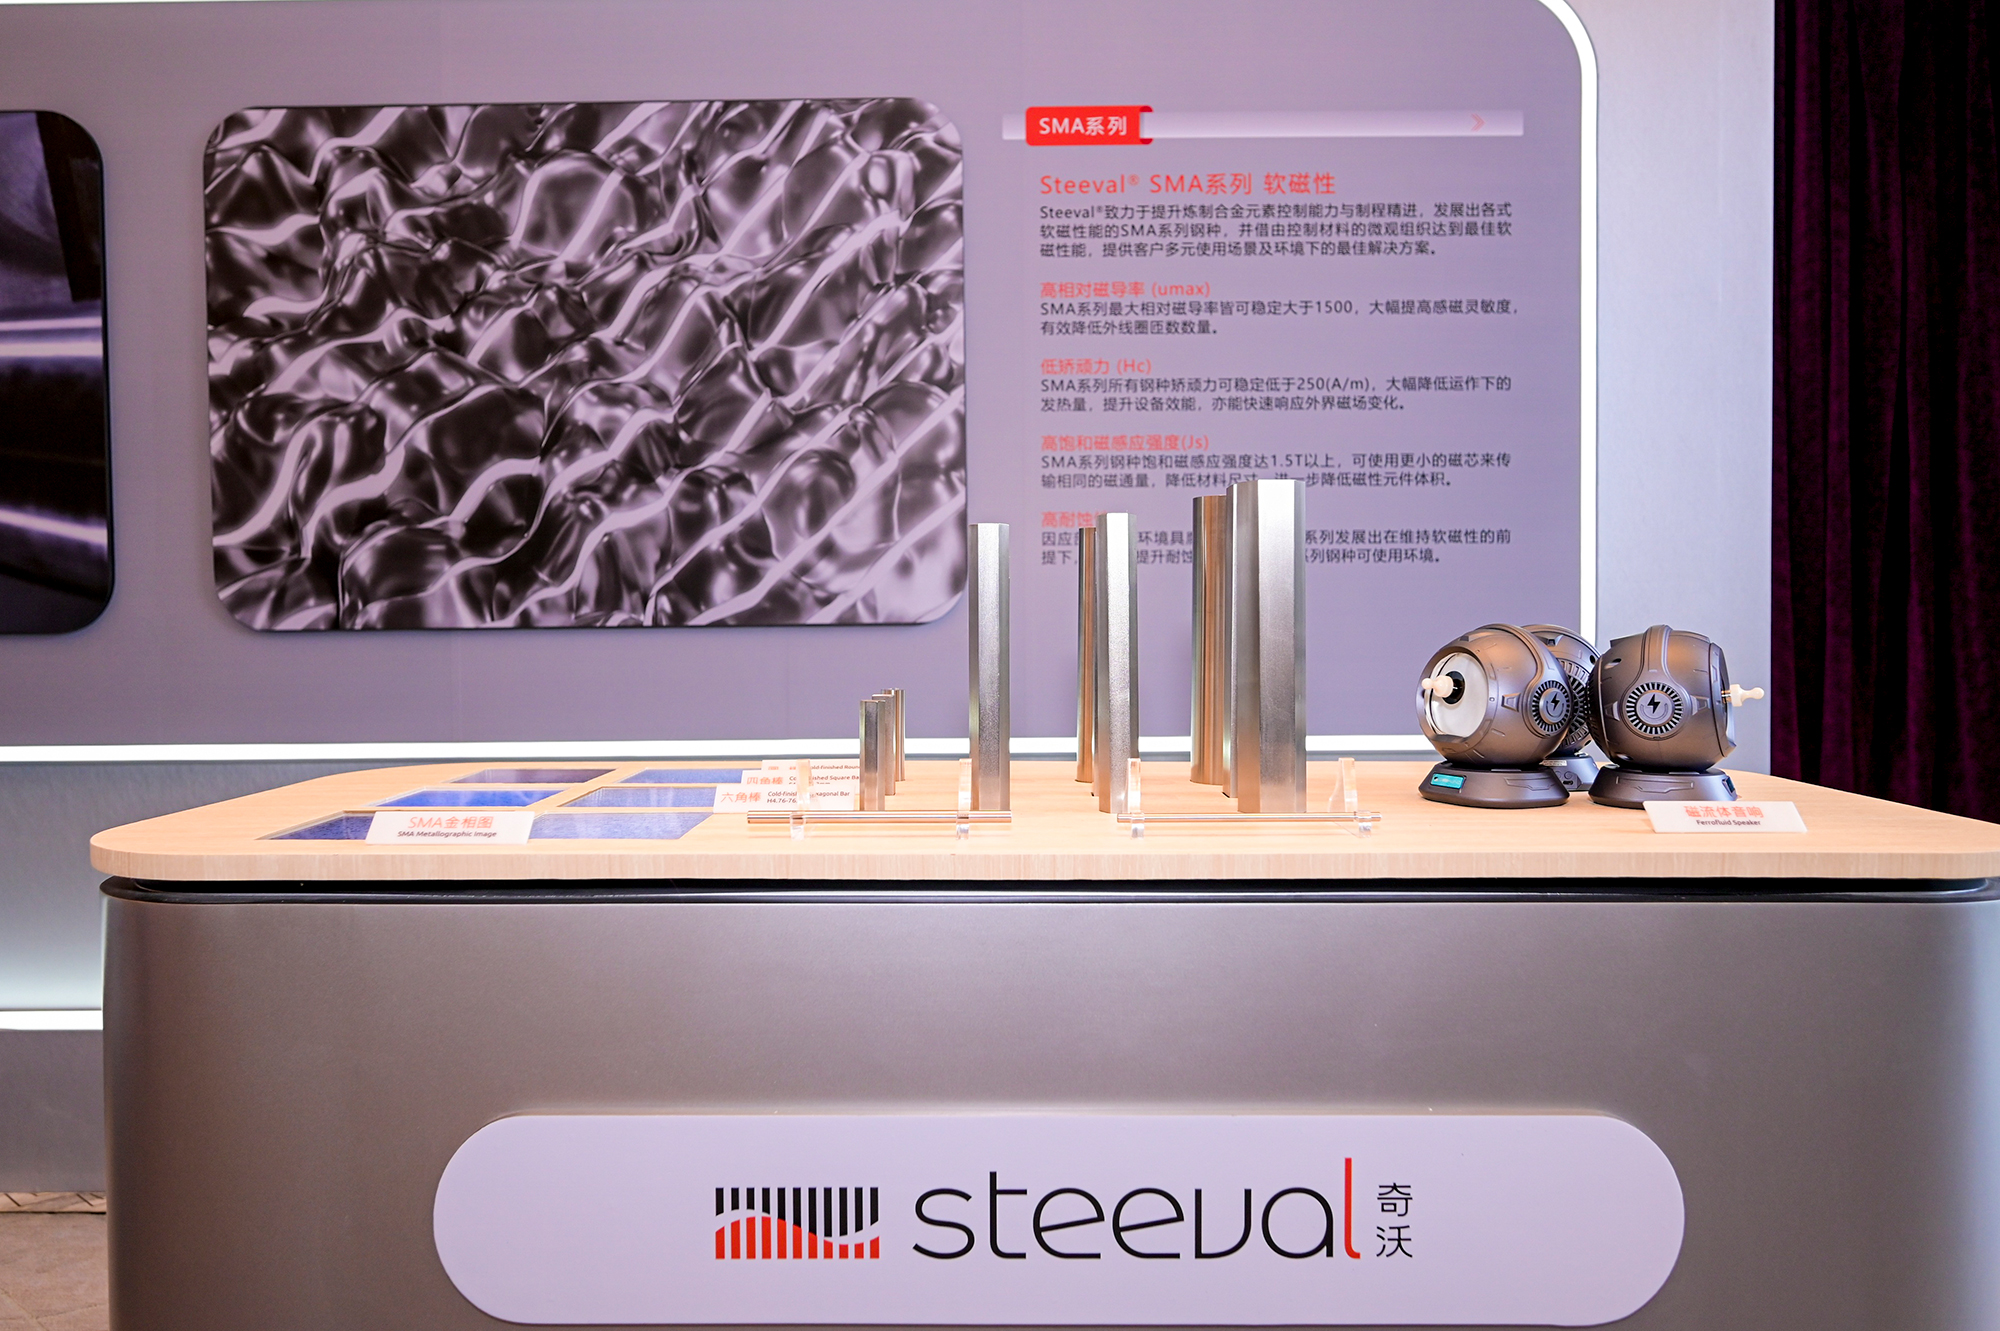
Walsin Lihwa Corporation, founded in 1966, operates in four main business segments: wire and cable, stainless steel, resources, and commercial real estate. The wire and cable division produces copper materials, power, communication, industrial, and submarine cables, serving the energy, transportation, construction, and consumer electronics sectors. The stainless steel segment manufactures billets, wire rods, bars, seamless pipes, and high-nickel alloys, with recent acquisitions expanding its global presence in Europe. The resources division produces nickel pig iron and electrolytic nickel, extending the supply chain for stainless steel and battery materials. The commercial real estate division develops large-scale mixed-use projects in mainland China, including the Huaxin City complex in Nanjing. The company also holds investments in technology subsidiaries, including memory chips, passive components, printed circuit boards, and LCD panels. Walsin Lihwa serves customers across the Greater China region and globally, with production and sales locations in Asia, Europe, and the Americas. Summarised from the company's own disclosures, fiscal year ended Oct 2026 |
Industry Steel | Homepage walsin.com |
| Sector Basic Materials | IR page walsin.com/investors | |
|
Tags
wire and cable, stainless steel, nickel pig iron, submarine cable, passive components, printed circuit boards, memory chips, lcd panels, commercial real estate, industrial materials, Walsin Technology, Unimicron Technology, Unimicron Optoelectronics, Walsin Lihwa, Steeval, Borrego Solar Systems, Walsin Nickel, SMP, AML, Inox, DMV, CAS, NKT, Huaxin City, Huacai Tiandi, Walsin Lihwa (China) Investment Co. Ltd., Walsin Carpenter Special Steel, Walsin Lihwa (Nanjing) Co. Ltd., Walsin Lihwa (Changshu) Co. Ltd., Walsin Lihwa (Yantai) Co. Ltd., Walsin Lihwa (Shanghai) Co. Ltd., Walsin Lihwa (Hangzhou) Co. Ltd., Walsin Lihwa (Jiangyin) Co. Ltd., Walsin Lihwa (Dongguan) Co. Ltd., Walsin Lihwa (Japan) Co. Ltd., Walsin Lihwa (Indonesia) Co. Ltd., Walsin Lihwa (Malaysia) Co. Ltd., Walsin Lihwa (USA) Co. Ltd., Walsin Lihwa (UK) Co. Ltd., Walsin Lihwa (Germany) Co. Ltd., Walsin Lihwa (Italy) Co. Ltd., Walsin Lihwa (Sweden) Co. Ltd.
|
Press page walsin.com/about-us/newsroom |
Metrics
| Valuation | |
|---|---|
| Market cap | NT$ 128.508B |
| Market cap (USD) | $ 3.9B |
| P/E | 5.97 |
| PEG | — |
| P/BV | 0.62 |
| P/S | 0.72 |
| P/OCF | 85.57 |
| P/FCF | — |
| Dividend yield | — |
| Turnover / mcap | — |
| Returns | |
|---|---|
| ROE | 2.1% |
| ROI | 1.9% |
| ROIC | 0.01% |
| Profit margin | 1.8% |
| Growth | |
|---|---|
| Revenue growing | No |
| Profits growing | No |
| Revenue up 3y | No |
| Revenue up 5y | No |
| Earnings growth 3y (net profit CAGR) | -45.2% |
| Quality | |
|---|---|
| Profitable | Yes |
| Margin expanding | No |
| Buying back stock | No |
| Diluting (TTM) | No |
| Debt/Equity | — |
| Podcast bulls (TTM) | Sign up |
| Podcast bears (TTM) | Sign up |
| Podcast sentiment (TTM) | Sign up |
| Podcast sentiment % (TTM) | Sign up |
| News sentiment (TTM) | 0 |
| Quality score | -17.6% |
| Insiders | |
|---|---|
| Buys, 1w | Sign up |
| Buys, 1m | Sign up |
| Buys, 1y | Sign up |
| Sells, 1w | Sign up |
| Sells, 1m | Sign up |
| Sells, 1y | Sign up |
Sign up to see this company's insider trades
| Figure | FY 2025 | FY 2024 | FY 2023 | FY 2022 | FY 2021 | FY 2020 | FY 2019 | FY 2018 | FY 2017 | FY 2016 | FY 2015 | FY 2014 | FY 2013 | FY 2012 | FY 2011 | FY 2010 |
|---|---|---|---|---|---|---|---|---|---|---|---|---|---|---|---|---|
| Revenue | 174.243B | 179.318B | 189.84B | 180.401B | 156.665B | 112.547B | 134.804B | 190.915B | 167.793B | 143.355B | 149.338B | 162.987B | 148.635B | 157.44B | 189.893B | 190.152B |
| Net profit | 3.18B | 2.79B | 5.134B | 19.352B | 14.643B | 6.691B | 3.15B | 11.757B | 6.56B | 4.568B | 1.602B | 2.265B | -2.689B | -3.328B | -4.271B | 4.777B |
| Figure | FY 2025 | FY 2024 | FY 2023 | FY 2022 | FY 2021 | FY 2020 | FY 2019 | FY 2018 | FY 2017 | FY 2016 | FY 2015 | FY 2014 | FY 2013 | FY 2012 | FY 2011 | FY 2010 |
|---|---|---|---|---|---|---|---|---|---|---|---|---|---|---|---|---|
| Share price | 31.8 | 23.7 | 38.65 | 47.2 | 26.5 | 19.3 | — | — | — | — | — | — | — | — | — | — |
| Price performance 12m | 0.34 | -0.39 | -0.18 | 0.78 | 0.37 | — | — | — | — | — | — | — | — | — | — | — |
Sign up to see institutional holdings
Sign UpPodcast Mentions
Sign up to see podcast mentions and sentiment
Sign UpMaterial information published on MOPS, newest first, subjects as filed in Chinese, guarantee and loan balance notices and routine equipment purchases included. The link opens the company's material information on MOPS. Press releases from the company's own website, newest first.
公告董事會解除本公司經理人競業禁止限制
Bull 0
Bear 0
Routine
本公司代子公司華新國際投資有限公司公告資金貸與 情形符合處理準則第二十二條第一項第三款之 內容共1筆
Bull 0
Bear 0
Routine


Prompts
Click prompts to add them under the company line, click again to take one out, then copy the result into your AI chat. Shared by Asian Century Stocks and Uncovered Thai Stocks. Thank you.
Walsin Lihwa Corporation (ticker 1605.TW), listed in Taiwan.
Copied
ETFs Holding Walsin Lihwa Corporation
Exchange-traded funds whose newest published daily portfolio holds one of the company's listings, largest weight first.
| ETF | Weight in ETF | Shares | Market value | As of |
|---|---|---|---|---|
| AVEE | 0.21% | 300,000 | $ 279.501K | Nov 16, 2026 |
| DEXC | 0.07% | 182,175 | $ 183.449K | Nov 12, 2026 |
| DFEV | 0.05% | 1,166,291 | $ 1.174M | Nov 12, 2026 |
| DFEM | 0.05% | 4,077,753 | $ 4.106M | Nov 12, 2026 |
| DFAE | 0.03% | 2,468,626 | $ 2.486M | Nov 12, 2026 |
| AVSE | 0.02% | 40,627 | $ 37.851K | Nov 16, 2026 |
| DFAX | 0.02% | 2,206,803 | $ 2.222M | Nov 12, 2026 |
| AVEM | 0.01% | 3,343,163 | $ 3.115M | Nov 16, 2026 |
| AVXC | 0.01% | 35,825 | $ 33.377K | Nov 16, 2026 |