公告本公司及子公司英屬維京群島商永冠能源材料股份有限公司 台灣分公司與全數債權銀行之債務協商案,業獲全體債權銀行 同意通過
Bull 0
Bear 5
Financing
|
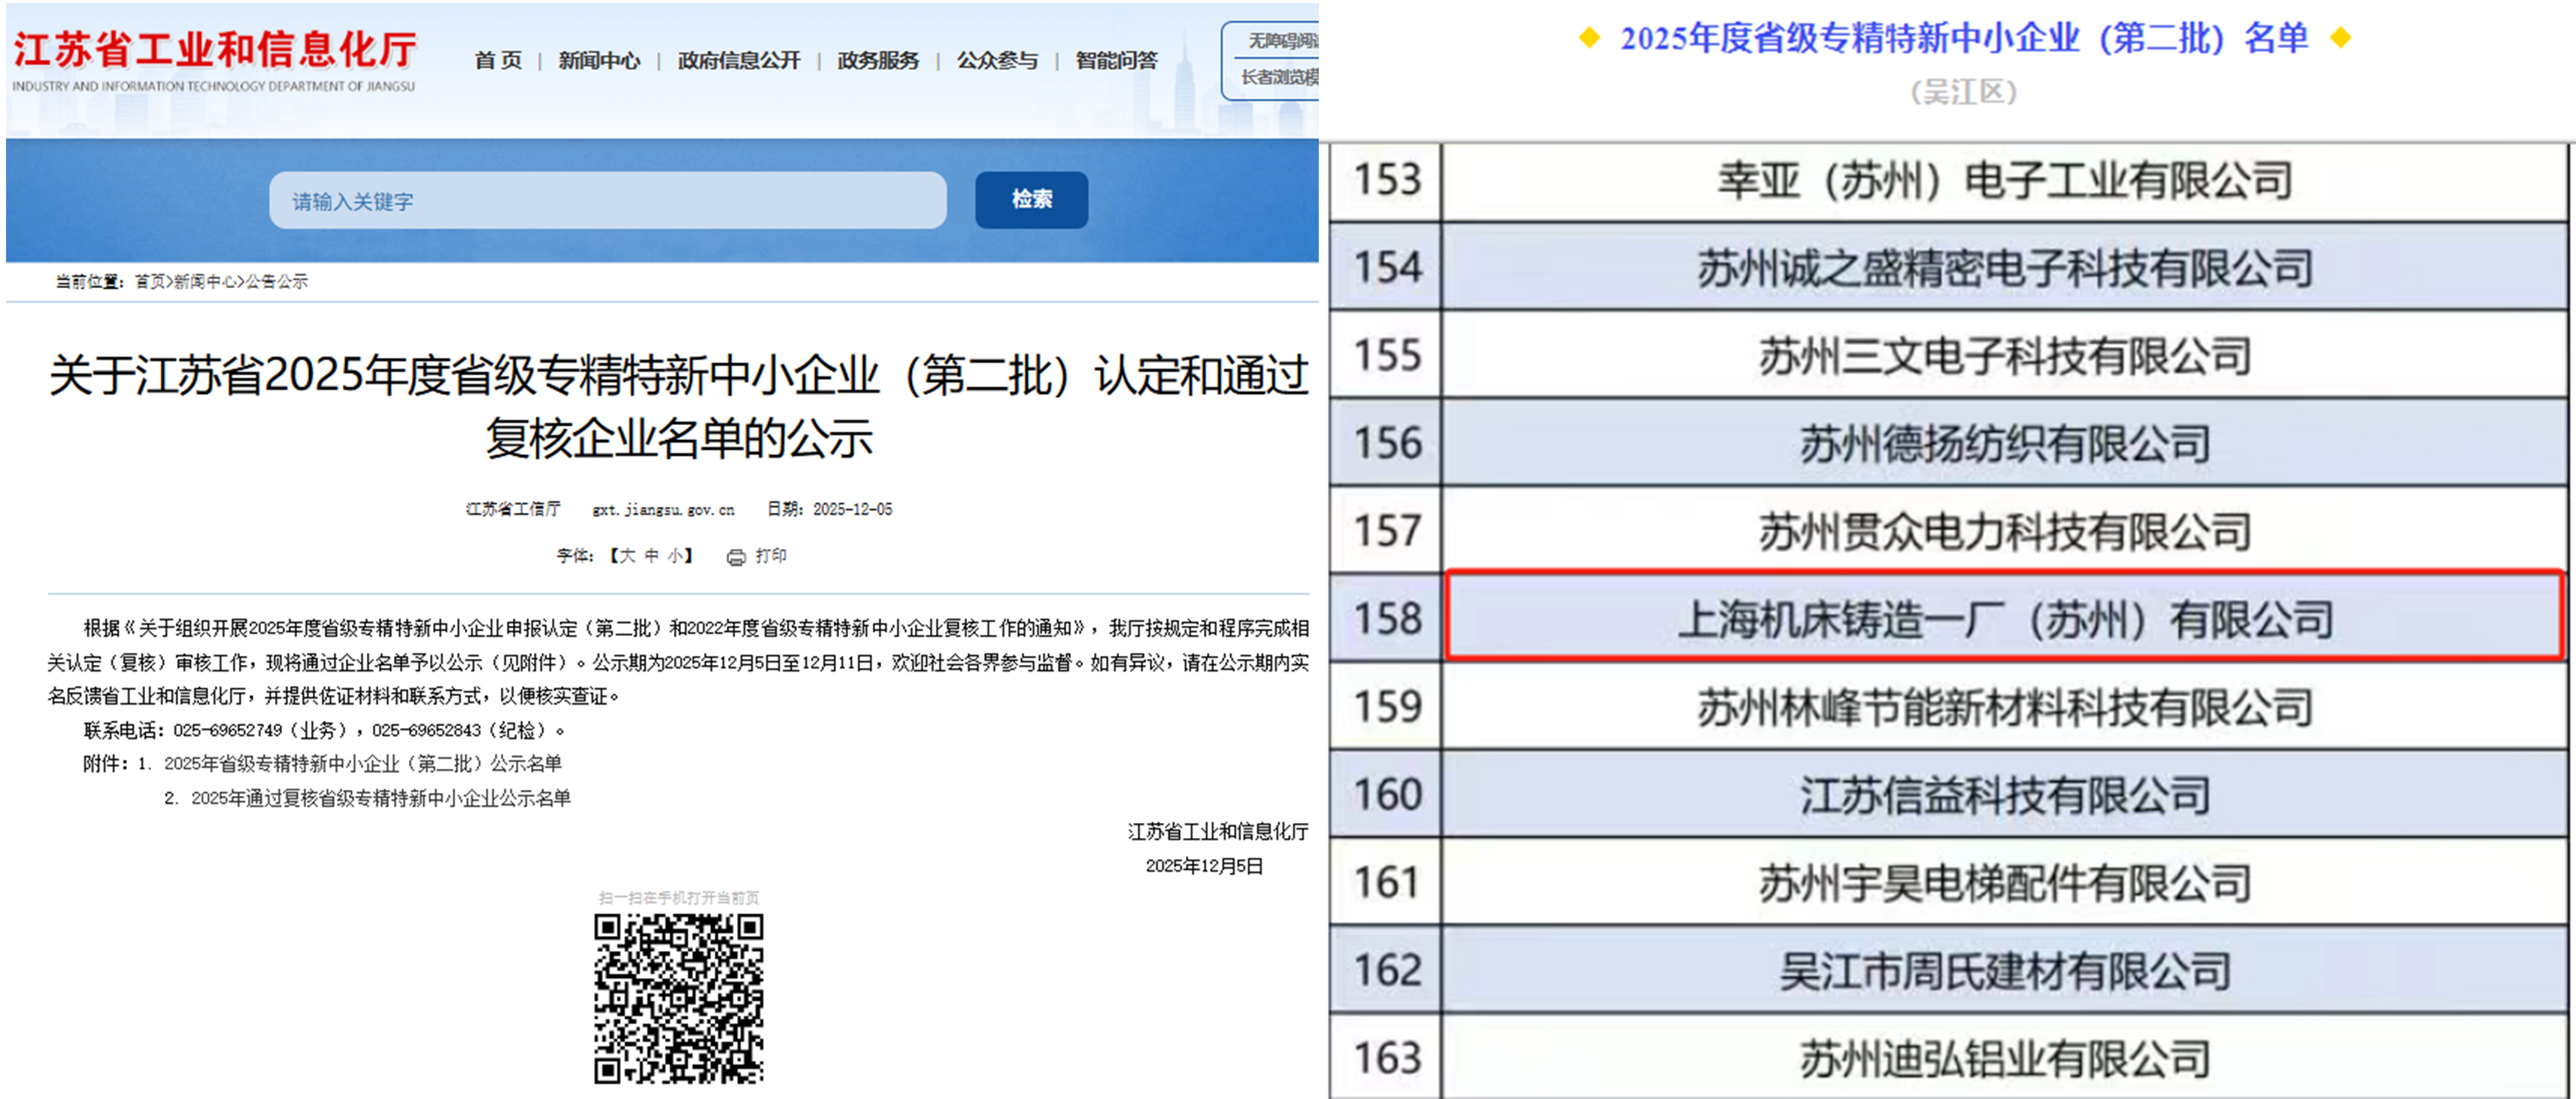
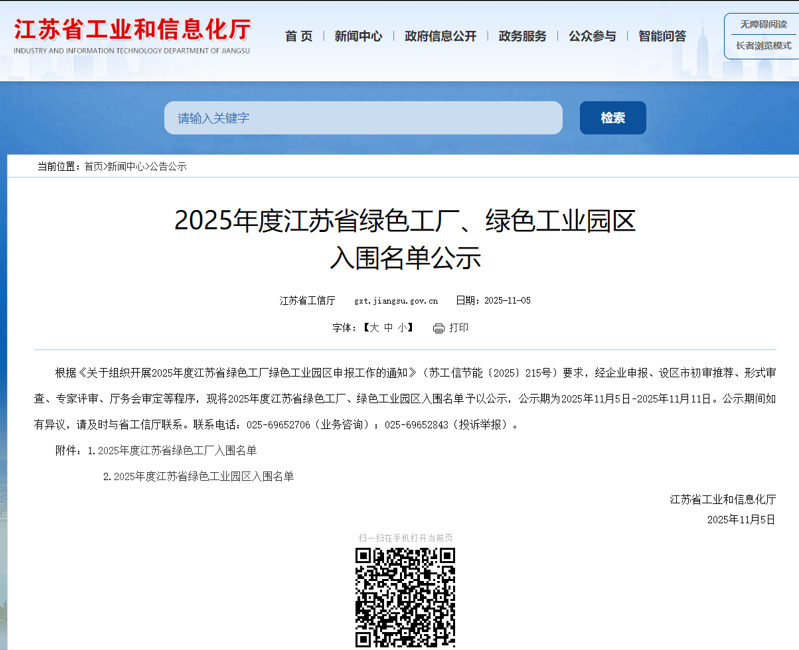
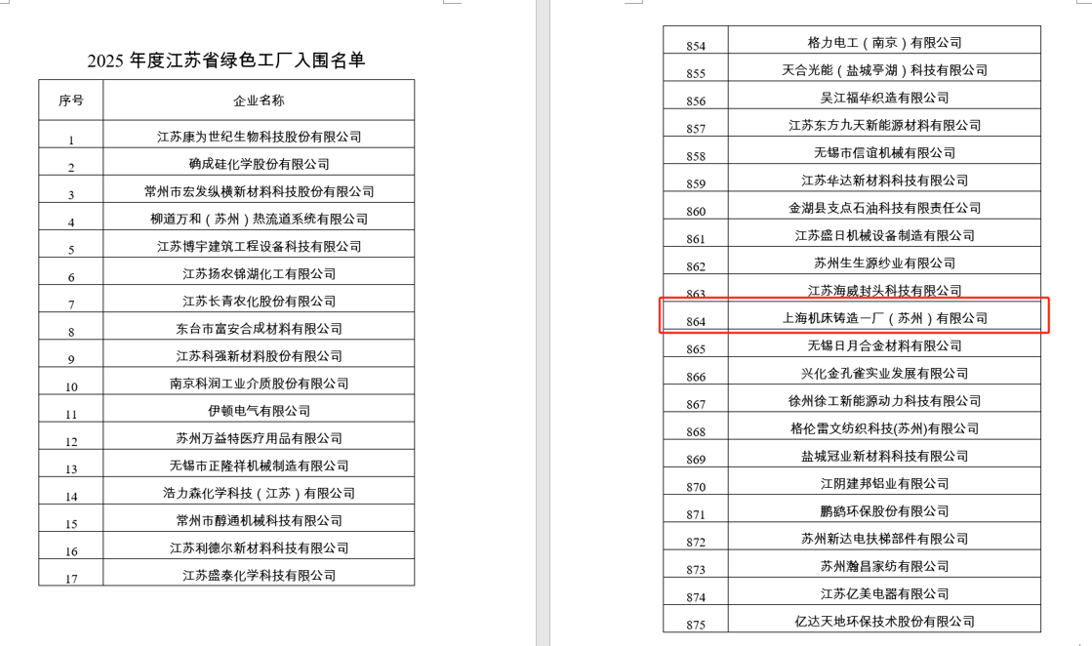
Yeong Guan Energy Technology Group Co., Ltd. is a foundry supplier providing castings for wind turbines, injection molding machines, machine tools, and industrial machinery. The company serves major equipment manufacturers globally, leveraging advanced metallurgical and engineering technologies to produce components with stable delivery times. Its business model includes vertical integration and a focus on high-end equipment manufacturing services. The group operates subsidiaries including Shanghai Machine Tool Casting No.1 (Suzhou) Co., Ltd. and Yeong Guan Heavy Industry (Thailand) Co., Ltd., which support its production capabilities and regional expansion. Summarised from the company's own disclosures, fiscal year ended Oct 2026 |
Industry Building Products & Equipment | Homepage ygget.com |
| Sector Industrials | IR page ygget.com | |
|
Tags
castings, foundry services, wind turbine components, injection molding machine parts, machine tool components, industrial machinery parts, metallurgy, engineering services, Shanghai Machine Tool Casting No.1 (Suzhou) Co. Ltd., Yeong Guan Heavy Industry (Thailand) Co. Ltd.
|
Press page — |
Metrics
| Valuation | |
|---|---|
| Market cap | NT$ 737.626M |
| Market cap (USD) | $ 22.454M |
| P/E | -1.09 |
| PEG | — |
| P/BV | 0.09 |
| P/S | 0.09 |
| P/OCF | -2.68 |
| P/FCF | — |
| Dividend yield | — |
| Turnover / mcap | — |
| Returns | |
|---|---|
| ROE | -7.1% |
| ROI | -3.0% |
| ROIC | -4.3% |
| Profit margin | -8.7% |
| Growth | |
|---|---|
| Revenue growing | No |
| Profits growing | No |
| Revenue up 3y | No |
| Revenue up 5y | No |
| Earnings growth 3y (net profit CAGR) | — |
| Quality | |
|---|---|
| Profitable | No |
| Margin expanding | No |
| Buying back stock | No |
| Diluting (TTM) | Yes |
| Debt/Equity | — |
| Podcast bulls (TTM) | Sign up |
| Podcast bears (TTM) | Sign up |
| Podcast sentiment (TTM) | Sign up |
| Podcast sentiment % (TTM) | Sign up |
| News sentiment (TTM) | 0 |
| Quality score | -75.0% |
| Insiders | |
|---|---|
| Buys, 1w | Sign up |
| Buys, 1m | Sign up |
| Buys, 1y | Sign up |
| Sells, 1w | Sign up |
| Sells, 1m | Sign up |
| Sells, 1y | Sign up |
Sign up to see this company's insider trades
| Figure | FY 2024 | FY 2023 | FY 2022 | FY 2021 | FY 2020 | FY 2019 | FY 2018 | FY 2017 | FY 2016 | FY 2015 | FY 2014 | FY 2013 | FY 2012 | FY 2011 |
|---|---|---|---|---|---|---|---|---|---|---|---|---|---|---|
| Revenue | 7.202B | 8.671B | 9.384B | 8.948B | 8.184B | 7.9B | 6.196B | 6.404B | 7.374B | 8.122B | 7.206B | 5.899B | 5.261B | 5.261B |
| Net profit | -626.317M | -269.74M | -438.462M | 216.102M | 513.143M | 162.976M | -278.658M | 270.474M | 1.008B | 1.351B | 1.002B | 541.119M | 370.385M | 297.537M |
| Figure | FY 2024 | FY 2023 | FY 2022 | FY 2021 | FY 2020 | FY 2019 | FY 2018 | FY 2017 | FY 2016 | FY 2015 | FY 2014 | FY 2013 | FY 2012 | FY 2011 |
|---|---|---|---|---|---|---|---|---|---|---|---|---|---|---|
| Share price | 34.8 | 54 | 56.9 | 63 | 82.4 | — | — | — | — | — | — | — | — | — |
| Price performance 12m | -0.36 | -0.05 | -0.1 | -0.24 | — | — | — | — | — | — | — | — | — | — |
Sign up to see institutional holdings
Sign UpPodcast Mentions
Sign up to see podcast mentions and sentiment
Sign UpMaterial information published on MOPS, newest first, subjects as filed in Chinese, guarantee and loan balance notices and routine equipment purchases included. The link opens the company's material information on MOPS. Press releases from the company's own website, newest first.
本公司未於規定期限內公告申報經會計師核閱之財務報告
Bull 0
Bear 5
Distress
公告說明本公司民國115年2月23日公司債到期尚未償還,本月 現金預算表及前月現金預算執行情形
Bull 0
Bear 7
Distress
 繁體中文
 English
 日本語









Prompts
Click prompts to add them under the company line, click again to take one out, then copy the result into your AI chat. Shared by Asian Century Stocks and Uncovered Thai Stocks. Thank you.
Yeong Guan Energy Technology Group Co., Ltd. (ticker 1589.TW), listed in Taiwan.
Copied
ETFs Holding Yeong Guan Energy Technology Group Co., Ltd.
Exchange-traded funds whose newest published daily portfolio holds one of the company's listings, largest weight first.
| ETF | Weight in ETF | Shares | Market value | As of |
|---|---|---|---|---|
| DFAE | 0.00% | 112,835 | $ 7,118.60 | Nov 12, 2026 |
| DFEM | 0.00% | 94,818 | $ 5,981.94 | Nov 12, 2026 |
| DFAX | 0.00% | 71,486 | $ 4,509.95 | Nov 12, 2026 |
| AVEM | 0.00% | 88,408 | $ 7,433.98 | Nov 16, 2026 |
| AVES | 0.00% | 11,380 | $ 956.91 | Nov 16, 2026 |
| AVSE | 0.00% | 1,135 | $ 95.44 | Nov 16, 2026 |
| AVEE | 0.00% | 1,135 | $ 95.44 | Nov 16, 2026 |