本公司受邀參加櫃買中心舉辦之「櫃買市場業績發表會」
Bull 0
Bear 0
Routine
8234.TWO
|
NEXCOM International Co., Ltd. is an industrial computing solutions provider founded in 1992. The company designs and manufactures embedded systems, single board computers, and rugged industrial PCs for vertical markets including IoT automation, intelligent video surveillance, smart city infrastructure, mobile computing, medical healthcare informatics, and network communication. Key product lines include the PEAK series of single board computers, NISE fanless industrial computers, Neu-X edge AI platforms, and VTC vehicle telematics computers. NEXCOM offers specialized solutions for factory automation, robotics, cybersecurity, and digital healthcare, leveraging open standards for integration. The company operates through six global business units and maintains subsidiaries in China, Italy, Japan, Taiwan, the United States, and the United Kingdom to support regional customers and partners. Summarised from the company's own disclosures, fiscal year ended Oct 2026 |
Industry Computer Hardware | Homepage nexcom.com |
| Sector Technology | IR page nexcom.com/About/InvestorRelations | |
|
Tags
industrial computing, embedded systems, single board computers, edge ai, iot automation, video surveillance, smart city, medical informatics, robotics, cybersecurity, vehicle telematics, factory automation, PEAK, NISE, Neu-X, VTC, eSAF, AIEdge-X, AIBooster, Xcare, NIFE, nDAS, nPAC, CPS, NDiS, SPPC, HPPC, XPPC, OPPC, nROK, aROK, ATC, rROK, eLITE, eSMART, eTOP, IPPC, APPC, APPD, ICES, NEX, EBC, NBP, EBK, NISK, FBI, RTX, USB WhiteList, GreenBase, TMRTEK, DivioTec, NexAIoT, NexCOBOT
|
Press page nexcom.com/News |
Metrics
| Valuation | |
|---|---|
| Market cap | NT$ 6.143B |
| Market cap (USD) | $ 186.461M |
| P/E | 66.92 |
| PEG | — |
| P/BV | 1.96 |
| P/S | 0.99 |
| P/OCF | 60.47 |
| P/FCF | — |
| Dividend yield | — |
| Turnover / mcap | — |
| Returns | |
|---|---|
| ROE | 1.7% |
| ROI | 1.8% |
| ROIC | 1.4% |
| Profit margin | 0.96% |
| Growth | |
|---|---|
| Revenue growing | No |
| Profits growing | No |
| Revenue up 3y | No |
| Revenue up 5y | No |
| Earnings growth 3y (net profit CAGR) | -60.7% |
| Quality | |
|---|---|
| Profitable | Yes |
| Margin expanding | No |
| Buying back stock | No |
| Diluting (TTM) | No |
| Debt/Equity | — |
| Podcast bulls (TTM) | Sign up |
| Podcast bears (TTM) | Sign up |
| Podcast sentiment (TTM) | Sign up |
| Podcast sentiment % (TTM) | Sign up |
| News sentiment (TTM) | 21 |
| Quality score | -56.3% |
| Insiders | |
|---|---|
| Buys, 1w | Sign up |
| Buys, 1m | Sign up |
| Buys, 1y | Sign up |
| Sells, 1w | Sign up |
| Sells, 1m | Sign up |
| Sells, 1y | Sign up |
| Figure | FY 2025 | FY 2024 | FY 2023 | FY 2022 | FY 2021 | FY 2020 | FY 2019 | FY 2018 | FY 2017 | FY 2016 | FY 2015 | FY 2014 | FY 2013 | FY 2012 | FY 2011 | FY 2010 |
|---|---|---|---|---|---|---|---|---|---|---|---|---|---|---|---|---|
| Revenue | 5.702B | 5.421B | 5.766B | 7.917B | 6.781B | 6.702B | 7.213B | 6.638B | 6.364B | 6.106B | 5.508B | 5.386B | 4.172B | 4.184B | 3.555B | 2.901B |
| Net profit | 54.588M | 84.89M | 178.791M | 902.188M | 141.545M | 150.021M | 227.41M | 170.183M | 139.396M | 226.307M | 195.709M | 487.25M | 176.531M | 230.247M | 298.042M | 181.842M |
| Figure | FY 2025 | FY 2024 | FY 2023 | FY 2022 | FY 2021 | FY 2020 | FY 2019 | FY 2018 | FY 2017 | FY 2016 | FY 2015 | FY 2014 | FY 2013 | FY 2012 | FY 2011 | FY 2010 |
|---|---|---|---|---|---|---|---|---|---|---|---|---|---|---|---|---|
| Share price | 71.2 | — | — | — | — | — | — | — | — | — | — | — | — | — | — | — |
| P/S | 1.76 | — | — | — | — | — | — | — | — | — | — | — | — | — | — | — |
Podcast Mentions
Material information published on MOPS, newest first, subjects as filed in Chinese, guarantee and loan balance notices and routine equipment purchases included. The link opens the company's material information on MOPS. Press releases from the company's own website, newest first.
公告本公司處分廠房使用權資產及租賃改良物予關係人
Bull 0
Bear 0
Routine
本公司董事會決議通過115年第三季合併財務報告
Bull 0
Bear 4
Results
本公司董事會通過內部稽核主管委任案
Bull 0
Bear 0
Management
公告本公司董事會通過設置永續長
Bull 0
Bear 0
Management
When the Control Room Needs an Answer: Building the Local Video Node for Centralized Transportation Monitoring
Bull 1
Bear 0
Product/operations
Most Viewed News see more
Physical AI Hits the Factory Floor: Predictive Optimization for Chemical Processes The chemical manufacturing industry is vital to Ta...
Open Innovation Platform Helps Shape the Landscape of IoT Applications The Internet of Things (IoT) inspired numerous app...
Edge Computing Shows IIoT Values with Instant Feedback and Response The heated discussion around Industry 4.0 and smar...
Video see more
2015 Corporate Video The IoT creates unprecedented opportunities in the...2015 Corporate Video  |
October 30, 2026
When the Control Room Needs an Answer: Building the Local Video Node for Centralized Transportation Monitoring
A transportation control room watches countless ordinary moments at once: passengers moving through platforms, vehicles arriving and leaving, staff crossing service areas. Cameras record continuously in the background.
Then one moment matters. An incident is reported. An operator opens the relevant camera, checks the live feed, then jumps back through the timeline to see what happened. Another view may provide context while the rest of the site stays under watch.
The workflow should feel simple: find the camera, find the moment, understand what happened. Behind it, several workloads are running at once. Recording continues. Historical footage is retrieved. Selected streams are decoded for live view and playback. VMS services stay active, and new video keeps arriving.
That makes the local video node more than a recorder. It needs the storage, compute, and expansion capacity to keep these workloads running together. NViS 6712 is built for this role.
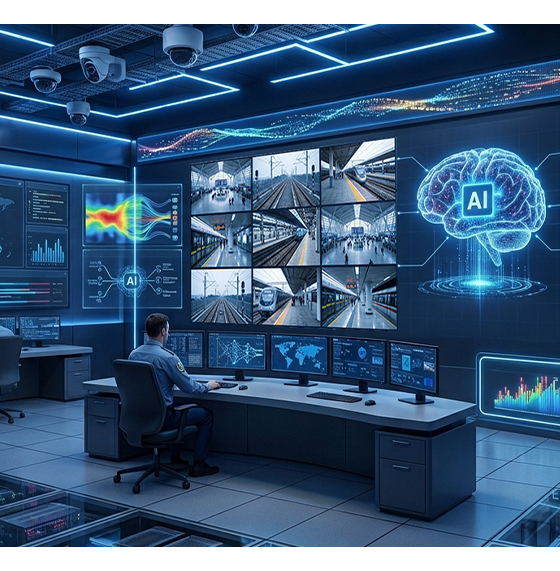
Built for the Control Room
Investigate an Incident While Recording Continues
A report comes in from a busy station platform. The operator locates the relevant camera, checks the live view, then moves back through the recording to identify when the incident began. A second camera reveals what happened from another angle. At the same time, other operators may be reviewing separate events, and cameras across the station continue recording.
These overlapping activities place demands on the local video infrastructure. NViS 6712 combines 12 × 3.5-inch HDD bays for high-volume video storage with two M.2 2280 NVMe SSD slots and an additional M.2 SATA SSD slot for system and application data. This gives system integrators dedicated storage options for continuous video archives and active application workloads.
Powered by Intel® Core™ Series 2 processors with up to 12 P-cores, 24 threads, 5.9 GHz Turbo, 36MB L3 cache, and 64GB DDR5 memory, the platform provides the computing resources for VMS services, footage retrieval, playback, and other application processing alongside ongoing recording.
For operators, the objective is practical: review the footage they need without interrupting the recording work happening across the station.
Retrieve Footage When Questions Arise Later
Not every incident is reported immediately. A passenger may contact station management days after losing a personal belonging, or an operations team may need to reconstruct the sequence of events behind a service disruption. The operator must locate the correct camera, return to the reported time, and review the available footage to establish what happened.
Whether that footage is still available depends on how the video archive was planned. A busy platform with multiple high-resolution cameras may generate considerably more data than a service corridor, while different recording schedules and retention policies further affect storage requirements.
With 12 HDD bays supporting up to 312TB of raw JBOD capacity, NViS 6712 provides a high-capacity foundation for local video retention. System integrators can size the storage configuration around actual recording profiles, including camera count, resolution, frame rate, codec, bitrate, recording schedule, and retention period, while accounting for storage protection and system overhead.
For the control room, effective retention planning supports a fundamental investigative need: the ability to return to the relevant footage when questions arise, even days after an event.
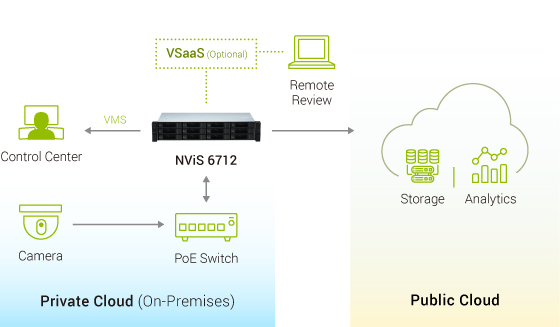
Extend Selected Video Services Beyond the Site
Transportation operations may span multiple stations, terminals, or facilities. In a hybrid VMS or VSaaS architecture, high-volume recording and retention can remain local while selected services—such as remote access, alerts, metadata management, event clips, and multi-site management—extend centrally.
NViS 6712 provides the local recording, storage, and compute foundation, while the selected VMS or VSaaS software manages authentication, remote access, notifications, and cross-site coordination.
Dual 2.5GbE interfaces provide base network connectivity, with PCIe expansion available for projects that require additional networking options. This keeps the high-volume video workload close to the site while extending the information and services that benefit from wider access.
For a broader look at this local-versus-central design approach, see Hybrid Cloud Video Surveillance Architecture: What Stays Local and What Moves to the Cloud .
Different Sites, Different Surveillance Needs
A busy transit interchange and a smaller commuter station may use the same video platform, but their operational priorities can differ.
At a major transportation hub, cameras continuously capture activity across platforms, entrances, and service areas. When an incident is reported days later, operators need access to the historical footage. For deployments where recording volume and retention are the primary concerns, NViS 6712 can be configured with capacity-oriented JBOD storage. When critical footage also needs protection against selected drive failures, a validated hardware RAID configuration can add an extra layer of storage resilience.
Other locations may need more intelligence at the edge. At a crowded interchange, for example, video analytics could help identify growing congestion near ticket gates or platform entrances. NViS 6712 offers PCIe and M.2 expansion options for compatible AI accelerators, while analytics can be deployed in cameras, on the local server, on dedicated AI nodes, or centrally, depending on application requirements.
Ultimately, the right configuration depends on what each site needs to capture, preserve, and understand.
Keep the Control Room Ready for What Comes Next
When an incident draws attention to one platform, the rest of the station keeps moving. Operators must locate the right cameras, review earlier footage, and compare multiple views while recording continues across the site. To support these concurrent workloads, NViS 6712 by NEXCOM Smart Vision (GreenBase Technology Co., Ltd.) brings together high-capacity local storage, P-core-only processing, fast SSD storage options, and flexible expansion in a 2U platform.
For transportation hubs and multi-site operations, system integrators can tailor the platform to each site's recording, retention, and processing requirements, while compatible VMS or VSaaS software extends selected services across locations.
Because in a control room, understanding what happened should never come at the expense of seeing what happens next. Explore NViS 6712 now.
-
Related Links:
-
Hybrid Cloud Video Surveillance Architecture: What Stays Local and What Moves to the Cloud
-
Browse Other News:
-
Before the Numbers Could Talk: Verifying Energy Savings at a Water Treatment Plant
Committed to Customer Success ©2011-2023 NEXCOM International Co., Ltd. All Rights Reserved. Cookie Privacy Sitemap

Take a minute and tell us what you think!
NEXCOM Introduces RoboWIZ AI Robotics Platform at GTC Berlin
Bull 2
Bear 0
Product/operations
Most Viewed News see more
Physical AI Hits the Factory Floor: Predictive Optimization for Chemical Processes The chemical manufacturing industry is vital to Ta...
Open Innovation Platform Helps Shape the Landscape of IoT Applications The Internet of Things (IoT) inspired numerous app...
Edge Computing Shows IIoT Values with Instant Feedback and Response The heated discussion around Industry 4.0 and smar...
October 22, 2026
NEXCOM Introduces RoboWIZ AI Robotics Platform at GTC Berlin
BERLIN, Germany – NEXCOM and its robotics subsidiary NexCOBOT will present the RoboWIZ AI Robotics Platform to an international audience at NVIDIA GTC Berlin, October 20–22, 2026.
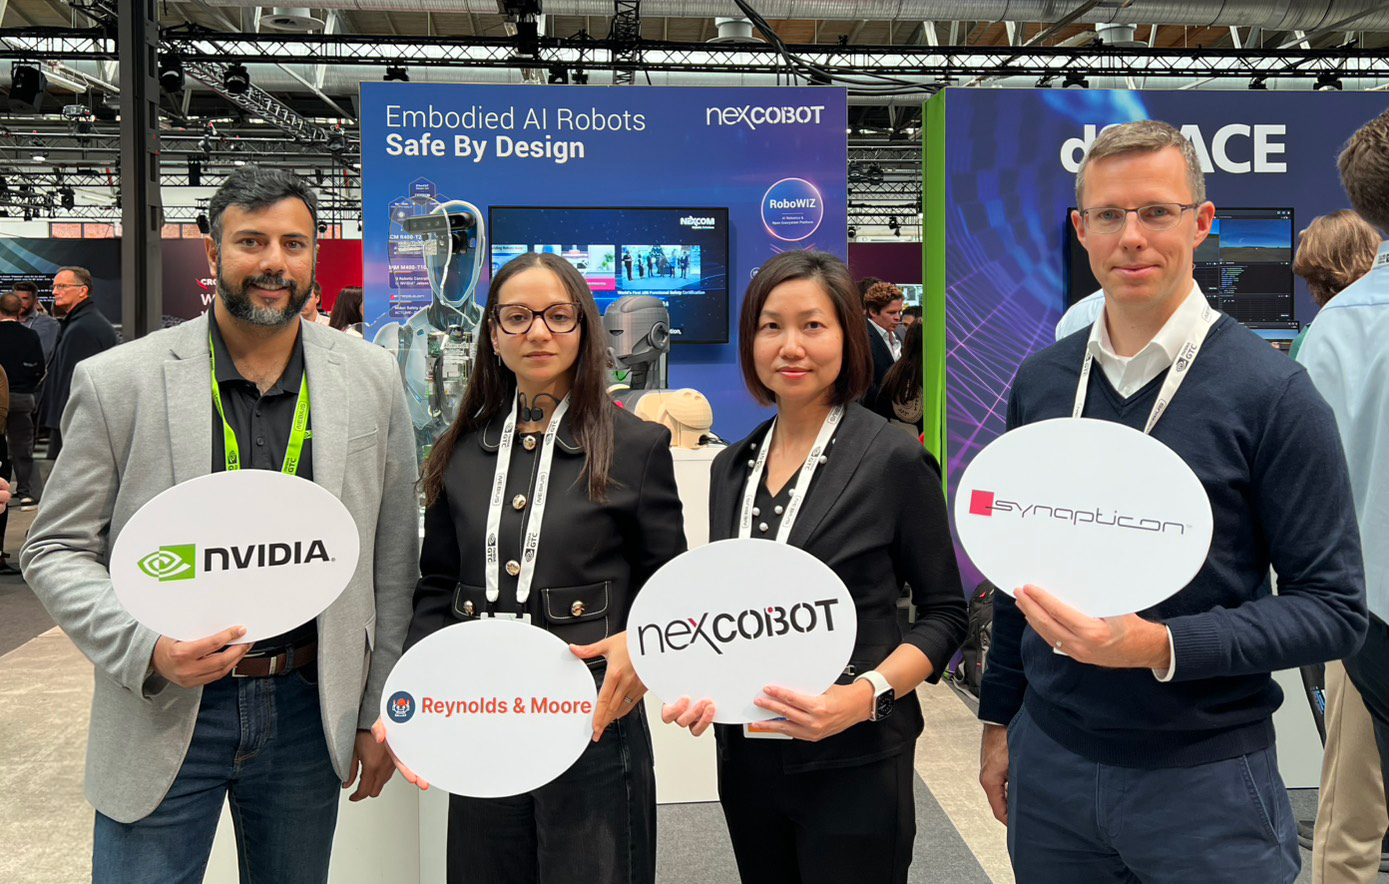
(From left to right are Thejas Gupta Shivashankar, Head of BD & Partner Ecosystem at NVIDIA, Ferdaousse Ziari, Director Of Engineering (Europe) at Reynolds and Moore, Jenny Shern, General Manager of NEXCOM Robotic Solutions (NexCOBOT), Dr. Florian Weisshardt, Head of Synapticon Intelligence)
RoboWIZ is an open ecosystem for AI robot development that connecting NexCOBOT controllers with components, software and engineering services from robotics technology partners. The platform simplifies the integration of AI computing, cameras and sensors, real-time motion control, drives and actuators, functional safety, cybersecurity, and application software into working robots.
NEXCOM first introduced RoboWIZ at Automation Taipei in Taiwan in August 2026, demonstrating humanoid, quadruped and dual-arm robot applications developed with ecosystem partners. At GTC Berlin, NEXCOM will highlight partners RealSense, Stereolabs, Synapticon and Reynolds & Moore, together with its robotics platform based on NVIDIA IGX Thor.
RoboWIZ Brings Five Robot Technologies Into One Development Ecosystem
RoboWIZ covers five areas of robot development: AI core control, functional safety and cybersecurity, visual perception, real-time control, and actuation and robot systems.
The AI control layer supports computing platforms from NVIDIA, Intel and Qualcomm. Other components of the ecosystem include joints, drives, grippers and dexterous hands, cameras and sensors, communication modules and robotics software.
RoboWIZ does not define a single robot configuration. Instead, developers can select technologies according to the robot and application they are building. Through the RoboWIZ partner programme, technology suppliers can integrate their products with NexCOBOT AI controllers, adding further hardware and software options to the ecosystem.
This approach enables the same development framework to be used for different types of robot, including humanoids, quadrupeds, mobile manipulators, collaborative robots and autonomous mobile robots.
"There is no one-size-fits-all safety architecture for robotics. The right approach depends on the robot, its intended use, operating environment, hazards, and required risk reduction. As one of the early adopters of IGX Thor, NexCOBOT addresses this challenge with the MARS400 T20. It combines AI, motion control, and functional safety into one platform with T5000 specs and 8 GMSL camera inputs, providing developers high-performance processing power and a flexible, practical foundation for safety by design, system integration, and validation," said Paul Schmitt, CTO of Reynolds & Moore.
Four Partners Extend RoboWIZ Across Perception, Motion and Safety
At GTC Berlin, NEXCOM will showcase four RoboWIZ partners that contribute to various aspects of robot architecture.
RealSense provides depth-sensing cameras and computer-vision technology for robotic perception, supporting functions such as navigation, spatial awareness and manipulation.
Stereolabs provides ZED stereo-vision cameras and 3D perception software. NEXCOM and Stereolabs have previously worked together on integrating ZED cameras and software with NEXCOM edge AI systems for robotics and industrial applications.
Synapticon provides EtherCAT-based servo-drive, motion-control and functional-safety technology for robot joints and actuators. Its SOMANET drive technology combines motor control, communications and safety functions in compact drive modules.
Reynolds & Moore provides functional-safety engineering services, including risk assessment, safety-system design, validation support and assistance with certification. Its engineering services complement the hardware and software used to develop robot control systems.
The four partners illustrate how RoboWIZ extends beyond the central robot controller to technologies and engineering services needed elsewhere in the system.
NEXCOM Brings Its NVIDIA IGX Thor Robotics Platform to GTC Berlin
NEXCOM will also showcase its robotics platform based on NVIDIA IGX Thor.
The company introduced the **MARS400 T20 ** based on NVIDIA IGX Thor at NVIDIA GTC in San Jose in March 2026. The system combines NVIDIA Blackwell AI computing with NEXCOM technologies for real-time motion control, functional safety and cybersecurity.
The IGX Thor-based platform addresses the control side of advanced robot development, where AI computing must operate alongside deterministic motion control and safety functions. At GTC Berlin, NEXCOM will showcase the platform as part of its comprehensive RoboWIZ robotics portfolio.
NEXCOM will present the RoboWIZ AI Robotics Platform at Booth 7040.
-
Related Links:
-
Browse Other News:
-
Smarter Warehouse & Logistics Inspection Starts at the Edge with NDiS B340
-
NEXCOM Introduces RoboWIZ AI Robotics Platform at GTC Berlin
Committed to Customer Success ©2011-2023 NEXCOM International Co., Ltd. All Rights Reserved. Cookie Privacy Sitemap
Take a minute and tell us what you think!
-
eSAF Cybersecurity Platform
-
Industrial Fanless Computer
Cabinet Mount Controller Fanless PC CMC 300-F0x CMC 300-F13 CMC 300-F2x

Atom™ Compact NISE 105 NISE 105U NISE 106-N3710 NISE 107 NISE 107-E3940 NISE 108 NISE 109-E01/E02 NISE 110-A01/A02 NISE 50 A04-01 NISE 50 A04-02 NISE 50 A04-03 NISE 50 A04-04 NISE 505 NISE 50-J1900 NISE 51 NISE 51-J3455 NISE 52 NISE 53-E01/E02 NISE 70
Core™-i Performance NISE 3000 C30-E
 NISE 3000 C30-E2/P2E
NISE 3000 C30-R
NISE 3000 C31-E2/P2E/E16
NISE 3600CE
NISE 3600CE2/P2/P2E
NISE 3700E
NISE 3700E2/P2/P2E
NISE 3900E
NISE 3900E2/P2/P2E
NISE 3900E-H310
NISE 3900R
NISE 3910E
NISE 3910E16/E2/P2/P2E
NISE 3910R
NISE 4310-E01
TT 300-A0Q
TT 300-A2Q/A3Q
TT 300-F00
TT 300-F30
-
Industrial Rackmount Computer
PICMG 1.0/1.3 SBC PEAK 887VL2 PEAK 888VL2 PEAK 889VL2 PEAK 890VL2 PEAK 980/980-H
PICMG 1.0/1.3 BackPlane NBP 0513 NBP 0522 NBP 0641 NBP 06E5 NBP 06P2 NBP 1024 NBP 1052 NBP 1257 NBP 142A0-CX NBP 14570-BX NBP 14570-CX NBP 1465 NBP 14670 NBP 1468 NBP 14880 NBP 2U040 NBP 2U220
Industrial Motherboard NEX 812 NEX 813 NEX 816 NEX 818 NEX 912P NEX 913 NEX 913C NEX 916 NEX 918 NEX 919
-
Embedded Computing
3.5'' / 5.25'' SBC EBC 260 EBC 355A EBC 355U Series EBC 355XP EBC 356 EBC 357 EBC 357X EBC 358 EBC 358X EBC 370/EBC 370X EBC359
Mini-ITX MB NEX 618 NEX 619 NEX 650-ADU
Computer-on-Module ICES 620-HCAD1-USB ICES 620X ICES 674 ICES 675 ICES 675S
-
Panel PC
Human Machine Interface eLITE610 eSMART04 eSMART07M eSMART10 eTOP504 eTOP507 eTOP510
Industrial Panel PC/ Monitor IPPC 1040P IPPC 1050P IPPC 1611-C11 IPPC 1640P IPPC 1650P IPPC 1660-A11 IPPC 1680P IPPC 1850P IPPC 1880P IPPC 2111-C11 IPPC 2140P IPPC 2150P IPPC 2160-A11 IPPC 2180P IPPC 2411-C11 IPPC 2460-A11
Applied Panel PC/ Monitor APPC 0760-A01
APPC 0760-A02
APPC 0760-A04
APPC 1060-A01
APPC 1060-A02
APPC 1060-A04
APPC 1240C-B01
APPC 1245T
APPC 1250T
APPC 1260T-A01
APPC 1540C-B01
APPC 1540T
APPC 1550T
APPC 1560-A01
APPC 1660-A01
APPC 1740C-B01
APPC 1740T
APPC 1750T
APPC 1760-A01
APPC 1940C-B01
APPC 1940T
APPC 1950T
APPC 1960-A01
APPC 2160-A01
APPC 3154
APPC160 C21-01
APPC210 C21-01
APPD 1200-1
APPD 1200-2
APPD 1500-1
APPD 1500-2
APPD 1600-2
APPD 1700-1
APPD 1700-2
APPD 1900-1
APPD 1900-2
APPD 2100-2 -
PC-based Factory Automation
miniPCIe Module - COM NISKECOM3 NISKECOM4 NISKLPT
miniPCIe Modules - Fieldbus FBI90E-COM FBI90E-DNM FBI90E-PBM FBI90E-REM NISKNVRAM
miniPCIe Module - I/O NISKDIO-8I8O
industrial Fieldbus Computer NIFE 106-A01 NIFE 106-A02 NIFE 200 NIFE 200P2/E2/P2E NIFE 200S NIFE210-E01/E02 NIFE210-E11/E12
-
Software Solution
IntervalZero RTX - RTOS RTX 2012 RTX64 2013
USB WhiteList USB WhiteList 1.0
Professional Software Service – BIOS, Bootloader, Kernel, eAPI, Driver & Embedded OS/BSP ProfessionalSoftware Service
-
Machine Automation
-
IoT Solutions
Arm-based HMI nHMI-07L nHMI-10M
Remote Data Acquisition System nDAS 6000 Series
-
Marine Computer
-
Slow Moving Embedded Boards
Slow moving embedded boards ICES 620-HCAD3 NEX 650-ADU NEX 812 NEX 813 NEX 885 NEX 910 NEX 913 NEX 980 PEAK 877VL2
-
Environment and Energy Solutions
Environment and Energy Solutions
Industrial IoT Data Acquisition System RN-30-EG01 RN-30-ND01/02
-
Duro Edge Computer
Accessories DockInfinity-2R8
DockInfinity-2S
DockInfinity-E4X1
DockInfinity-R16F
Compat ARM® NDiS B115 (EOL) NDiS B116 (EOL) NDiS B117
Compact Celeron® NDiS B327(EOL) NDiS B336R(EOL) NDiS B337 (EOL) NDiS B338 NDiS B338-LITE NDiS B339 NDiS B340 Series
Multi-display Computing System NDiS V1000 NDiS V1100
Energy Saver Core™ U NDiS B360 NDiS B361 NDiS B362 NDiS B363 NDiS B364
Hi-Power Core™ NDiS B535 (EOL) NDiS B537 (EOL) NDiS B560 (EOL) NDiS B560-Q (EOL) NDiS B560S (EOL) NDiS B560S-H (EOL) NDiS B561/B561-PoE NDiS B561S NDiS B562 Series NDiS B562-Q Series
-
Embedded Touchscreen Computer
Slim Touchscreen Computer (SPPC Intel® Celeron®) SPPC 16-10N150
High Brightness Touchscreen Computer (HPPC Intel Celeron®) HPPC 12-10X7211 HPPC 15-10X7211
Wide Touchscreen Computer (XPPC Intel® Core™) XPPC 10-200 XPPC 16-200 XPPC 16-201 XPPC 24-200A
Wide Touchscreen Computer (XPPC Intel® Celeron®) XPPC 10-100 (EOL) XPPC 10-100-Ag+ (EOL) XPPC 10-10N97 XPPC 16-100 (EOL) XPPC 16-101 (EOL) XPPC 16-105N150
XPPC 16-105N97
XPPC 16-10N97
XPPC 22-100A (EOL)
XPPC 24-100A (EOL)
XPPC 24-10N97A
4:3 Open Frame Panel PC (OPPC) OPPC 1240T OPPC 1540HT-J1900 OPPC 1540TSeries OPPC 1740T OPPC 1940HT-J1900 OPPC 1940TSeries
-
Edge AI Computer
NVIDIA Solution AIEdge-X®300 AIEdge-X®300-RTX30 AIEdge-X®310 AIEdge-X®500 AIEdge-X®80 AIEdge-X®80-NA AIEdge-X®80-NX-S
Google Coral Solution AIEdge-X®100 AIEdge-X®537 NISE 3800E-GCIoT NISE 50-GCIoT
Intel Movidius Solution AIEdge-X®100-VPU AIEdge-X®300-VPU AIEdge-X®500 AIEdge-X®537-VPU
-
Edge Computing System
Neu-X3 Core™ Series Neu-X1025-N305 Neu-X102-i3 Neu-X1045-N355 Neu-X104-i3 Neu-X302 Neu-X303 Neu-X303mini Neu-X304
Neu-X1 Atom® Series Neu-X100 Neu-X101 Neu-X101-6C-DC Neu-X1025-N50 Neu-X1025-N97 Neu-X102-N50 Neu-X102-N97 Neu-X1045-N150 Neu-X104-N150 Neu-X60 Neu-XE102-N50-4C Neu-XE102-N97-14C2S Neu-XE102-N97-6C2S Neu-XE104-N150-14C2S Neu-XE104-N150-6C2S Neu-XE105-N50-12U
-
Embedded Computing Board
Embedded Add-on Module/Card NTK-MEE-LAN
Mini-ITX Board V1000 V1100 X300 X302 X304-MTX
3.5" Board X100-J3455-P X101 X102 X103 X104 X105-7433RE
X105-N150
X200
X201
X202
X203
X204
X314 -
Embedded Touchscreen Display
Embedded Touchscreen Display XPPD 10-0P10
XPPD 16-CQ10
XPPD 24-0P10A -
Vehicle Telematics Computer
Atom® Compact VTC 1010 VTC 1011 VTC 1020 VTC 1020-PA VTC 1021-BK/C2K VTC 1030 VTC 1031/1031-C2 VTC 1040/1040-C2 VTC 1910-S VTC 1911-IPK VTC 1920 VTC 1921-IP / VTC1921-C2IP
Atom® Performance VTC 6210-BK VTC 6210-VR4 VTC 6220-BK VTC 6221 VTC 6222 VTC 6231 VTC 6231-IP VTC 6232 VTC 6232-C4SIP
Core™ Power Efficient VTC 7260-x VTC 7260-xC4 VTC 7280-7/-5 VTC 7280-7C5/-5C5
Core™ Performance VTC 7250-7C8 VTC 7251 VTC 7251-7C4 VTC 7252-7C4IP VTC 7270 VTC 7270-C4/C8
-
Railway Computer
Atom® Compact nROK 1020 nROK 1030 nROK 1031 Series nROK 1040-A/-AC2 VTC 1911-IPK
Atom® Performance nROK 6221 nROK 6221-IP nROK 6222 nROK 6231 Series nROK 6232-AC4S nROK 6232-WIC4S VTC 6210-R
Core™ Performance aROK 5510 aROK 8110 nROK 7251-7A nROK 7251-7C4 nROK 7251-WI-7C4IP nROK 7252-AC8S nROK 7252-WI2-C8S nROK 7270 nROK 7271 nROK 7280-7AC5IP/-5AC5IP nROK 7280-7WIC5IP/-5WIC5IP
-
Edge AI Telematics Solution
NVIDIA Jetson Platform ATC 3530-IP7-4C ATC 3560-IP7-NA4C ATC 3560-IP7-NX4C ATC 3560-IP7-NX4CF ATC 3560-IP7-NXAI4CR ATC 3561-NA4C ATC 3561-NX4CF ATC 3562-IP7-NA4M ATC 3562-IP7-NX4MF ATC 3563-NA8C/NAA8CR ATC 3563-NX8C/NXA8CR ATC 3750-6C ATC 3750-A6CR ATC 3750-IP7-6C ATC 3750-IP7-8M ATC 3750-IP7-WI6CR ATC 3750-IP7-WI8MR
NVIDIA Discrete Card aROK 5510 aROK 8110 aROK 8120-AC4F ATC 8010/8010-F ATC 8110/8110-F ATC 8120-C4F rROK 5520
Hailo Module VTC 1021-HBIoT/HCIoT VTC 7260-5HBIoT/7HBIoT VTC 7260-5HCIoT/7HCIoT
-
Vehicle Mount Computer
-
Vehicle Mount Display
-
IP Rating Computer/Display
Edge AI Telematics Solution ATC 3530
Vehicle Mount Display VMD 3002 VMD 3110
Vehicle Mount Computer VMC 2020
-
In-Vehicle Networking
-
PIS Solution
-
Telematics Solution with Android
Telematics Solution with Android
-
Embedded Add-on Module/Card
Converter VIOB-LTE/EKEY Converter
-
Universal Fitness Console
-
Railway Panel Computer
-
Cyber Security Solutions
Expansion Cards NA 1000-L2X NAI 1000-OS NSK 6301 NSK 6402-NVME/6404-NVME TPM9660-TT
Desktop - Soc Based Appliance DTA 1600
PDTA 1370
PDTA 1372
Desktop - X86 Based Appliance DNA 1160 DNA 1170A DNA 140 DNA 141
Rackmount - SoC Based Appliance
Rackmount - X86 Based Entry Level Appliance NSA 1160/1160A NSA 1170 NSA 3170 NSA 3170A NSA 3170HA NSA 3180A NSA 3180HA NSA 3190A NSA 3200
Rackmount - X86 Based Mainstream Appliance NSA 5181 NSA 5190 NSA 5200
Rackmount - X86 Based Performance Appliance NSA 7150 Series NSA 7160R
LAN Module NC 120FIS4-OS NC 120FMS4 NC 220FMS3-1 ND 180C-OS ND 184CX1-OS NI 140C-OS NI 142CX1 NI 142CX1-OS NI 180C-OS NI 180F-OS NI 184CX1 NI 184CX1-OS NI Series NL 110FI-OS NL 110FM-OS NQ Series NV 120F NV 140F-OS NX 140C-OS NX 140F-OS NX 142FX1 NX 142FX1-LR NX 142FX1-LR-OS NX 142FX1-OS NX Series
-
Edge & Cloud Solutions
5G Edge Solutions FWA over 5G uCPE
nexCPE™ Appliance DFA 1163 Series FTA 1170 FTA 5180
uCPE/Edge Appliance DTA 1160 DTA 1162 DTA 1164W Series DTA 1165
DTA 1376/1376A
DTA 1600
SD-WAN Appliance FTA 5190 NSA 6310/6310-1GE TCA 5170 TCA 5170B TCA 5170C TCA 6710 (ODM Only)
-
OT Security Solutions
-
Network Peripheral Solutions
NVR Solutions PNSA 3170 PNSA 3171/3171A PNSA 3190 PNSA 3280/3280A PNSA 3281/3281A
-
SoC Capability & S/W Services
No Series Page 01 Page 02 Page 03 Page 04 Page 05 Page 06 Page 07 Page 08 Page 09 Page 10 Page 11 Page 12 Page 13 Page 14
-
NVR Hardware Platform
AI NVR Workstation NVAiS 1502 NVAiS 8108
Rackmount NVR Platform NViS 5704 NViS 57244 NViS 6708 NViS 6712
-
Network Camera
Multi Sensor Camera NCp-521F NCp-551G NCp-811F NCp-831G NMP881
PTZ Camera NCs-551-211MSV-R NCs-831-000MSV-RS NCs-831-221MSV-R NDS295PRO
Dome Camera NCi-261 NCi-522 NCi-522C-F28RV3 NCi-822C-F28RV3 NCo-261 NCo-521 NCo-523C-F28RV3 NCo-525C NCo-811 NCo-823C-F28RV3 NCo-832C
-
Industrial Wireless Product
-
Remote Network Management
-
Embedded Computing
-
Video Conference System
-
Software Package
-
HealthCare & Medical
-
Embedded Boards
-
Vertical Applications
-
Computer-on-Modules (CCC)
Design-Win Support Spec-in Service Valiodation Service Value Added Services Design-in Assistance
Customization to Order Service
Business Models introduction
COM Technology
COM Express
ETX
COM Application
Before the Numbers Could Talk: Verifying Energy Savings at a Water Treatment Plant
Bull 1
Bear 0
Product/operations
Most Viewed News see more
Physical AI Hits the Factory Floor: Predictive Optimization for Chemical Processes The chemical manufacturing industry is vital to Ta...
Open Innovation Platform Helps Shape the Landscape of IoT Applications The Internet of Things (IoT) inspired numerous app...
Edge Computing Shows IIoT Values with Instant Feedback and Response The heated discussion around Industry 4.0 and smar...
Video see more
| [NOW OPEN] Make Future City into Reality: NEXCOM Future City Virtual Expo NEXCOM Future City Virtual Expo is Now Open! Start...[NOW OPEN] Make Future City into Reality: NEXCOM Future City Virtual Expo |
October 22, 2026
Before the Numbers Could Talk: Verifying Energy Savings at a Water Treatment Plant
There is a version of this story that starts with meters and PLCs. This one starts with a harder question: how do you prove an energy-efficiency upgrade actually worked at a facility that can never go offline to find out?

The Challenge Behind the Upgrade
Located in the Hsinchu region, the water treatment plant supports both municipal and industrial water needs in the surrounding area. Hsinchu is also a major hub of Taiwan's advanced semiconductor industry, where companies such as TSMC first took root. Maintaining a stable water supply is therefore essential to both everyday life and the region's continued industrial operations.
As a critical piece of local water infrastructure, the plant had to maintain uninterrupted operation throughout every phase of modernization.
When key pumping equipment was replaced under an energy-efficiency initiative, the central challenge therefore extended beyond installation. The plant needed credible operating data to answer a much more consequential question: how much energy did the upgraded equipment save, and did the result meet the efficiency target specified for the project?
Four Questions, One Architecture
Once implementation began, it became clear that the original plan did not fully match what the site required. This is where NEXCOM Industry AIoT (NexAIoT Co., Ltd.) took on a broader consulting role, helping translate the original requirements into an architecture shaped by actual operating conditions. Four questions guided the work:
- What must be measured for the energy result to be credible?
No before-and-after comparison is meaningful if the underlying data has not been captured consistently. Establishing a reliable measurement foundation had to come first. - Which existing assets could continue to provide value?
The plant already operated an established control infrastructure. The task was to identify what could remain in service, what needed replacement, and how existing investments could be carried forward. - How should legacy and new systems communicate reliably?
The modernization introduced new PLCs and additional monitoring capability into an existing SCADA-based control environment. Reliable communication across generations and brands of equipment was essential. - How could energy management continue to serve the plant after project acceptance?
The system needed to support more than one verification exercise. The objective was to leave the plant with a usable foundation for ongoing monitoring, troubleshooting, demand management, and future efficiency improvements.
Each question became a design decision. Together, they turned a project specification into an operating architecture aligned with how the plant operates.
The Discovery That Reset the Project
The first question quickly became the most urgent. NEXCOM Industry AIoT found that parts of the original equipment plan did not fully align with the measurement requirements on site. Power meters, gateways, field equipment, and installation points all required further review to ensure that the resulting data could support a credible before-and-after comparison.
This was a fundamental issue. Without sufficient, properly positioned measurement points, even a sophisticated EMS could produce charts without being able to answer the question the project ultimately had to prove: how much energy was saved?
NEXCOM Industry AIoT reassessed the plant's energy-measurement requirements, identified missing coverage, recommended more appropriate installation points, and closed the gaps that would otherwise have weakened the verification process. Only after that foundation was established did the wider system architecture move forward.
That measurement discipline later became the basis of the formal energy-performance verification process. The project used an IPMVP-referenced measurement and verification methodology, combining voltage, current, power, power-factor, and water-flow data to evaluate the amount of electricity required per unit of water delivered. Data was acquired at one-minute intervals, allowing energy performance to be compared on a normalized basis rather than through raw power readings alone.
Building on What Already Worked
With the measurement foundation in place, the remaining questions turned to integration.
The plant already used SCADA as part of its industrial control environment, alongside existing PLC infrastructure. New PLCs were introduced to extend the control architecture and support the revised EMS requirements, while failed equipment was replaced where necessary. Existing assets that remained functional continued to be used.
At the OT layer, new smart meters and PLCs were added to extend monitoring coverage and bridge the plant's existing and newly deployed systems. These additions brought energy, equipment, and control data into the EMS over Ethernet, expanding visibility while preserving existing infrastructure.
At the center of the deployment, the NEXCOM NISE 3910E serves as the industrial computing platform supporting the EMS environment. JMobile provides the site-level visualization interface, bringing energy data together with selected signals from the existing FMCS environment, including equipment startup status. This gives operators and energy-management personnel a centralized view of equipment conditions and energy use across the facility. At the information layer, Node-RED supports data exchange between the connected systems.
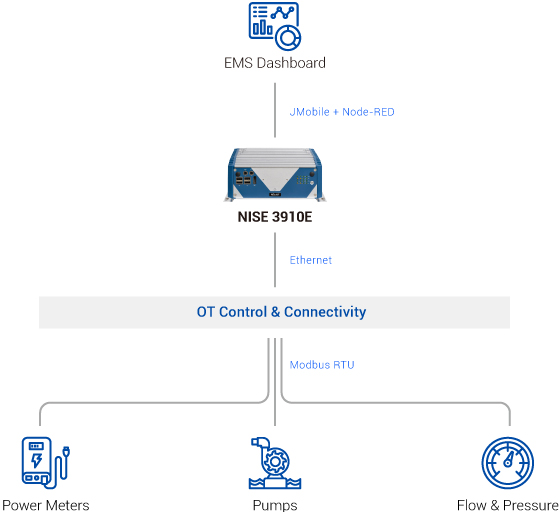
The result is a coordinated architecture built around the plant's existing operating environment: legacy systems continue to perform their established roles, new systems add the measurement and control capabilities the project required, and information that previously existed across separate control points can be managed through a common EMS environment.
This approach preserved useful existing investments, reduced unnecessary replacement, and lowered the operational risk associated with modernization in a continuously operating plant.
An Energy System That Understands Water
Demand control was part of the original tender requirements, but implementing it required more than watching electrical demand.
A water treatment plant has to satisfy hydraulic and supply conditions first. Pump operation therefore cannot be adjusted solely according to electricity consumption or peak demand. Flow, pressure, equipment status, and water-supply requirements all have to be considered together.
The system reflects that operating reality: JMobile integrates relevant SCADA signals, while the new PLC exchanges communication points with existing PLCs and SCADA to support motor start-stop control. Flow and pressure information are incorporated into the control logic so that pump and motor operation can be rotated according to actual supply conditions.
The same principle also shaped the energy-performance verification itself: lower electricity consumption only represents a real efficiency improvement when the amount of water delivered is taken into account. That is why the project evaluates performance in kilowatt-hours per cubic meter of water pumped, rather than relying on power consumption alone.
Furthermore, plant-wide power monitoring and demand alarms give operators visibility into peak-demand conditions, while the demand-control interface allows personnel to view pump status and intervene when necessary. Historical trend data also makes it possible to revisit abnormal periods and compare them with events such as water shortages, pump irregularities, or other unusual operating conditions.
What This Means for the People Running the Plant
Every layer of the system ultimately serves someone responsible for keeping the plant running.
Electrical and mechanical personnel gain a clearer record of motor and pump behavior. When operating conditions change or an abnormal trend appears, they have historical evidence available for investigation rather than relying only on observations made after the event.
Operators gain a centralized view of electricity use, equipment status, demand conditions, flow, and pressure, reducing the need to piece together the operating picture from separate field indicators.
Energy-management personnel can compare performance over time using a consistent data foundation, while management gains a clearer basis for evaluating whether equipment investment delivered the efficiency improvement that was expected.
The platform also connects energy use with electricity-cost management through tariff calculation, contract-capacity functions, variable electricity-charge records, and time-of-use tariff settings. The same energy data can therefore support both technical operation and management-level cost analysis.
That range of value—from plant operation to management review—is central to the consulting approach NEXCOM Industry AIoT brought to the project. The objective was to leave the plant with a system that remained useful after the acceptance process was complete.
What the Ledger Now Shows
Measurement and verification confirmed that the upgraded pumping system achieved a 17.6% project-level energy-saving rate, comfortably exceeding the specified 10.76% target. At the plant level, the improvement translated into a 2.7% energy-saving rate, also outperforming the required benchmark.
What makes these figures meaningful is the evidence behind them. The equipment upgrade delivered the efficiency gain, while the EMS made that gain visible, comparable, and verifiable through actual operating data. By strengthening the measurement foundation and establishing a consistent baseline, NEXCOM Industry AIoT gave the plant a result it can confidently demonstrate.
That level of execution is no accident. The plant's EMS environment, prior to this project, fell short of what a facility of its scale and importance required. Drawing on years of full-plant integration experience, NEXCOM Industry AIoT built the EMS into the complete, coherent system the plant needed.
Closing Thoughts: A Foundation, Not a Finish Line
What the plant gained extends well past this single verification cycle. It now holds a proven architecture and a verified methodology—one that will inform how the next modernization effort, here and elsewhere, gets scoped and carried out.
Measure. Compare. Verify. Improve. Measure again. That cycle is the throughline of the entire project, traceable back to the four questions that shaped it and to an architecture built around how the plant actually runs.
-
Related Links:
-
NEXCOM Joins Forces with Intel at COMPUTEX 2026: Defining New Standards for Smart Production Lines
-
Browse Other News:
-
Smarter Warehouse & Logistics Inspection Starts at the Edge with NDiS B340
-
NEXCOM Introduces RoboWIZ AI Robotics Platform at GTC Berlin
Committed to Customer Success ©2011-2023 NEXCOM International Co., Ltd. All Rights Reserved. Cookie Privacy Sitemap
Take a minute and tell us what you think!
-
eSAF Cybersecurity Platform
-
Industrial Fanless Computer
Cabinet Mount Controller Fanless PC CMC 300-F0x CMC 300-F13 CMC 300-F2x
Atom™ Compact NISE 105 NISE 105U NISE 106-N3710 NISE 107 NISE 107-E3940 NISE 108 NISE 109-E01/E02 NISE 110-A01/A02 NISE 50 A04-01 NISE 50 A04-02 NISE 50 A04-03 NISE 50 A04-04 NISE 505 NISE 50-J1900 NISE 51 NISE 51-J3455 NISE 52 NISE 53-E01/E02 NISE 70
Core™-i Performance NISE 3000 C30-E
NISE 3000 C30-E2/P2E
NISE 3000 C30-R
NISE 3000 C31-E2/P2E/E16
NISE 3600CE
NISE 3600CE2/P2/P2E
NISE 3700E
NISE 3700E2/P2/P2E
NISE 3900E
NISE 3900E2/P2/P2E
NISE 3900E-H310
NISE 3900R
NISE 3910E
NISE 3910E16/E2/P2/P2E
NISE 3910R
NISE 4310-E01
TT 300-A0Q
TT 300-A2Q/A3Q
TT 300-F00
TT 300-F30 -
Industrial Rackmount Computer
PICMG 1.0/1.3 SBC PEAK 887VL2 PEAK 888VL2 PEAK 889VL2 PEAK 890VL2 PEAK 980/980-H
PICMG 1.0/1.3 BackPlane NBP 0513 NBP 0522 NBP 0641 NBP 06E5 NBP 06P2 NBP 1024 NBP 1052 NBP 1257 NBP 142A0-CX NBP 14570-BX NBP 14570-CX NBP 1465 NBP 14670 NBP 1468 NBP 14880 NBP 2U040 NBP 2U220
Industrial Motherboard NEX 812 NEX 813 NEX 816 NEX 818 NEX 912P NEX 913 NEX 913C NEX 916 NEX 918 NEX 919
-
Embedded Computing
3.5'' / 5.25'' SBC EBC 260 EBC 355A EBC 355U Series EBC 355XP EBC 356 EBC 357 EBC 357X EBC 358 EBC 358X EBC 370/EBC 370X EBC359
Mini-ITX MB NEX 618 NEX 619 NEX 650-ADU
Computer-on-Module ICES 620-HCAD1-USB ICES 620X ICES 674 ICES 675 ICES 675S
-
Panel PC
Human Machine Interface eLITE610 eSMART04 eSMART07M eSMART10 eTOP504 eTOP507 eTOP510
Industrial Panel PC/ Monitor IPPC 1040P IPPC 1050P IPPC 1611-C11 IPPC 1640P IPPC 1650P IPPC 1660-A11 IPPC 1680P IPPC 1850P IPPC 1880P IPPC 2111-C11 IPPC 2140P IPPC 2150P IPPC 2160-A11 IPPC 2180P IPPC 2411-C11 IPPC 2460-A11
Applied Panel PC/ Monitor APPC 0760-A01
APPC 0760-A02
APPC 0760-A04
APPC 1060-A01
APPC 1060-A02
APPC 1060-A04
APPC 1240C-B01
APPC 1245T
APPC 1250T
APPC 1260T-A01
APPC 1540C-B01
APPC 1540T
APPC 1550T
APPC 1560-A01
APPC 1660-A01
APPC 1740C-B01
APPC 1740T
APPC 1750T
APPC 1760-A01
APPC 1940C-B01
APPC 1940T
APPC 1950T
APPC 1960-A01
APPC 2160-A01
APPC 3154
APPC160 C21-01
APPC210 C21-01
APPD 1200-1
APPD 1200-2
APPD 1500-1
APPD 1500-2
APPD 1600-2
APPD 1700-1
APPD 1700-2
APPD 1900-1
APPD 1900-2
APPD 2100-2 -
PC-based Factory Automation
miniPCIe Module - COM NISKECOM3 NISKECOM4 NISKLPT
miniPCIe Modules - Fieldbus FBI90E-COM FBI90E-DNM FBI90E-PBM FBI90E-REM NISKNVRAM
miniPCIe Module - I/O NISKDIO-8I8O
industrial Fieldbus Computer NIFE 106-A01 NIFE 106-A02 NIFE 200 NIFE 200P2/E2/P2E NIFE 200S NIFE210-E01/E02 NIFE210-E11/E12
-
Software Solution
IntervalZero RTX - RTOS RTX 2012 RTX64 2013
USB WhiteList USB WhiteList 1.0
Professional Software Service – BIOS, Bootloader, Kernel, eAPI, Driver & Embedded OS/BSP ProfessionalSoftware Service
-
Machine Automation
-
IoT Solutions
Arm-based HMI nHMI-07L nHMI-10M
Remote Data Acquisition System nDAS 6000 Series
-
Marine Computer
-
Slow Moving Embedded Boards
Slow moving embedded boards ICES 620-HCAD3 NEX 650-ADU NEX 812 NEX 813 NEX 885 NEX 910 NEX 913 NEX 980 PEAK 877VL2
-
Environment and Energy Solutions
Environment and Energy Solutions
Industrial IoT Data Acquisition System RN-30-EG01 RN-30-ND01/02
-
Duro Edge Computer
Accessories DockInfinity-2R8
DockInfinity-2S
DockInfinity-E4X1
DockInfinity-R16F
Compat ARM® NDiS B115 (EOL) NDiS B116 (EOL) NDiS B117
Compact Celeron® NDiS B327(EOL) NDiS B336R(EOL) NDiS B337 (EOL) NDiS B338 NDiS B338-LITE NDiS B339 NDiS B340 Series
Multi-display Computing System NDiS V1000 NDiS V1100
Energy Saver Core™ U NDiS B360 NDiS B361 NDiS B362 NDiS B363 NDiS B364
Hi-Power Core™ NDiS B535 (EOL) NDiS B537 (EOL) NDiS B560 (EOL) NDiS B560-Q (EOL) NDiS B560S (EOL) NDiS B560S-H (EOL) NDiS B561/B561-PoE NDiS B561S NDiS B562 Series NDiS B562-Q Series
-
Embedded Touchscreen Computer
Slim Touchscreen Computer (SPPC Intel® Celeron®) SPPC 16-10N150
High Brightness Touchscreen Computer (HPPC Intel Celeron®) HPPC 12-10X7211 HPPC 15-10X7211
Wide Touchscreen Computer (XPPC Intel® Core™) XPPC 10-200 XPPC 16-200 XPPC 16-201 XPPC 24-200A
Wide Touchscreen Computer (XPPC Intel® Celeron®) XPPC 10-100 (EOL) XPPC 10-100-Ag+ (EOL) XPPC 10-10N97 XPPC 16-100 (EOL) XPPC 16-101 (EOL) XPPC 16-105N150
XPPC 16-105N97
XPPC 16-10N97
XPPC 22-100A (EOL)
XPPC 24-100A (EOL)
XPPC 24-10N97A
4:3 Open Frame Panel PC (OPPC) OPPC 1240T OPPC 1540HT-J1900 OPPC 1540TSeries OPPC 1740T OPPC 1940HT-J1900 OPPC 1940TSeries
-
Edge AI Computer
NVIDIA Solution AIEdge-X®300 AIEdge-X®300-RTX30 AIEdge-X®310 AIEdge-X®500 AIEdge-X®80 AIEdge-X®80-NA AIEdge-X®80-NX-S
Google Coral Solution AIEdge-X®100 AIEdge-X®537 NISE 3800E-GCIoT NISE 50-GCIoT
Intel Movidius Solution AIEdge-X®100-VPU AIEdge-X®300-VPU AIEdge-X®500 AIEdge-X®537-VPU
-
Edge Computing System
Neu-X3 Core™ Series Neu-X1025-N305 Neu-X102-i3 Neu-X1045-N355 Neu-X104-i3 Neu-X302 Neu-X303 Neu-X303mini Neu-X304
Neu-X1 Atom® Series Neu-X100 Neu-X101 Neu-X101-6C-DC Neu-X1025-N50 Neu-X1025-N97 Neu-X102-N50 Neu-X102-N97 Neu-X1045-N150 Neu-X104-N150 Neu-X60 Neu-XE102-N50-4C Neu-XE102-N97-14C2S Neu-XE102-N97-6C2S Neu-XE104-N150-14C2S Neu-XE104-N150-6C2S Neu-XE105-N50-12U
-
Embedded Computing Board
Embedded Add-on Module/Card NTK-MEE-LAN
Mini-ITX Board V1000 V1100 X300 X302 X304-MTX
3.5" Board X100-J3455-P X101 X102 X103 X104 X105-7433RE
X105-N150
X200
X201
X202
X203
X204
X314 -
Embedded Touchscreen Display
Embedded Touchscreen Display XPPD 10-0P10
XPPD 16-CQ10
XPPD 24-0P10A -
Vehicle Telematics Computer
Atom® Compact VTC 1010 VTC 1011 VTC 1020 VTC 1020-PA VTC 1021-BK/C2K VTC 1030 VTC 1031/1031-C2 VTC 1040/1040-C2 VTC 1910-S VTC 1911-IPK VTC 1920 VTC 1921-IP / VTC1921-C2IP
Atom® Performance VTC 6210-BK VTC 6210-VR4 VTC 6220-BK VTC 6221 VTC 6222 VTC 6231 VTC 6231-IP VTC 6232 VTC 6232-C4SIP
Core™ Power Efficient VTC 7260-x VTC 7260-xC4 VTC 7280-7/-5 VTC 7280-7C5/-5C5
Core™ Performance VTC 7250-7C8 VTC 7251 VTC 7251-7C4 VTC 7252-7C4IP VTC 7270 VTC 7270-C4/C8
-
Railway Computer
Atom® Compact nROK 1020 nROK 1030 nROK 1031 Series nROK 1040-A/-AC2 VTC 1911-IPK
Atom® Performance nROK 6221 nROK 6221-IP nROK 6222 nROK 6231 Series nROK 6232-AC4S nROK 6232-WIC4S VTC 6210-R
Core™ Performance aROK 5510 aROK 8110 nROK 7251-7A nROK 7251-7C4 nROK 7251-WI-7C4IP nROK 7252-AC8S nROK 7252-WI2-C8S nROK 7270 nROK 7271 nROK 7280-7AC5IP/-5AC5IP nROK 7280-7WIC5IP/-5WIC5IP
-
Edge AI Telematics Solution
NVIDIA Jetson Platform ATC 3530-IP7-4C ATC 3560-IP7-NA4C ATC 3560-IP7-NX4C ATC 3560-IP7-NX4CF ATC 3560-IP7-NXAI4CR ATC 3561-NA4C ATC 3561-NX4CF ATC 3562-IP7-NA4M ATC 3562-IP7-NX4MF ATC 3563-NA8C/NAA8CR ATC 3563-NX8C/NXA8CR ATC 3750-6C ATC 3750-A6CR ATC 3750-IP7-6C ATC 3750-IP7-8M ATC 3750-IP7-WI6CR ATC 3750-IP7-WI8MR
NVIDIA Discrete Card aROK 5510 aROK 8110 aROK 8120-AC4F ATC 8010/8010-F ATC 8110/8110-F ATC 8120-C4F rROK 5520
Hailo Module VTC 1021-HBIoT/HCIoT VTC 7260-5HBIoT/7HBIoT VTC 7260-5HCIoT/7HCIoT
-
Vehicle Mount Computer
-
Vehicle Mount Display
-
IP Rating Computer/Display
Edge AI Telematics Solution ATC 3530
Vehicle Mount Display VMD 3002 VMD 3110
Vehicle Mount Computer VMC 2020
-
In-Vehicle Networking
-
PIS Solution
-
Telematics Solution with Android
Telematics Solution with Android
-
Embedded Add-on Module/Card
Converter VIOB-LTE/EKEY Converter
-
Universal Fitness Console
-
Railway Panel Computer
-
Cyber Security Solutions
Expansion Cards NA 1000-L2X NAI 1000-OS NSK 6301 NSK 6402-NVME/6404-NVME TPM9660-TT
Desktop - Soc Based Appliance DTA 1600
PDTA 1370
PDTA 1372
Desktop - X86 Based Appliance DNA 1160 DNA 1170A DNA 140 DNA 141
Rackmount - SoC Based Appliance
Rackmount - X86 Based Entry Level Appliance NSA 1160/1160A NSA 1170 NSA 3170 NSA 3170A NSA 3170HA NSA 3180A NSA 3180HA NSA 3190A NSA 3200
Rackmount - X86 Based Mainstream Appliance NSA 5181 NSA 5190 NSA 5200
Rackmount - X86 Based Performance Appliance NSA 7150 Series NSA 7160R
LAN Module NC 120FIS4-OS NC 120FMS4 NC 220FMS3-1 ND 180C-OS ND 184CX1-OS NI 140C-OS NI 142CX1 NI 142CX1-OS NI 180C-OS NI 180F-OS NI 184CX1 NI 184CX1-OS NI Series NL 110FI-OS NL 110FM-OS NQ Series NV 120F NV 140F-OS NX 140C-OS NX 140F-OS NX 142FX1 NX 142FX1-LR NX 142FX1-LR-OS NX 142FX1-OS NX Series
-
Edge & Cloud Solutions
5G Edge Solutions FWA over 5G uCPE
nexCPE™ Appliance DFA 1163 Series FTA 1170 FTA 5180
uCPE/Edge Appliance DTA 1160 DTA 1162 DTA 1164W Series DTA 1165
DTA 1376/1376A
DTA 1600
SD-WAN Appliance FTA 5190 NSA 6310/6310-1GE TCA 5170 TCA 5170B TCA 5170C TCA 6710 (ODM Only)
-
OT Security Solutions
-
Network Peripheral Solutions
NVR Solutions PNSA 3170 PNSA 3171/3171A PNSA 3190 PNSA 3280/3280A PNSA 3281/3281A
-
SoC Capability & S/W Services
No Series Page 01 Page 02 Page 03 Page 04 Page 05 Page 06 Page 07 Page 08 Page 09 Page 10 Page 11 Page 12 Page 13 Page 14
-
NVR Hardware Platform
AI NVR Workstation NVAiS 1502 NVAiS 8108
Rackmount NVR Platform NViS 5704 NViS 57244 NViS 6708 NViS 6712
-
Network Camera
Multi Sensor Camera NCp-521F NCp-551G NCp-811F NCp-831G NMP881
PTZ Camera NCs-551-211MSV-R NCs-831-000MSV-RS NCs-831-221MSV-R NDS295PRO
Dome Camera NCi-261 NCi-522 NCi-522C-F28RV3 NCi-822C-F28RV3 NCo-261 NCo-521 NCo-523C-F28RV3 NCo-525C NCo-811 NCo-823C-F28RV3 NCo-832C
-
Industrial Wireless Product
-
Remote Network Management
-
Embedded Computing
-
Video Conference System
-
Software Package
-
HealthCare & Medical
-
Embedded Boards
-
Vertical Applications
-
Computer-on-Modules (CCC)
Design-Win Support Spec-in Service Valiodation Service Value Added Services Design-in Assistance
Customization to Order Service
Business Models introduction
COM Technology
COM Express
ETX
COM Application
Smarter Warehouse & Logistics Inspection Starts at the Edge with NDiS B340
Bull 1
Bear 0
Product/operations
Most Viewed News see more
Physical AI Hits the Factory Floor: Predictive Optimization for Chemical Processes The chemical manufacturing industry is vital to Ta...
Open Innovation Platform Helps Shape the Landscape of IoT Applications The Internet of Things (IoT) inspired numerous app...
Edge Computing Shows IIoT Values with Instant Feedback and Response The heated discussion around Industry 4.0 and smar...
October 22, 2026
Smarter Warehouse & Logistics Inspection Starts at the Edge with NDiS B340
Keeping pace with rising parcel volumes is becoming increasingly demanding as warehouses and distribution centers adopt more connected vision technologies. Modern warehouse and logistics inspection systems must integrate a growing number of devices, from barcode and QR code scanners to machine vision cameras, photoelectric sensors, sortation actuators, and conveyor/PLC controllers, while keeping pace with fast-moving lines and responding immediately to exceptions. As throughput requirements continue to grow, businesses also need solutions that can scale with changing requirements without repeatedly replacing their core computing infrastructure. NEXCOM addresses these challenges with the NDiS B340 , a compact, fanless box PC designed to provide reliable edge computing for camera-based inspection on the warehouse floor.
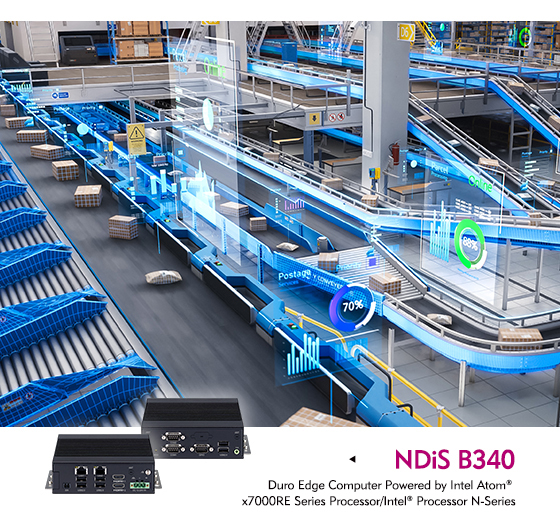
A flexible edge platform for warehouse visual inspection
The NDiS B340 is designed to simplify the integration of camera-based inspection systems while providing the flexibility needed for long-term deployments on the warehouse floor. Its sturdy aluminum enclosure efficiently dissipates heat for stable, fanless operation, and withstands the dust, vibration, and temperature swings typical of conveyor lines and dock areas. The platform also supports multiple low-power Intel® processor options, allowing system integrators to select the performance level that best fits their applications — from barcode/QR code verification to multi-camera dimensioning and defect detection — while maintaining the same chassis and connectors. With its combination of flexible expansion, low-power operation, and long-term platform compatibility, the NDiS B340 provides a practical foundation for warehouse and logistics inspection systems that need to scale as sorting and inspection requirements evolve.
Scalable expansion without replacing the host system
Warehouse inspection lines often expand as businesses add more cameras, scanners, or sortation stations. Replacing the entire computing platform every time new functionality is required can increase costs and generate unnecessary electronic waste. For applications requiring additional cameras or networking capabilities, the NDiS B340 can be paired with the DockInfinity-E4X1 expansion kit. The expansion kit adds a PCIe x4 interface for PoE, additional network, frame-grabber/capture, and other application-specific cards, giving system integrators greater flexibility to power and connect additional GigE Vision cameras without external PoE injectors as an inspection line grows. For a closer look at DockInfinity and its expansion capabilities, see Expand Beyond Limits: Unlocking New Possibilities with DockInfinity .
The NDiS B340 further supports long-term scalability through its pin-compatible multi-platform design. The same chassis and connectors accommodate Intel Atom® x7000RE Series processors as well as Intel® Processor N97 and N150 options, allowing businesses to move between different performance tiers or processor generations without redesigning the system. Such flexibility can extend the service life of warehouse inspection deployments while reducing the need for complete system replacements.
Matching camera bandwidth to the inspection task
Camera-based inspection on a moving conveyor line depends on getting enough image data off the sensor before the next item arrives. The NDiS B340 's 6 x USB 2.0 ports comfortably handle lower-resolution or lower-frame-rate inspection tasks — barcode/QR code verification, presence-and-count checks, and basic label or surface inspection with VGA-to-2MP cameras — as well as USB barcode scanners and other peripherals. For higher-resolution or multi-camera dimensioning and defect-detection systems, the 2 x Intel® LAN ports support GigE Vision cameras over longer cable runs, and the PCIe x4 expansion slot can add a PoE or frame-grabber card via DockInfinity-E4X1 to power additional cameras without external injectors. This lets integrators match camera bandwidth to the task — USB 2.0 for simpler checks, LAN/PoE for higher-throughput lines — on the same platform. The NDiS B340 also provides RS-232/422/485 connectivity for barcode scanners, label printers, and PLC/conveyor controllers. Its DB15 GPIO interface provides six digital inputs and six digital outputs, giving integrators a direct way to connect line sensors and actuators without adding external I/O modules. Digital inputs can trigger image capture from photoelectric or proximity sensors as a package passes, while digital outputs can drive reject-arm actuators, stack lights, or signal upstream systems when a scan failure or defect is detected.
With local edge computing, the NDiS B340 can also run inspection logic directly at the line without relying entirely on cloud connectivity, helping warehouse inspection systems respond immediately to events such as failed scans, mislabeled packages, or sensor faults. Optional 5G/LTE and Wi-Fi connectivity further expands deployment flexibility, making the NDiS B340 a versatile platform for parcel sortation, package dimensioning and damage inspection, and other connected logistics vision applications.
Main Features
- Intel Atom® Processor x7000RE Series/Intel® Processor N-Series
- 1 x DDR5 SO-DIMM, up to 16GB
- 2 x HDMI® 2.0 output, up to 3840x2160@60Hz
- 2 x Intel® LAN port
- 6 x USB 2.0, 1 x Line out, 1 x GPIO, 2 x COM port
- Support one PCIe 3.0 x4 expansion card with optional DockInfinity
- 1 x M.2 Key B 3052 for an optional 5G/LTE module
- 1 x M.2 Key E 2230 for an optional Wi-Fi module
- 1 x M.2 Key M 2242 for an optional SSD
- TPM 2.0 for enhanced security
- Support DC +12V to 24V power input
Ordering Information
NDiS B340-X7213RE (P/N: 10W90E10006X0)
Duro Edge computer, Intel Atom® x7213RE processor
NDiS B340E1-X7213RE (P/N: 10W90E10001X0)
Duro Edge computer, Intel Atom® x7213RE processor, w/ one PCIe x4 expansion kit (DockInfinity-E4X1)
NDiS B340-X7433RE (P/N: 10W90E10007X0)
Duro Edge computer, Intel Atom® x7433RE processor
NDiS B340E1-X7433RE (P/N: 10W90E10002X0)
Duro Edge computer, Intel Atom® x7433RE processor, w/ one PCIe x4 expansion kit (DockInfinity-E4X1)
NDiS B340-N97 (P/N: 10W90E10004X0)
Duro Edge computer, Intel® processor N97
NDiS B340E1-N97 (P/N: 10W90E10003X0)
Duro Edge computer, Intel® processor N97, w/ one PCIe x4 expansion kit (DockInfinity-E4X1)
NDiS B340-N150 (P/N: 10W90E10005X0)
Duro Edge computer, Intel® processor N150
NDiS B340E1-N150 (P/N: 10W90E10000X0)
Duro Edge computer, Intel® processor N150, w/ one PCIe x4 expansion kit (DockInfinity-E4X1)
DockInfinity-E4X1 (P/N: 10W00DOCK01X0)
One PCIe x4 expansion kit for Duro Edge computer
-
Related Links:
-
Bringing Smart City Applications to Users’ Fingertips with the XPPD Series
-
Browse Other News:
-
Smarter Warehouse & Logistics Inspection Starts at the Edge with NDiS B340
-
NEXCOM Introduces RoboWIZ AI Robotics Platform at GTC Berlin
Committed to Customer Success ©2011-2023 NEXCOM International Co., Ltd. All Rights Reserved. Cookie Privacy Sitemap
Take a minute and tell us what you think!
-
eSAF Cybersecurity Platform
-
Industrial Fanless Computer
Cabinet Mount Controller Fanless PC CMC 300-F0x CMC 300-F13 CMC 300-F2x
Atom™ Compact NISE 105 NISE 105U NISE 106-N3710 NISE 107 NISE 107-E3940 NISE 108 NISE 109-E01/E02 NISE 110-A01/A02 NISE 50 A04-01 NISE 50 A04-02 NISE 50 A04-03 NISE 50 A04-04 NISE 505 NISE 50-J1900 NISE 51 NISE 51-J3455 NISE 52 NISE 53-E01/E02 NISE 70
Core™-i Performance NISE 3000 C30-E
NISE 3000 C30-E2/P2E
NISE 3000 C30-R
NISE 3000 C31-E2/P2E/E16
NISE 3600CE
NISE 3600CE2/P2/P2E
NISE 3700E
NISE 3700E2/P2/P2E
NISE 3900E
NISE 3900E2/P2/P2E
NISE 3900E-H310
NISE 3900R
NISE 3910E
NISE 3910E16/E2/P2/P2E
NISE 3910R
NISE 4310-E01
TT 300-A0Q
TT 300-A2Q/A3Q
TT 300-F00
TT 300-F30 -
Industrial Rackmount Computer
PICMG 1.0/1.3 SBC PEAK 887VL2 PEAK 888VL2 PEAK 889VL2 PEAK 890VL2 PEAK 980/980-H
PICMG 1.0/1.3 BackPlane NBP 0513 NBP 0522 NBP 0641 NBP 06E5 NBP 06P2 NBP 1024 NBP 1052 NBP 1257 NBP 142A0-CX NBP 14570-BX NBP 14570-CX NBP 1465 NBP 14670 NBP 1468 NBP 14880 NBP 2U040 NBP 2U220
Industrial Motherboard NEX 812 NEX 813 NEX 816 NEX 818 NEX 912P NEX 913 NEX 913C NEX 916 NEX 918 NEX 919
-
Embedded Computing
3.5'' / 5.25'' SBC EBC 260 EBC 355A EBC 355U Series EBC 355XP EBC 356 EBC 357 EBC 357X EBC 358 EBC 358X EBC 370/EBC 370X EBC359
Mini-ITX MB NEX 618 NEX 619 NEX 650-ADU
Computer-on-Module ICES 620-HCAD1-USB ICES 620X ICES 674 ICES 675 ICES 675S
-
Panel PC
Human Machine Interface eLITE610 eSMART04 eSMART07M eSMART10 eTOP504 eTOP507 eTOP510
Industrial Panel PC/ Monitor IPPC 1040P IPPC 1050P IPPC 1611-C11 IPPC 1640P IPPC 1650P IPPC 1660-A11 IPPC 1680P IPPC 1850P IPPC 1880P IPPC 2111-C11 IPPC 2140P IPPC 2150P IPPC 2160-A11 IPPC 2180P IPPC 2411-C11 IPPC 2460-A11
Applied Panel PC/ Monitor APPC 0760-A01
APPC 0760-A02
APPC 0760-A04
APPC 1060-A01
APPC 1060-A02
APPC 1060-A04
APPC 1240C-B01
APPC 1245T
APPC 1250T
APPC 1260T-A01
APPC 1540C-B01
APPC 1540T
APPC 1550T
APPC 1560-A01
APPC 1660-A01
APPC 1740C-B01
APPC 1740T
APPC 1750T
APPC 1760-A01
APPC 1940C-B01
APPC 1940T
APPC 1950T
APPC 1960-A01
APPC 2160-A01
APPC 3154
APPC160 C21-01
APPC210 C21-01
APPD 1200-1
APPD 1200-2
APPD 1500-1
APPD 1500-2
APPD 1600-2
APPD 1700-1
APPD 1700-2
APPD 1900-1
APPD 1900-2
APPD 2100-2 -
PC-based Factory Automation
miniPCIe Module - COM NISKECOM3 NISKECOM4 NISKLPT
miniPCIe Modules - Fieldbus FBI90E-COM FBI90E-DNM FBI90E-PBM FBI90E-REM NISKNVRAM
miniPCIe Module - I/O NISKDIO-8I8O
industrial Fieldbus Computer NIFE 106-A01 NIFE 106-A02 NIFE 200 NIFE 200P2/E2/P2E NIFE 200S NIFE210-E01/E02 NIFE210-E11/E12
-
Software Solution
IntervalZero RTX - RTOS RTX 2012 RTX64 2013
USB WhiteList USB WhiteList 1.0
Professional Software Service – BIOS, Bootloader, Kernel, eAPI, Driver & Embedded OS/BSP ProfessionalSoftware Service
-
Machine Automation
-
IoT Solutions
Arm-based HMI nHMI-07L nHMI-10M
Remote Data Acquisition System nDAS 6000 Series
-
Marine Computer
-
Slow Moving Embedded Boards
Slow moving embedded boards ICES 620-HCAD3 NEX 650-ADU NEX 812 NEX 813 NEX 885 NEX 910 NEX 913 NEX 980 PEAK 877VL2
-
Environment and Energy Solutions
Environment and Energy Solutions
Industrial IoT Data Acquisition System RN-30-EG01 RN-30-ND01/02
-
Duro Edge Computer
Accessories DockInfinity-2R8
DockInfinity-2S
DockInfinity-E4X1
DockInfinity-R16F
Compat ARM® NDiS B115 (EOL) NDiS B116 (EOL) NDiS B117
Compact Celeron® NDiS B327(EOL) NDiS B336R(EOL) NDiS B337 (EOL) NDiS B338 NDiS B338-LITE NDiS B339 NDiS B340 Series
Multi-display Computing System NDiS V1000 NDiS V1100
Energy Saver Core™ U NDiS B360 NDiS B361 NDiS B362 NDiS B363 NDiS B364
Hi-Power Core™ NDiS B535 (EOL) NDiS B537 (EOL) NDiS B560 (EOL) NDiS B560-Q (EOL) NDiS B560S (EOL) NDiS B560S-H (EOL) NDiS B561/B561-PoE NDiS B561S NDiS B562 Series NDiS B562-Q Series
-
Embedded Touchscreen Computer
Slim Touchscreen Computer (SPPC Intel® Celeron®) SPPC 16-10N150
High Brightness Touchscreen Computer (HPPC Intel Celeron®) HPPC 12-10X7211 HPPC 15-10X7211
Wide Touchscreen Computer (XPPC Intel® Core™) XPPC 10-200 XPPC 16-200 XPPC 16-201 XPPC 24-200A
Wide Touchscreen Computer (XPPC Intel® Celeron®) XPPC 10-100 (EOL) XPPC 10-100-Ag+ (EOL) XPPC 10-10N97 XPPC 16-100 (EOL) XPPC 16-101 (EOL) XPPC 16-105N150
XPPC 16-105N97
XPPC 16-10N97
XPPC 22-100A (EOL)
XPPC 24-100A (EOL)
XPPC 24-10N97A
4:3 Open Frame Panel PC (OPPC) OPPC 1240T OPPC 1540HT-J1900 OPPC 1540TSeries OPPC 1740T OPPC 1940HT-J1900 OPPC 1940TSeries
-
Edge AI Computer
NVIDIA Solution AIEdge-X®300 AIEdge-X®300-RTX30 AIEdge-X®310 AIEdge-X®500 AIEdge-X®80 AIEdge-X®80-NA AIEdge-X®80-NX-S
Google Coral Solution AIEdge-X®100 AIEdge-X®537 NISE 3800E-GCIoT NISE 50-GCIoT
Intel Movidius Solution AIEdge-X®100-VPU AIEdge-X®300-VPU AIEdge-X®500 AIEdge-X®537-VPU
-
Edge Computing System
Neu-X3 Core™ Series Neu-X1025-N305 Neu-X102-i3 Neu-X1045-N355 Neu-X104-i3 Neu-X302 Neu-X303 Neu-X303mini Neu-X304
Neu-X1 Atom® Series Neu-X100 Neu-X101 Neu-X101-6C-DC Neu-X1025-N50 Neu-X1025-N97 Neu-X102-N50 Neu-X102-N97 Neu-X1045-N150 Neu-X104-N150 Neu-X60 Neu-XE102-N50-4C Neu-XE102-N97-14C2S Neu-XE102-N97-6C2S Neu-XE104-N150-14C2S Neu-XE104-N150-6C2S Neu-XE105-N50-12U
-
Embedded Computing Board
Embedded Add-on Module/Card NTK-MEE-LAN
Mini-ITX Board V1000 V1100 X300 X302 X304-MTX
3.5" Board X100-J3455-P X101 X102 X103 X104 X105-7433RE
X105-N150
X200
X201
X202
X203
X204
X314 -
Embedded Touchscreen Display
Embedded Touchscreen Display XPPD 10-0P10
XPPD 16-CQ10
XPPD 24-0P10A -
Vehicle Telematics Computer
Atom® Compact VTC 1010 VTC 1011 VTC 1020 VTC 1020-PA VTC 1021-BK/C2K VTC 1030 VTC 1031/1031-C2 VTC 1040/1040-C2 VTC 1910-S VTC 1911-IPK VTC 1920 VTC 1921-IP / VTC1921-C2IP
Atom® Performance VTC 6210-BK VTC 6210-VR4 VTC 6220-BK VTC 6221 VTC 6222 VTC 6231 VTC 6231-IP VTC 6232 VTC 6232-C4SIP
Core™ Power Efficient VTC 7260-x VTC 7260-xC4 VTC 7280-7/-5 VTC 7280-7C5/-5C5
Core™ Performance VTC 7250-7C8 VTC 7251 VTC 7251-7C4 VTC 7252-7C4IP VTC 7270 VTC 7270-C4/C8
-
Railway Computer
Atom® Compact nROK 1020 nROK 1030 nROK 1031 Series nROK 1040-A/-AC2 VTC 1911-IPK
Atom® Performance nROK 6221 nROK 6221-IP nROK 6222 nROK 6231 Series nROK 6232-AC4S nROK 6232-WIC4S VTC 6210-R
Core™ Performance aROK 5510 aROK 8110 nROK 7251-7A nROK 7251-7C4 nROK 7251-WI-7C4IP nROK 7252-AC8S nROK 7252-WI2-C8S nROK 7270 nROK 7271 nROK 7280-7AC5IP/-5AC5IP nROK 7280-7WIC5IP/-5WIC5IP
-
Edge AI Telematics Solution
NVIDIA Jetson Platform ATC 3530-IP7-4C ATC 3560-IP7-NA4C ATC 3560-IP7-NX4C ATC 3560-IP7-NX4CF ATC 3560-IP7-NXAI4CR ATC 3561-NA4C ATC 3561-NX4CF ATC 3562-IP7-NA4M ATC 3562-IP7-NX4MF ATC 3563-NA8C/NAA8CR ATC 3563-NX8C/NXA8CR ATC 3750-6C ATC 3750-A6CR ATC 3750-IP7-6C ATC 3750-IP7-8M ATC 3750-IP7-WI6CR ATC 3750-IP7-WI8MR
NVIDIA Discrete Card aROK 5510 aROK 8110 aROK 8120-AC4F ATC 8010/8010-F ATC 8110/8110-F ATC 8120-C4F rROK 5520
Hailo Module VTC 1021-HBIoT/HCIoT VTC 7260-5HBIoT/7HBIoT VTC 7260-5HCIoT/7HCIoT
-
Vehicle Mount Computer
-
Vehicle Mount Display
-
IP Rating Computer/Display
Edge AI Telematics Solution ATC 3530
Vehicle Mount Display VMD 3002 VMD 3110
Vehicle Mount Computer VMC 2020
-
In-Vehicle Networking
-
PIS Solution
-
Telematics Solution with Android
Telematics Solution with Android
-
Embedded Add-on Module/Card
Converter VIOB-LTE/EKEY Converter
-
Universal Fitness Console
-
Railway Panel Computer
-
Cyber Security Solutions
Expansion Cards NA 1000-L2X NAI 1000-OS NSK 6301 NSK 6402-NVME/6404-NVME TPM9660-TT
Desktop - Soc Based Appliance DTA 1600
PDTA 1370
PDTA 1372
Desktop - X86 Based Appliance DNA 1160 DNA 1170A DNA 140 DNA 141
Rackmount - SoC Based Appliance
Rackmount - X86 Based Entry Level Appliance NSA 1160/1160A NSA 1170 NSA 3170 NSA 3170A NSA 3170HA NSA 3180A NSA 3180HA NSA 3190A NSA 3200
Rackmount - X86 Based Mainstream Appliance NSA 5181 NSA 5190 NSA 5200
Rackmount - X86 Based Performance Appliance NSA 7150 Series NSA 7160R
LAN Module NC 120FIS4-OS NC 120FMS4 NC 220FMS3-1 ND 180C-OS ND 184CX1-OS NI 140C-OS NI 142CX1 NI 142CX1-OS NI 180C-OS NI 180F-OS NI 184CX1 NI 184CX1-OS NI Series NL 110FI-OS NL 110FM-OS NQ Series NV 120F NV 140F-OS NX 140C-OS NX 140F-OS NX 142FX1 NX 142FX1-LR NX 142FX1-LR-OS NX 142FX1-OS NX Series
-
Edge & Cloud Solutions
5G Edge Solutions FWA over 5G uCPE
nexCPE™ Appliance DFA 1163 Series FTA 1170 FTA 5180
uCPE/Edge Appliance DTA 1160 DTA 1162 DTA 1164W Series DTA 1165
DTA 1376/1376A
DTA 1600
SD-WAN Appliance FTA 5190 NSA 6310/6310-1GE TCA 5170 TCA 5170B TCA 5170C TCA 6710 (ODM Only)
-
OT Security Solutions
-
Network Peripheral Solutions
NVR Solutions PNSA 3170 PNSA 3171/3171A PNSA 3190 PNSA 3280/3280A PNSA 3281/3281A
-
SoC Capability & S/W Services
No Series Page 01 Page 02 Page 03 Page 04 Page 05 Page 06 Page 07 Page 08 Page 09 Page 10 Page 11 Page 12 Page 13 Page 14
-
NVR Hardware Platform
AI NVR Workstation NVAiS 1502 NVAiS 8108
Rackmount NVR Platform NViS 5704 NViS 57244 NViS 6708 NViS 6712
-
Network Camera
Multi Sensor Camera NCp-521F NCp-551G NCp-811F NCp-831G NMP881
PTZ Camera NCs-551-211MSV-R NCs-831-000MSV-RS NCs-831-221MSV-R NDS295PRO
Dome Camera NCi-261 NCi-522 NCi-522C-F28RV3 NCi-822C-F28RV3 NCo-261 NCo-521 NCo-523C-F28RV3 NCo-525C NCo-811 NCo-823C-F28RV3 NCo-832C
-
Industrial Wireless Product
-
Remote Network Management
-
Embedded Computing
-
Video Conference System
-
Software Package
-
HealthCare & Medical
-
Embedded Boards
-
Vertical Applications
-
Computer-on-Modules (CCC)
Design-Win Support Spec-in Service Valiodation Service Value Added Services Design-in Assistance
Customization to Order Service
Business Models introduction
COM Technology
COM Express
ETX
COM Application
Corporate
Bull 1
Bear 0
Routine
Most Viewed News see more
Physical AI Hits the Factory Floor: Predictive Optimization for Chemical Processes The chemical manufacturing industry is vital to Ta...
Open Innovation Platform Helps Shape the Landscape of IoT Applications The Internet of Things (IoT) inspired numerous app...
Edge Computing Shows IIoT Values with Instant Feedback and Response The heated discussion around Industry 4.0 and smar...
Solutions Demo see more
| eSAF for Industry 4.0/Smart Manufacturing Security OT Security by eSAF Micro-Segregation:...eSAF for Industry 4.0/Smart Manufacturing Security |
Video see more
| NEXCOM Outdoor Computer Solution 00:00 Intro 00:34 NEXCOM IP65/ IP67 industrial c...NEXCOM Outdoor Computer Solution |
| Online Catalog 2026 Intelligent Platform & Service in Smart City Product Selection Guide |
Corporate
Find a news: --Select Year-- 2026 2025 2024 2023 2021 2020 2019 2017 2016 2015 2014 2013 2012 2011 --Select One-- IoT Automation Solutions OT Cybersecurity Solution Industrial Wireless Solutions Medical & Healthcare Informatics Intelligent Video Surveillance Intelligent Platform @ Smart City Mobile Computing Solutions Network and Communication Solutions
- October 22, 2026
- NEXCOM Introduces RoboWIZ AI Robotics Platform at GTC Berlin NEXCOM and its robotics subsidiary NexCOBOT will present the RoboWIZ AI Robotics Platform at NVIDIA GTC Berlin, October 20-22, 2026 (Booth 7040). RoboWIZ is an open ecosy...
- August 26, 2026
- NEXCOM Group (8234) Joins Hands with Ecosystem Partners to Build the "RoboWIZ AI Robot Open Platform," Implementing Complete AI Robotics Suites into Practical Applications to Accelerate Robotics Devel NEXCOM & Partners Launch RoboWIZ AI Robot Platform for Humanoid, Quadruped, Dual-Arm Robotics
- June 02, 2026
- NEXCOM (8234) Forges Strategic Collaboration with Qualcomm to Accelerate Embodied AI Robotics Development at COMPUTEX The collaboration aims to build a high-performance development platform, addressing technical barriers in real-time motion control and functional safety for humanoid robo...
- March 16, 2026
- NEXCOM Unveils its First Embodied AI Builder on NVIDIA IGX Thor at NVIDIA GTC At NVIDIA GTC 2026, NEXCOM announced the MARS400 T20, the first humanoid robot builder kit based on the NVIDIA IGX Thor platform (Blackwell architecture). This kit is des...
- November 25, 2025
- NEXCOM and Stereolabs announce collaboration to deliver AI Vision solutions for Mobility, Robotics and Industrial Markets NEXCOM & Stereolabs deliver rugged Edge AI vision. ATC series (IP67, Jetson) integrates ZED X for mobility, robotics, and industrial automation.
- June 11, 2025
- NEXCOM Joins NVIDIA Halos AI Systems Inspection Lab NEXCOM's subsidiary, NexCOBOT joins NVIDIA's first ANAB-accredited Halos AI Systems Inspection Lab, integrating NVIDIA IGX Thor platform with SIL2, PLd Cat.3 certified mo...
- May 07, 2025
- The NEXCOM Group Rebranding Announcement The past decade has witnessed extremely rapid changes in the technology industry. NEXCOM has also continuously adjusted its organizational structure. In the progression o...
- November 22, 2024
- NEXCOM's Cutting-Edge Technology Recognized:Edge AI Mobile Computer and Supercapacitor UPS Clinch2025 Taiwan Excellence Award NEXCOM's Edge AI mobile computer for in-vehicle and rail: ATC 3750-IP7-8M (IP67 AI Intelligent In-Vehicle/Railway Computer) and VTK-SCAP (In-vehicle/Railway Supercapacito...
- May 25, 2023
- NexCOBOT wins Breakthrough Innovation Award from Intel Corporation NexCOBOT announced today that it has been recognized by Intel Corporation with an Intel Partner Award in the category of Breakthrough Innovation. NexCOBOT received this a...
- December 09, 2021
- Three Series of NEXCOM’s In-vehicle/ Railway Computer Prized with The Taiwan Excellence Awards NEXCOM’s "VMC 2020 8-inch Rugged Integrated IP65 Waterproof Vehicle Mount Computer", "aROK 5510 19-inch 2U Rackmount AI Intelligent Railway Computer" and "aROK 8110 Board...
Committed to Customer Success ©2011-2023 NEXCOM International Co., Ltd. All Rights Reserved. Cookie Privacy Sitemap
Take a minute and tell us what you think!
Case Study
Bull 0
Bear 0
Routine
Most Viewed News see more
Physical AI Hits the Factory Floor: Predictive Optimization for Chemical Processes The chemical manufacturing industry is vital to Ta...
Open Innovation Platform Helps Shape the Landscape of IoT Applications The Internet of Things (IoT) inspired numerous app...
Edge Computing Shows IIoT Values with Instant Feedback and Response The heated discussion around Industry 4.0 and smar...
Solutions Demo see more
| eSAF for Industry 4.0/Smart Manufacturing Security OT Security by eSAF Micro-Segregation:...eSAF for Industry 4.0/Smart Manufacturing Security |
Video see more
| NEXCOM Outdoor Computer Solution 00:00 Intro 00:34 NEXCOM IP65/ IP67 industrial c...NEXCOM Outdoor Computer Solution |
| Online Catalog 2026 Intelligent Platform & Service in Smart City Product Selection Guide |
Case Study
Find a news: --Select Year-- 2026 2025 2024 2023 2022 2021 2020 2018 2017 2016 2015 2014 2013 2012 2011 2010 --Select One-- IoT Automation Solutions OT Cybersecurity Solution Industrial Wireless Solutions Medical & Healthcare Informatics Intelligent Video Surveillance Intelligent Platform @ Smart City Mobile Computing Solutions Network and Communication Solutions
- October 22, 2026
- Before the Numbers Could Talk: Verifying Energy Savings at a Water Treatment Plant NEXCOM Industry AIoT modernized a water treatment plant in the Hsinchu region with an integrated energy management system that strengthened measurement, connected legacy ...
- July 28, 2026
- One Platform, 17 Systems, Zero Blind Spots: How a Taiwanese Snack Manufacturer Took Control of Multi-Plant Operations A Taiwanese snack manufacturer unified more than 17 isolated production, energy, water, and environmental systems through a centralized NEXCOM SCADA platform. The solutio...
- May 14, 2026
- Dual 5G Handover for Mission-Critical Rail Transit As rail systems evolve toward smarter, more connected operations across tunnels, rural segments, and mixed public–private coverage zones, connectivity requirements for mo...
- March 16, 2026
- Revolutionizing Real-Time Palm Oil Maturity Inspection with AIEdge-X®310 In Southeast Asia's palm oil industry, consistent and efficient maturity inspection is increasingly important. Traditional visual checks are slow, subjective, and affecte...
- December 17, 2025
- Urban PET Recycling Reinvented Sustainable Solutions Powered by NDiS B561 To combat long-lasting PET bottle waste and urban pollution, smart PET recycling kiosks were deployed on city sidewalks to make recycling more accessible and habitual. Th...
- October 29, 2025
- Enhancing Logistics Efficiency with NDiS B561 Integrated Dimensioning Solution Designed for industrial reliability, NEXCOM’s NDiS B561 integrates high-speed data capture, flexible I/O, and fanless performance powered by 13th/12th Gen Intel® Core™ i ...
- October 21, 2025
- Transforming Campus Administration and Services with School AI Management System NEXCOM AIEdge-X310 and Neu-X60 power secure, on-premises EdgeGPT for smart Taiwan school administration. Boost efficiency & data privacy.
- October 08, 2025
- Neu-X102-N50 Powers Automated Garment Management in Hospitals NEXCOM Neu-X102-N50 controls automated hospital garment dispensing cabinets, improving scrub management, inventory, and hygiene with compact, industrial-grade connectivit...
- July 29, 2025
- Transforming Customer Service with Neu-X302 and AI-based Technology Revolutionize retail customer service with the Remote Customer Service System, powered by the Neu-X302 fanless edge AI computer. Address staffing shortages and enhance cu...
- December 31, 2024
- Smarter Highways Ahead: Empowering ETC Systems with Neu-X302-Q and NDiS B561-PoE for Real-Time Tolling and Vehicle Monitoring The modern highway ETC system leverages Neu-X302-Q and NDiS B561-PoE for enhanced efficiency and security. Neu-X302-Q, with its powerful processing capabilities and rugge...
Last Next 11 10 9 8 7 6 5 4 3 2 1
Committed to Customer Success ©2011-2023 NEXCOM International Co., Ltd. All Rights Reserved. Cookie Privacy Sitemap
Take a minute and tell us what you think!
Products
Bull 0
Bear 0
Product/operations
Most Viewed News see more
Physical AI Hits the Factory Floor: Predictive Optimization for Chemical Processes The chemical manufacturing industry is vital to Ta...
Open Innovation Platform Helps Shape the Landscape of IoT Applications The Internet of Things (IoT) inspired numerous app...
Edge Computing Shows IIoT Values with Instant Feedback and Response The heated discussion around Industry 4.0 and smar...
Solutions Demo see more
| eSAF for Industry 4.0/Smart Manufacturing Security OT Security by eSAF Micro-Segregation:...eSAF for Industry 4.0/Smart Manufacturing Security |
Video see more
| NEXCOM Outdoor Computer Solution 00:00 Intro 00:34 NEXCOM IP65/ IP67 industrial c...NEXCOM Outdoor Computer Solution |
| Online Catalog 2026 Intelligent Platform & Service in Smart City Product Selection Guide |
Products
Find a news: --Select Year-- 2026 2025 2024 2023 2022 2021 2020 2019 2018 2017 2016 2015 2014 2013 2012 2011 2010 2009 --Select One-- IoT Automation Solutions OT Cybersecurity Solution Industrial Wireless Solutions Medical & Healthcare Informatics Intelligent Video Surveillance Intelligent Platform @ Smart City Mobile Computing Solutions Network and Communication Solutions
- October 22, 2026
- Smarter Warehouse & Logistics Inspection Starts at the Edge with NDiS B340 The NEXCOM NDiS B340 is a compact, fanless box PC built for camera-based inspection in warehouses and logistics centers. Its aluminum enclosure handles dust, vibration, a...
- September 17, 2026
- Store More Video. Unlock More Intelligence with NViS 6712 NEXCOM NViS 6712 is a 2U AI-ready NVR built for high-capacity video retention, concurrent VMS workloads, and scalable analytics. It combines 12 HDD bays with up to 312 TB...
- July 28, 2026
- Bringing Smart City Applications to Users’ Fingertips with the XPPD Series NEXCOM XPPD Series embedded touchscreen displays: 10.1", 15.6", 23.8" options with 10-point PCAP touch, IP66 protection & anti-smudge coating for kiosks.
- July 22, 2026
- Built for Continuous Play: Neu-XE105 Powers Modern Gaming Cabinets Optimize gaming cabinets with the NEXCOM Neu-XE105. This fanless edge computer features an Intel Processor N50 with a 6W TDP, rich USB/COM connectivity, and reliable 24/7...
- July 22, 2026
- Fanless Rackmount Edge AI Computer Built for Modern Railway Applications Empower smart rail ops with NEXCOM rROK 5520. This 2U fanless railway PC features Intel Core Ultra, NVIDIA RTX Ada GPUs, and EN 50155 certification for AI analytics and s...
- July 21, 2026
- Expand Beyond Limits: Unlocking New Possibilities with DockInfinity Maximize edge computing with NEXCOM DockInfinity. Easily add GPUs and PCIe cards to Duro Edge systems to scale industrial workloads and reduce waste.
- May 22, 2026
- Edge Intelligence: Smarter Care Beyond Limits Edge AI is transforming kiosks, signage, retail displays, and bedside terminals with smarter, faster user experiences.
- May 11, 2026
- Always Connected in Motion: VTC 1040 and nROK 1040 Power Mobile Gateways from Road to Rail Streamline fleet and rail connectivity with VTC 1040 and nROK 1040. These EN 50155-certified 5G mobile gateways offer PoE camera support, CAN FD, and GNSS for real-time v...
- April 09, 2026
- Reimagine Self-Checkout with the XPPC 16-201-125U and AI-Driven Edge Intelligence Upgrade retail with the XPPC 16-201-125U. This Intel® Core™ Ultra Fanless Panel PC uses NPU-driven Edge AI for seamless self-checkout, item recognition, and rugged, IP65-...
- January 14, 2026
- Smarter Healthcare Self-Service Starts with Neu-XE102 & XE104 Edge Computing Boost smart healthcare kiosks with NEXCOM’s Neu-XE102 & Neu-XE104. Fanless, low-power edge computing with up to 14 COM ports for seamless payments.
Last Next 46 45 44 43 42 41 40 39 38 37 36 35 34 33 32 31 30 29 28 27 26 25 24 23 22 21 20 19 18 17 16 15 14 13 12 11 10 9 8 7 6 5 4 3 2 1
Committed to Customer Success ©2011-2023 NEXCOM International Co., Ltd. All Rights Reserved. Cookie Privacy Sitemap
Take a minute and tell us what you think!
What Is Manufacturing Process Automation? Types, Benefits, Use Cases, and 7 Implementation Steps
Bull 0
Bear 0
Routine
Most Viewed News see more
Physical AI Hits the Factory Floor: Predictive Optimization for Chemical Processes The chemical manufacturing industry is vital to Ta...
Open Innovation Platform Helps Shape the Landscape of IoT Applications The Internet of Things (IoT) inspired numerous app...
Edge Computing Shows IIoT Values with Instant Feedback and Response The heated discussion around Industry 4.0 and smar...
October 21, 2026
What Is Manufacturing Process Automation? Types, Benefits, Use Cases, and 7 Implementation Steps

Manufacturers face pressure to increase output, maintain consistent product quality, control operating costs, and respond quickly to changing production demands. Labor shortages, aging equipment, and increasingly complex production systems add further operational challenges. Automation helps manufacturers execute production tasks with less manual intervention while improving visibility and control.
This guide explains the major types of manufacturing process automation, how automation differs across production environments, key benefits and smart factory applications, and seven practical steps for implementation.
What is Manufacturing Process Automation?
Manufacturing process automation is the use of industrial control and computing technologies to automatically monitor, control, and execute manufacturing operations.
Automated systems can collect sensor data, control equipment, move materials, inspect products, and trigger predefined responses according to real-time production conditions.
Common technologies include programmable logic controllers (PLCs) , programmable automation controllers (PACs), industrial PCs, human-machine interfaces (HMIs) , industrial input/output (I/O) systems, motion controllers, machine vision systems, industrial robots, and Industrial Internet of Things (IIoT) platforms.
In most manufacturing environments, automation targets repetitive, precision-sensitive, hazardous, or data-intensive operations while operators and engineers focus on supervision, troubleshooting, and process improvement.
4 Main Types of Manufacturing Automation
Manufacturing automation can be categorized according to how equipment and control systems are configured to handle production volume, product variation, and changeovers.
Fixed automation uses dedicated equipment and predefined sequences for high-volume, repetitive production. It is commonly applied where products and processes change infrequently.
Programmable automation allows equipment to be reprogrammed for different products or production batches. This approach is useful where manufacturers produce multiple variants but can accommodate planned changeover time.
Flexible automation supports greater product variation with shorter changeovers. Equipment, controls, and software can adapt more quickly as production requirements change.
Integrated automation connects multiple machines, control systems, data sources, and software platforms into a coordinated production environment. This can extend automation beyond individual machines to production cells, lines, or broader factory operations.
Manufacturing Automation Across Discrete, Batch, and Continuous Production
Manufacturing automation also varies according to the production environment. Discrete, batch, and continuous manufacturing involve different materials, workflows, control requirements, and automation technologies.
| Manufacturing Environment | How Production Works | Typical Industries | Common Automation Technologies |
|---|---|---|---|
| Discrete Manufacturing | Individual products move through defined production steps | Electronics, automotive, machinery | PLC, PAC, motion control, robotics, machine vision |
| Batch Process | Products are made in defined quantities according to recipes or sequences | Food, pharmaceuticals, specialty chemicals | Batch control, sensors, HMI, recipe management |
| Continuous Process | Materials continuously flow while process variables are constantly controlled | Chemical, energy, water treatment | Process controllers, Distributed Control System (DCS), sensors, Supervisory Control and Data Acquisition (SCADA) |
Discrete manufacturing automation deals with individual, countable products. Production may involve detecting a component, positioning it, performing an assembly task, inspecting the result, and transferring it to the next workstation. Robotics, motion control, machine vision, sensing, and real-time industrial communication are therefore common technologies in discrete manufacturing.
Batch process automation controls production according to defined quantities, sequences, and recipes. The ISA-88 batch control standards provide common models and terminology for equipment structures, recipes, and batch production information.
Continuous process automation manages processes in which variables such as temperature, pressure, flow, or level require continuous control. ISA-106 guides automating procedures in continuous process operations.
Automation can therefore take different forms across discrete, batch, and continuous production. The application examples later in this guide focus primarily on discrete manufacturing and smart factory applications, including machine automation, robotics, machine vision, material handling, and edge computing.
Key Advantages of Manufacturing Process Automation
Increased Productivity and Efficiency
Automation reduces repetitive manual handling, shortens cycle times, and coordinates production stages more efficiently.
For example, an automated production cell can integrate machine loading, robotic assembly, inspection, and unloading. Real-time equipment data also helps manufacturers identify idle or underperforming machines and improve utilization.
Enhanced Product Quality and Consistency
Automated systems can improve assembly accuracy, maintain consistent machine parameters, detect defects, and collect digital quality records.
Machine vision enables inspection directly on the production line, allowing manufacturers to identify quality issues in the production process.
Reduced Operational and Labor Costs
Automation can reduce manual effort across repetitive production, inspection, material transport, and monitoring tasks.
Manufacturers should assess the total lifecycle value of an automation project, including hardware, software, system integration, maintenance, networking, cybersecurity, and employee training.
Improved Workplace Safety
Automation can reduce worker exposure to hazardous production conditions. Industrial robots and automated equipment can support machine tending, heavy material handling, welding, repetitive assembly, and pallet movement.
Industrial robot systems require system-level safety measures. Key considerations include safe design, risk reduction, and appropriate safety information.
Sensors, safety controllers, emergency-stop mechanisms, risk assessment, and functional safety therefore remain important components of automated production environments. The ISO 10218-2:2025 standard addresses industrial robot application and robot cell safety requirements.
Core Applications and Use Cases in Smart Factories
Four common discrete manufacturing applications are automated inspection, robotic assembly, material handling, and equipment maintenance.
1. Quality Control with Machine Vision
Machine vision uses cameras, lighting, industrial computing, and image-processing software to automatically inspect products.
Typical applications include:
- Surface and dimensional defect inspection
- Component presence and assembly verification
- Label and barcode inspection
- Packaging quality inspection
A camera captures product images on the production line, while a local computing system evaluates whether predefined quality requirements are met.
Rule-based machine vision is commonly used for predefined inspection criteria, while AI-based approaches offer added flexibility when visual patterns or defects vary. Edge computing enables these inspection decisions to occur close to production equipment.
2. Robotic Arms for Assembly Processes
Industrial robots automate repetitive or precision-sensitive movements such as pick-and-place, assembly, screwdriving, welding, dispensing, machine tending, packaging, and palletizing.
A robotic automation system combines motion controllers, servo systems, sensors, industrial computing, machine vision, and industrial networking to coordinate robot movement and production tasks.
At COMPUTEX 2026 , NEXCOM demonstrated a dual-arm smart manufacturing system that combines AI vision-based trajectory planning with real-time robotic motion control for precision assembly, showing how visual perception, edge AI, and deterministic control can work together in the same manufacturing application.
3. Material Handling with AGVs and AMRs
Automated Guided Vehicles (AGVs) typically follow predefined routes or navigate within constraints. Autonomous Mobile Robots (AMRs) generally use onboard sensing, localization, mapping, and dynamic path planning for greater flexibility in changing environments.
Both can automate raw-material delivery, line-side replenishment, work-in-process transfer, and finished-goods transportation.
Reliable industrial computing, communications, fleet management, cybersecurity, and factory-system integration are important supporting elements for automated material handling.
4. Condition Monitoring and Predictive Maintenance
Predictive maintenance uses equipment data to identify signs of deterioration before failure. Manufacturers may monitor:
- Vibration and temperature
- Motor current and energy consumption
- Pressure and other process conditions
- Cycle time and operating hours
- Machine alarms and abnormal events
Sensors and data acquisition systems collect operating information, while edge computers or analytics systems identify abnormal conditions and trends. When a defined threshold or abnormal pattern is detected, the system can generate an alert or maintenance notification for further investigation.
For example, increasing motor vibration may indicate a developing mechanical issue. Maintenance teams can use this information to prioritize inspections and maintenance based on actual equipment condition.
7 Steps to Implement Manufacturing Process Automation
Step 1: Assess Current Processes
Identify where automation can create measurable value. Good candidates include processes with repetitive manual work, production bottlenecks, high defect rates, frequent downtime, safety risks, or limited equipment visibility.
Also evaluate existing equipment, especially in a brownfield factory, where older machines may remain mechanically reliable but lack modern connectivity. Sensors, industrial I/O, data acquisition systems, or gateways can provide access to machine data while preserving existing production assets.
Prioritize the processes with the greatest potential operational impact.
Step 2: Define Clear Objectives and KPIs
Define specific and measurable automation objectives. Targets may include increasing throughput, reducing cycle time or defect rates, improving Overall Equipment Effectiveness (OEE) , lowering unplanned downtime, or improving traceability and safety.
An automated inspection project, for example, can be evaluated by inspection time, defect detection rate, false rejection rate, and production yield. Clear KPIs help manufacturers assess operational value and ROI.
Step 3: Select the Right Automation Technologies
Different manufacturing problems require different technologies.
| Manufacturing Problem | Possible Automation Technology |
|---|---|
| Manual visual inspection | Machine vision / Edge AI |
| Repetitive assembly | Industrial robot + motion control |
| Legacy machine data unavailable | Data acquisition / IIoT gateway |
| Frequent equipment failures | Sensors + edge analytics |
| Manual material transport | AGV / AMR |
| Limited machine or production visibility | Data acquisition + HMI / SCADA / IIoT platform |
Technology selection should consider interoperability, real-time response, industrial conditions, scalability, lifecycle availability, cybersecurity, and functional safety.
Cybersecurity is particularly important in connected Operational Technology (OT) environments, which have unique performance, reliability, and safety requirements. Incorporate these requirements into the automation architecture from the design stage. The NIST SP 800-82 Rev. 3 guidance provides cybersecurity guidance for OT systems.
Step 4: Develop a Strategic Implementation Plan
Before large-scale deployment, manufacturers should define the overall automation architecture, including project scope, budget, hardware and software requirements, networking, legacy equipment integration, cybersecurity, functional safety, implementation timing, workforce training, and success criteria.
System integration is critical because machines, inspection equipment, production software, and control systems need to exchange information across the manufacturing environment.
ISA-95 provides a widely used model for connecting plant-floor control with manufacturing operations and enterprise systems.
Step 5: Conduct Pilot Testing
A pilot can validate an automation concept on one machine, production cell, inspection station, robotic application, or material-handling route.
Evaluate cycle time, accuracy, system integration, network reliability, maintenance requirements, safety, and operator workflow against the KPIs defined earlier.
Step 6: Execute Full Deployment and Workforce Training
Full deployment may include hardware installation, control-system configuration, industrial networking, software integration, system commissioning, cybersecurity configuration, and safety validation.
Train operators, engineers, and maintenance personnel to monitor equipment status, respond to alarms, perform basic troubleshooting, and safely intervene when required.
Step 7: Monitor Performance and Continuously Optimize
After deployment, track metrics such as OEE, throughput, cycle time, defect rate, production yield, downtime, and equipment availability.
Production data can refine control parameters, optimize robotic motion, adjust machine vision models, improve maintenance schedules, and identify additional automation opportunities.
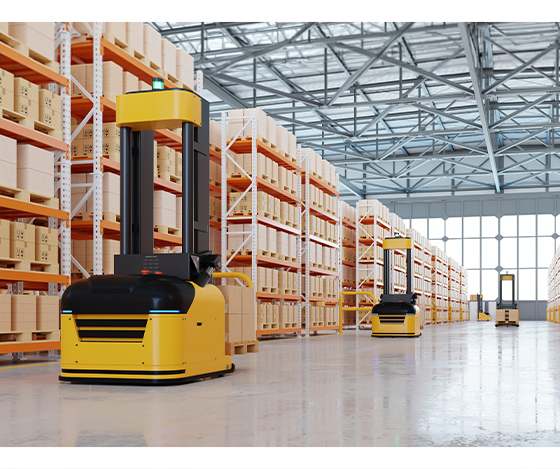
How Manufacturing Automation Is Evolving
Manufacturing automation is expanding beyond individual machines and predefined control sequences as production systems become more connected and data-driven.
IIoT Connects Machines and Production Data
Industrial IoT (IIoT) connects machines, sensors, controllers, industrial computers, and software platforms across the factory. This allows production data to move beyond individual machines and become available for monitoring, analysis, coordination, and integration with broader manufacturing systems.
Edge AI Brings Intelligence Closer to Production
AI and machine learning can extend conventional automation into applications such as visual inspection, anomaly detection, predictive maintenance, robotic perception, and production optimization. Combined with edge computing, time-sensitive data can be processed close to machines and production equipment, while selected results are shared with higher-level systems.
Digital Twins Add Simulation and Operational Context
Digital twins use operational data to create digital representations of machines, assets, or production processes. Manufacturers can use these representations to visualize equipment status, evaluate operating scenarios, simulate production changes, and support maintenance or optimization decisions.
From Machine Control to Factory-Level Optimization
Together, edge AI, IIoT, and digital twins extend automation beyond individual control tasks toward more connected production architectures: Machine control → production data → edge intelligence → operational decisions → factory-level optimization. This progression allows manufacturers to connect automation, computing, and production information across a broader smart factory environment.
Partner with NEXCOM for Your Manufacturing Automation Strategy
Manufacturing automation often spans several architectural layers, from acquiring machine data and controlling equipment to operator visualization, robotics, edge computing, and factory-level integration.
NEXCOM Industry AIoT (NexAIoT Co., Ltd.) provides smart manufacturing technologies across these layers. The nDAS 6000 series acquires machine and process data, nPAC 2000 combines PLC control with edge computing, nHMI provides operator visualization and control, and the iAT3000 AIoT platform connects production data and systems at the factory level. For advanced robotic applications, NEXCOM Robotic Solutions (NexCOBOT Co., Ltd.) provides platforms such as MARS400 for robotic and AI workloads.
This layered approach is particularly relevant to brownfield factories, where manufacturers may begin by connecting existing equipment and then expand automation according to production requirements. Data acquisition, control, visualization, edge intelligence, robotics, networking, and higher-level integration can be added as the architecture evolves.
By treating automation as a connected architecture rather than a collection of isolated machines, manufacturers can create a more scalable foundation for future production requirements. For manufacturing automation, edge computing, robotics, or factory integration requirements, contact NEXCOM to discuss the appropriate architecture for your production environment.
-
Related Links:
-
Browse Other News:
-
Smarter Warehouse & Logistics Inspection Starts at the Edge with NDiS B340
-
NEXCOM Introduces RoboWIZ AI Robotics Platform at GTC Berlin
Committed to Customer Success ©2011-2023 NEXCOM International Co., Ltd. All Rights Reserved. Cookie Privacy Sitemap
Take a minute and tell us what you think!
What Is ROS 2? Architecture, ROS 1 vs. ROS 2, and Migration Guide
Bull 0
Bear 0
Other
Most Viewed News see more
Physical AI Hits the Factory Floor: Predictive Optimization for Chemical Processes The chemical manufacturing industry is vital to Ta...
Open Innovation Platform Helps Shape the Landscape of IoT Applications The Internet of Things (IoT) inspired numerous app...
Edge Computing Shows IIoT Values with Instant Feedback and Response The heated discussion around Industry 4.0 and smar...
October 21, 2026
What Is ROS 2? Architecture, ROS 1 vs. ROS 2, and Migration Guide

ROS 2, short for Robot Operating System 2, is an open-source framework for developing robotics applications. Despite its name, it is not a conventional operating system such as Linux or Windows. Instead, ROS 2 provides libraries, communication mechanisms, development tools, and interfaces for connecting robotic software components.
Modern robots depend on multiple software components working together: sensors collect environmental data, perception algorithms interpret it, planners determine the next movement, and controllers translate decisions into physical actions. ROS 2 provides the software framework and communication layer that allows these components to operate as a distributed robotic system.
ROS 2 was developed to support requirements that became increasingly important as robotics moved from research prototypes into commercial and industrial deployment, including distributed computing, configurable Quality of Service (QoS), security, and time-sensitive communication.
With ROS 1 Noetic reaching End of Life (EOL) on May 31, 2025, understanding these differences has also become important for teams planning the long-term maintenance or migration of existing ROS 1 systems.
What Is ROS 2 (Robot Operating System 2)?
ROS 2 organizes a robotics application as a set of modular software components called nodes. Each node can handle a specific function, such as reading a camera, estimating the robot's position, planning a route, or issuing motion commands.
Nodes exchange information through communication patterns that match the task: topics for continuous data streams, services for short request-and-response interactions, and actions for longer-running operations that provide feedback or support cancellation.
This modular structure lets developers separate perception, localization, planning, control, and other functions while deploying them across one or more processes or computers.
Why Was ROS 2 Developed?
ROS 1 became widely used for robotics research and prototyping, but its architecture predates many requirements that became increasingly important, as robots grew more distributed and commercially deployed.
ROS 2 was designed around these requirements. Its middleware architecture separates the ROS application layer from the underlying communication technology, giving developers more flexibility when deploying robotics software across different processes, computers, and networks.
These changes are particularly relevant to autonomous mobile robots (AMRs), industrial robots, humanoid robots, and other autonomous machines in which many sensors, computers, and software components need to exchange data continuously.
Core Concepts and Architecture of ROS 2
At the architecture level, ROS 2 combines application-level nodes and communication interfaces with a middleware layer that handles functions such as discovery and data transport.
DDS Middleware Architecture
ROS 2 does not hard-code a single transport layer. It uses the ROS Middleware Interface (RMW) to connect ROS APIs to interchangeable middleware implementations, many of which are based on Data Distribution Service (DDS) and use the Real-Time Publish-Subscribe wire protocol.
DDS is a standardized publish/subscribe middleware framework. Publishers send data while subscribers receive the data they need, and the Object Management Group Data Distribution Service specification defines data exchange and Quality of Service controls for distributed applications.
The RMW abstraction means developers normally work through ROS 2 interfaces rather than programming against a middleware implementation directly. The selected middleware then handles functions such as discovery, serialization, and data transport.
This separation supports distributed deployments in which cameras, controllers, AI computers, operator interfaces, and other components run across multiple processes or physical computers.
Nodes, Topics, and Discovery Mechanism
A node is a ROS 2 software component responsible for a particular function. A robot might have one node reading a camera, another estimating position, another planning a route, and another issuing motion commands.
A topic is a named channel for one-way publish/subscribe communication. A camera node might publish image data, while one or more perception nodes subscribe to that topic.
ROS 2 also supports automatic discovery. With DDS-based middleware, nodes can find one another and establish communication without relying on the central ROS Master used in ROS 1, while discovery behavior can be configured for different network environments.
As deployments grow, discovery traffic may need additional management. Some middleware implementations support discovery-server configurations, such as Fast DDS Discovery Server, to reduce or control peer-discovery traffic in larger robot networks.
Services and Actions Communication Model
ROS 2 services handle short request-and-response interactions, such as when one node requests the robot's current joint positions from another.
Actions are designed for longer-running operations. A navigation action can receive a destination, provide progress feedback while the robot moves, accept cancellation, and return a final result.
The distinction is practical: topics suit continuous data, services suit discrete requests, and actions suit tasks that unfold over time.
Choosing the interface based on the interaction pattern keeps communication semantics explicit as a robotics application grows.
ROS 1 vs. ROS 2: What Are the Biggest Differences?
ROS 2 preserves many familiar ROS concepts, but the key differences are most visible in discovery, middleware, QoS, real-time support, security, build tools, and platform support.
| Area | ROS 1 | ROS 2 |
|---|---|---|
| Discovery | Uses a central ROS Master | Automatic node discovery without a central ROS Master |
| Communication | TCPROS/UDPROS transports | RMW middleware layer, commonly DDS-based |
| QoS | Limited delivery controls | Configurable QoS policies |
| Real-time support | Not designed for real-time use cases | Designed to support real-time use cases |
| Security | Limited built-in security | DDS-Security support |
| Build tools | catkin | ament + colcon |
| Platforms | Primarily Linux | Multiple supported operating systems |
Centralized vs. Decentralized Communication
ROS 1 uses a ROS Master for node registration and name lookup, although message data can flow directly between nodes after a connection is established. ROS 2 removes this mandatory discovery point and normally relies on middleware-driven distributed discovery.
For robot architecture, this makes it easier to distribute perception, planning, control, and monitoring nodes across multiple computers or robots without depending on one ROS Master for discovery. The advantage becomes especially relevant as a system grows beyond a single computer.
Decentralized discovery does not eliminate network design work. Larger ROS 2 deployments may need to tune discovery behavior, network topology, or middleware configuration, and some implementations provide options such as Fast DDS Discovery Server to control discovery traffic.
Real-Time Performance and QoS Policies
ROS 1 and ROS 2 also differ in how much control developers have over message delivery. A robotics application may tolerate an occasional dropped camera frame while requiring robot-state updates to arrive reliably and within a defined time window.
ROS 2 exposes Quality of Service (QoS) policies for properties such as reliability, message history, deadlines, data lifespan, and liveliness. These controls let developers match communication behavior to the requirements of each data stream rather than applying one delivery model across the system.
Real-time behavior depends on the entire system. Operating-system scheduling, middleware configuration, memory management, hardware, and application code all affect timing. ROS 2 can support more predictable time-sensitive applications, but it does not by itself guarantee hard real-time performance or functional safety.
Security and Multi-Platform Support
Compared with ROS 1's limited built-in security mechanisms, ROS 2 can integrate DDS-Security features for authentication, access control, and encrypted communication. The ROS 2 DDS-Security integration design describes how these mechanisms fit into the ROS 2 architecture.
ROS 2 also supports multiple platforms, with support levels defined for each release. REP 2000 specifies the operating systems, architectures, and middleware implementations targeted by each ROS 2 distribution.
Development Tools and Build System Improvements
ROS applications are organized into packages, which group together the code, configuration, and dependencies needed for a particular function. Before those packages can run, they need to be built into a usable form.
ROS 1 commonly uses catkin for this process. ROS 2 uses ament to define how individual packages are built and installed, while colcon handles a workspace containing multiple packages by finding them, resolving their dependency order, and building them in the correct sequence.
ROS 2 also provides a command-line interface and launch files in XML, YAML, or Python for starting, inspecting, and managing applications composed of multiple packages.
Why Migrate to ROS 2?
ROS Noetic Ninjemys was the final ROS 1 distribution. When it reached End of Life on May 31, 2025, official maintenance for ROS 1 ended with it. Existing ROS 1 systems can continue to operate, but teams that remain on ROS 1 must now take greater responsibility for security fixes, dependency maintenance, compatibility issues, and long-term software support. For organizations developing or maintaining commercial robots, that changes ROS 2 migration from a feature-driven upgrade into a lifecycle planning decision.
ROS 1 Noetic Has Reached End of Life
End of Life does not mean existing ROS 1 systems stop working.
The official ROS 1 Noetic EOL notice states that the ROS project no longer provides new features, security updates, bug fixes, patches, or updated binaries for ROS 1. Teams that continue using ROS 1 therefore assume more of the maintenance burden themselves, including keeping dependencies compatible and addressing future security or operating-system changes.
That distinction matters for commercial robotics products with multi-year service lives. A system may still function today, but maintaining it over the next several years becomes more difficult when the underlying framework is no longer officially supported.
A Practical ROS 1-to-ROS 2 Migration Path
Migrating from ROS 1 to ROS 2 does not necessarily require moving every package at once. A practical migration usually starts with an inventory of the existing ROS 1 system: packages, custom messages and services, external dependencies, operating-system requirements, and hardware or other software interfaces.
Next, teams can determine which dependencies already have ROS 2 equivalents and which packages need to be ported, replaced, or redesigned. Packages with fewer dependencies are often easier to migrate first , while heavily interconnected components may need to remain on ROS 1 temporarily.
During a staged transition, the ros1_bridge package lets ROS 1 and ROS 2 components exchange messages and services. Standard interfaces can often be bridged directly, while custom interfaces may require building the bridge from source.
Migration should also include validation of the target ROS 2 distribution, operating system, middleware implementation, QoS configuration, hardware interfaces, and application timing requirements. A package that compiles successfully may still require communication or architectural changes to behave correctly under ROS 2.
Because ros1_bridge compatibility depends on the ROS 1, ROS 2, and operating-system versions in use, it is generally best treated as a transition mechanism rather than the final long-term architecture.
Long-Term Benefits of ROS 2 Adoption
Moving to ROS 2 shifts a robotics codebase to an actively maintained ecosystem and a platform designed for current distributed robotics development. For products with long service lives, that reduces dependence on the unsupported ROS 1 stack and makes it easier to align with supported operating systems, middleware, and tooling.
Migration effort also depends on package dependencies. A package can only migrate once its dependencies are available in ROS 2; some packages can retain much of their existing source code, while others require more extensive redesign.
The Advantages of ROS 2 for Industrial Robotics and Humanoid Robots
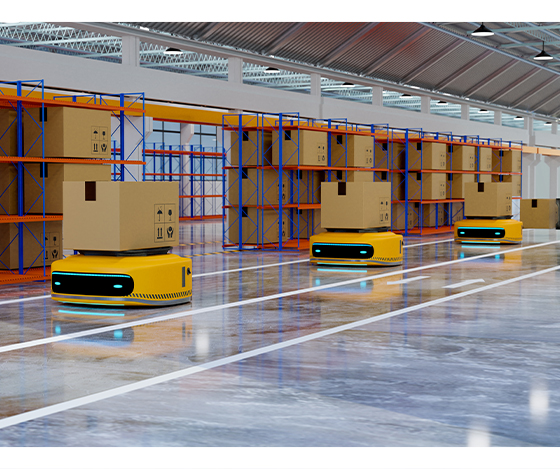
Industrial and humanoid robots combine perception, AI inference, motion planning, control, sensor fusion, and connectivity, often across several onboard or nearby computers. ROS 2 provides the communication structure for coordinating these software workloads without forcing them into a single process or machine.
Scalability for Multi-Robot Systems
For multi-robot systems, distributed discovery and publish/subscribe communication let ROS 2 applications span multiple processes and computers. The same architecture can therefore support fleets of AMRs, coordinated robots, and complex machines with several embedded computers.
Scaling the ROS 2 graph is only part of fleet scalability. Network topology, middleware selection, discovery settings, message rates, and application design still determine how efficiently communication behaves as the number of robots and connected systems grows.
QoS for Time-Sensitive Robot Communication
In industrial robots, QoS becomes useful when different data streams carry different operational importance. High-rate sensor data, robot-state updates, control messages, and status information can be assigned different reliability or timing behavior instead of being treated identically.
That flexibility can make communication more predictable for time-sensitive workloads. ROS 2, however, does not provide functional safety on its own or guarantee hard real-time performance.
For industrial robot applications, ISO 10218-2:2025 addresses safety at the system and integration level, including commissioning, operation, maintenance, and decommissioning of industrial robot applications and robot cells. ROS 2 communication performance is therefore only one part of the overall safety architecture.
Integration with Edge Computing and IIoT
Robotics applications increasingly place perception and AI inference on onboard or nearby edge computers so time-sensitive processing does not depend on a remote cloud connection.
ROS 2's distributed architecture lets robot software communicate across onboard computers and edge controllers. At the factory level, gateways or integration software can then expose selected robot data to Industrial Internet of Things (IIoT) platforms, manufacturing systems, databases, or other enterprise applications.
For AI robotics, the NVIDIA Isaac ROS platform provides GPU-accelerated ROS 2 packages and AI models for workloads such as perception, localization, mapping, and autonomous systems. Isaac ROS supports NVIDIA Jetson platforms, including Jetson Thor, but the supported ROS 2 distribution, JetPack version, and hardware combination depend on the Isaac ROS release. Teams should therefore verify the current NVIDIA support matrix when defining the software stack.
NEXCOM Robotic Solutions for ROS 2 and AI Workloads
NEXCOM Robotic Solutions (NexCOBOT Co., Ltd.) offers the MARS400 T10-05 robotic controller , powered by NVIDIA Jetson T5000. Its Blackwell GPU and 128 GB LPDDR5X support perception and AI inference, while eight GMSL, four Gigabit Ethernet, and four USB 3.2 Gen2 interfaces connect cameras, sensors, peripherals, and networked robot components.
Because the MARS400 T10-05 uses Jetson T5000, it belongs to the Jetson Thor platform family supported by current Isaac ROS releases. This makes it relevant for teams evaluating NVIDIA-accelerated ROS 2 workloads, but teams should always validate the target Isaac ROS release, JetPack version, ROS 2 distribution, and hardware configuration together before deployment.
The NEXCOM RCB400 T20-05 industrial AI control board uses the NVIDIA IGX T5000 industrial module and is positioned for intelligent robotics, motion control, AI-driven automation, humanoid robots, AMRs, smart manufacturing, and medical edge systems. The board provides CAN FD, serial communication, GPIO, and optional GMSL connectivity, and it includes functional-safety-oriented hardware such as NVIDIA's Functional Safety Island and support for a safety MCU through the EBK-210 expansion board.
These features bring AI computing, industrial I/O, and functional-safety-oriented hardware onto the same control platform. Final software compatibility, safety targets, and certification requirements remain system-level engineering decisions.
NEXCOM Bridges AI Computing and Industrial Robot Control
For teams adopting ROS 2, computing hardware is part of the robotics architecture rather than a separate afterthought. AI perception, multi-camera input, robot control, networking, and safety-related workloads place different demands on processors, interfaces, thermal design, lifecycle support, and system integration.
NEXCOM Robotic Solutions provides platforms including the MARS400 T10-05 and RCB400 T20-05 for advanced robotics and edge AI architectures. For ROS 2, NVIDIA-accelerated robotics, motion control, edge AI, or customized robotics requirements, contact NEXCOM to discuss the computing architecture for your application.
-
Related Links:
-
What Is Manufacturing Process Automation? Types, Benefits, Use Cases, and 7 Implementation Steps
-
Hybrid Cloud Video Surveillance Architecture: What Stays Local and What Moves to the Cloud
-
Browse Other News:
-
Smarter Warehouse & Logistics Inspection Starts at the Edge with NDiS B340
-
NEXCOM Introduces RoboWIZ AI Robotics Platform at GTC Berlin
Committed to Customer Success ©2011-2023 NEXCOM International Co., Ltd. All Rights Reserved. Cookie Privacy Sitemap
Take a minute and tell us what you think!
Blog
Bull 0
Bear 0
Routine
Most Viewed News see more
Physical AI Hits the Factory Floor: Predictive Optimization for Chemical Processes The chemical manufacturing industry is vital to Ta...
Open Innovation Platform Helps Shape the Landscape of IoT Applications The Internet of Things (IoT) inspired numerous app...
Edge Computing Shows IIoT Values with Instant Feedback and Response The heated discussion around Industry 4.0 and smar...
Solutions Demo see more
| eSAF for Industry 4.0/Smart Manufacturing Security OT Security by eSAF Micro-Segregation:...eSAF for Industry 4.0/Smart Manufacturing Security |
Video see more
| NEXCOM Outdoor Computer Solution 00:00 Intro 00:34 NEXCOM IP65/ IP67 industrial c...NEXCOM Outdoor Computer Solution |
| Online Catalog 2026 Intelligent Platform & Service in Smart City Product Selection Guide |
Blog
Find a news: --Select Year-- 2026 2025 --Select One-- IoT Automation Solutions OT Cybersecurity Solution Industrial Wireless Solutions Medical & Healthcare Informatics Intelligent Video Surveillance Intelligent Platform @ Smart City Mobile Computing Solutions Network and Communication Solutions
- October 21, 2026
- What Is ROS 2? Architecture, ROS 1 vs. ROS 2, and Migration Guide ROS 2 provides a modular framework for developing distributed robotic systems. This guide explains its architecture, middleware, communication mechanisms, and advantages ...
- October 21, 2026
- What Is Manufacturing Process Automation? Types, Benefits, Use Cases, and 7 Implementation Steps Manufacturing process automation uses industrial control, computing, robotics, and connected technologies to improve production efficiency, quality, and operational visib...
- October 19, 2026
- Hybrid Cloud Video Surveillance Architecture: What Stays Local and What Moves to the Cloud Learn how hybrid cloud video surveillance systems divide recording, monitoring, analytics, and multi-site access across local, central, and cloud infrastructure. This gui...
- October 12, 2026
- What is an Industrial IoT Gateway? The Ultimate Guide for Industry 4.0 Learn how industrial IoT gateways connect factory equipment with IT and cloud systems. This guide covers protocol translation, edge processing, cybersecurity, rugged desi...
- October 12, 2026
- What Is an Industrial Robot Controller? A Complete Guide Explore how industrial robot controllers coordinate motion, feedback, communication, and safety. This guide explains core components, controller types, AI and edge comput...
- September 24, 2026
- Managed vs Unmanaged Switch: The Ultimate Comparison Guide & What Is a PoE Switch? Compare managed vs unmanaged switches, learn what a PoE switch is, and discover how Layer 3 managed switches support industrial networks.
- September 24, 2026
- EtherCAT vs. EtherNet/IP: A Complete Comparison for High-Speed Motion Control Compare EtherCAT vs. EtherNet/IP for industrial automation. Learn the key differences in speed, determinism, topology, cost, and suitability for robotics and high-speed m...
- September 07, 2026
- EtherCAT Protocol Explained: Architecture, Working Principles, and Key Benefits Learn how the EtherCAT protocol works, why it delivers deterministic industrial communication, how it compares with other protocols, and how NEXCOM supports high-performa...
- September 07, 2026
- Understanding SIL2 in Functional Safety Systems The transition to software-defined manufacturing and collaborative robotics has fundamentally altered the industrial risk profile. In environments where human operators s...
- September 07, 2026
- Understanding the Different Types of Ethernet Switches for Modern Networks Learn the different types of Ethernet switches by management level, form factor, network layer, port speed, and industrial automation needs. Explore how Layer 3 switches ...
Committed to Customer Success ©2011-2023 NEXCOM International Co., Ltd. All Rights Reserved. Cookie Privacy Sitemap
Take a minute and tell us what you think!
What is an Industrial IoT Gateway? The Ultimate Guide for Industry 4.0
Bull 0
Bear 0
Other
Most Viewed News see more
Physical AI Hits the Factory Floor: Predictive Optimization for Chemical Processes The chemical manufacturing industry is vital to Ta...
Open Innovation Platform Helps Shape the Landscape of IoT Applications The Internet of Things (IoT) inspired numerous app...
Edge Computing Shows IIoT Values with Instant Feedback and Response The heated discussion around Industry 4.0 and smar...
October 12, 2026
What is an Industrial IoT Gateway? The Ultimate Guide for Industry 4.0
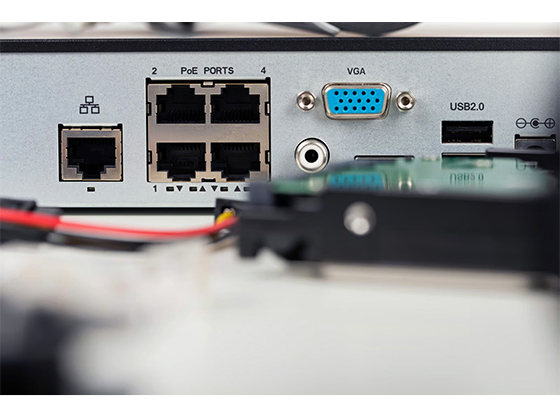
Industry 4.0 depends on the ability to connect machines, collect operational data, process information in real time, and turn factory-floor signals into business-level insights. However, most factories still operate with a mix of legacy equipment, modern controllers, industrial sensors, PLCs, SCADA systems, cloud platforms, and enterprise software that don't always speak the same language.
An industrial IoT gateway solves this problem by connecting operational technology (OT) with information technology (IT). It collects data from machines and field devices, translates industrial protocols, performs edge processing, secures communication, and sends selected data to cloud or enterprise platforms.
For manufacturers, the industrial IoT gateway is not just a connectivity device. It is a strategic foundation for production visibility, predictive maintenance, energy monitoring, process optimization, and smart factory transformation.
What is an Industrial IoT Gateway?
An industrial IoT gateway is a hardware and software device that connects machines, controllers, sensors, and industrial equipment to IT systems, cloud platforms, and data applications. It serves as the bridge between factory-floor operations and digital manufacturing systems.
Unlike a standard network router, an industrial IoT gateway is designed for manufacturing environments. It must support industrial communication protocols, operate reliably in harsh conditions, process data at the edge, and protect connected assets from cybersecurity risks.
The Universal Translator Between OT and IT
A single factory floor can include PLCs from different brands, CNC machines from different generations, sensors with different data formats, and enterprise systems that expect clean, structured data. The industrial IoT gateway reconciles all of it.
On the OT side, it connects to equipment such as PLCs, sensors, actuators, CNC machines, meters, drives, robots, and SCADA systems. On the IT side, it connects to platforms such as MES, ERP, cloud dashboards, databases, analytics software, and remote monitoring systems.
This translation layer is essential because industrial devices often use protocols such as Modbus, PROFINET, EtherNet/IP, OPC UA, CANopen, or serial communication, while IT systems typically rely on IP-based data exchange, APIs, databases, MQTT, HTTPS, or cloud services.
By converting and contextualizing data, the gateway allows manufacturers to use machine data for decisions beyond the production floor.
Why Do Manufacturers Need an IIoT Gateway?
Manufacturers need an IIoT gateway because industrial data is often trapped inside equipment. Without a gateway, valuable data may remain isolated in machines, unavailable for analysis, monitoring, or optimization.
An industrial IoT gateway helps manufacturers:
- Connect legacy machines to modern digital systems
- Collect real-time production and equipment data
- Translate industrial protocols into usable data formats
- Support remote monitoring and diagnostics
- Enable predictive maintenance
- Improve energy visibility
- Reduce cloud dependency through edge processing
- Strengthen OT cybersecurity
- Build scalable smart factory architectures
The gateway becomes especially important when manufacturers want to modernize existing production lines without replacing every machine. Instead of starting from zero, companies can connect current assets and gradually build a more data-driven factory.
Core Functions and Key Features of an Industrial IoT Gateway
An industrial IoT gateway must do more than move data from one place to another. In a real factory environment, it must translate protocols, filter and process data, secure communication, and hold up under industrial conditions.
1. Multi-Protocol Translation for Industrial Communication
Protocol translation is one of the most important functions of an industrial IoT gateway. Many production sites run mixed equipment from different vendors and different generations. Without protocol support, these machines remain disconnected from modern data platforms.
A capable gateway can support communication across protocols such as:
- Modbus TCP/RTU
- OPC UA
- PROFINET
- EtherNet/IP
- MQTT
- CANbus
- Serial communication
- Ethernet-based industrial protocols
This enables manufacturers to collect data from different machine types and standardize it for monitoring, analytics, and enterprise integration.
For Industry 4.0, protocol translation serves as the foundation for connecting fragmented equipment into a unified digital manufacturing environment.
2. Real-Time Edge Computing Capabilities
Edge computing processes data near the machine instead of routing everything to the cloud first. This is critical in industrial environments where latency, bandwidth, uptime, and data security matter.
NIST defines cloud computing as a model that enables convenient, on-demand network access to shared computing resources. However, manufacturing operations often require local responsiveness that cloud-only architectures cannot guarantee. That gap is exactly why edge computing has become central to industrial IoT deployments.
With edge computing capability, a gateway can:
- Filter unnecessary data before sending it to the cloud
- Detect abnormal machine behavior locally
- Trigger real-time alerts
- Run rule-based control logic
- Support local dashboards
- Continue operating during network interruptions
- Reduce bandwidth and cloud storage costs
For example, a vibration sensor may generate large amounts of data. Instead of uploading every raw signal, the gateway can process the data locally and send only key indicators, anomalies, or maintenance alerts.
3. Industrial-Grade Cybersecurity Protection
As factories become more connected, cybersecurity becomes a direct operational concern. Because the gateway sits between OT assets and IT systems, it serves as a critical security control point.
This lines up well with the NIST Guide to Operational Technology Security , which emphasizes that OT environments have unique performance, reliability, and safety requirements that generic IT security approaches don't fully address.
Key cybersecurity features typically include:
- Firewall protection
- VPN support
- Secure remote access
- User authentication
- Device identity management
- Data encryption
- Network segmentation
- Access control
- Security logging
- Firmware update management
For manufacturers, gateway security helps reduce the risk of unauthorized access, operational disruption, data exposure, and unsafe changes to connected systems.
4. Rugged Design for Harsh Industrial Environments
Industrial IoT gateways must operate in environments where standard commercial devices may fail. Factory floors, transportation systems, energy sites, and outdoor industrial locations can expose equipment to heat, vibration, dust, electrical noise, and unstable power conditions.
A rugged industrial gateway usually includes:
- Fanless thermal design
- Wide temperature support
- Industrial power input
- Shock and vibration resistance
- DIN-rail or wall-mount options
- Long lifecycle availability
- Industrial certifications
- Reliable connectivity options
This ruggedness matters because gateway failure can interrupt data collection, remote monitoring, and production visibility. For mission-critical industrial systems, reliability is a core requirement.
Cloud vs Edge Computing: How Should Manufacturers Choose?
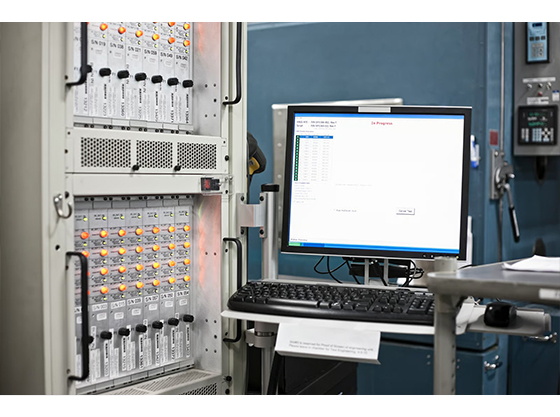
Manufacturers do not need to choose between cloud and edge computing as opposing strategies. The strongest Industry 4.0 architectures use both.
Cloud computing provides scale, centralized analytics, storage, and enterprise visibility. Edge computing provides speed, reliability, local control, and reduced dependency on external connectivity. The industrial IoT gateway is the device that makes this balance practical.
Advantages and Limitations of Cloud Computing
As defined by NIST , cloud computing provides on-demand access to shared computing resources and is valuable for applications that require large-scale data storage, cross-site visibility, advanced analytics, and centralized management, allowing manufacturers to scale digital operations without expanding on-site computing infrastructure.
Cloud platforms are well suited for:
- Long-term production data storage
- Multi-site performance dashboards
- Enterprise reporting
- AI model training
- Fleet monitoring
- Supply chain visibility
- Remote access to manufacturing insights
However, cloud computing has limitations in industrial environments. It depends on network availability, introduces latency, and may increase data-transfer and storage costs if all raw machine data is uploaded continuously.
For real-time factory decisions, cloud-only architecture usually isn't enough.
Real-Time Responsiveness and Reliability of Edge Computing
Where cloud excels at scale, edge computing excels at speed: processing data close to machines and sensors so manufacturers can respond to operational events immediately and keep running even when cloud connectivity drops. That's why it's the better fit for real-time alarms, anomaly detection, low-latency decision-making, and offline operation—the moments when waiting for a round trip to the cloud isn't an option.
The tradeoff between the two is the deciding factor for most architecture choices: cloud for depth and scale, edge for speed and resilience, which is exactly why most manufacturers end up needing both.
The Optimal Architecture: Hybrid Edge-Cloud Model
The optimal architecture for most manufacturers is a hybrid edge-cloud model.
In this model, the industrial IoT gateway processes critical data locally at the edge, while selected data is sent to the cloud for long-term analysis, centralized reporting, and enterprise-level decision-making.
A hybrid model allows manufacturers to:
- Keep time-sensitive decisions close to the machine
- Reduce bandwidth use by filtering raw data
- Send meaningful data to cloud platforms
- Maintain local operations during network interruptions
- Support centralized analytics across multiple sites
- Improve cybersecurity through layered architecture
The Industry IoT Consortium's Industrial Internet Reference Architecture provides a useful framework for understanding how industrial systems connect assets, edge systems, platforms, and business applications. In practical factory deployments, the industrial IoT gateway plays a key role in connecting these layers.
Four Key Industrial IoT Gateway Use Cases
Industrial IoT gateways create value when they turn disconnected equipment into usable operational intelligence. The following use cases show how gateways support practical Industry 4.0 transformation.
1. Legacy Equipment Connectivity
Many factories still rely on legacy machines that remain mechanically reliable but lack modern connectivity. Replacing these machines can be expensive and disruptive, which is exactly the problem an industrial IoT gateway is built to avoid.
An industrial IoT gateway allows manufacturers to connect legacy equipment without replacing the entire production line. It can collect data through serial interfaces, digital I/O, analog signals, or legacy industrial protocols, then convert that data into formats modern software platforms can use.
This approach helps manufacturers extend the value of existing assets while gradually building smart factory capability.
2. Production Monitoring and Process Optimization
Real-time production monitoring gives manufacturers better visibility into machine status, output, downtime, cycle time, and process conditions.
Here, the gateway's role is to move machine data into dashboards, MES platforms, or analytics tools. This allows teams to identify bottlenecks, compare line performance, monitor production targets, and reduce unplanned stoppages.
For example, gateway data can reveal whether a machine is running, idle, stopped, or producing below expected speed. With this visibility, manufacturers can improve scheduling, maintenance planning, and operational decision-making.
3. Condition Monitoring and Predictive Maintenance
Condition monitoring uses machine data to detect signs of equipment degradation before failure occurs. Vibration sensors, temperature sensors, current meters, and pressure sensors all feed data into the gateway. With sufficient computing resources and appropriate analytics software, the gateway can process this data locally to identify abnormal patterns and trigger alerts before equipment failure occurs.
Predictive maintenance can help manufacturers:
- Reduce unplanned downtime
- Extend equipment life
- Improve maintenance scheduling
- Lower repair costs
- Avoid secondary equipment damage
- Improve production reliability
Instead of servicing equipment only after failure, manufacturers can make maintenance decisions based on real operating conditions.
4. Smart Energy Consumption Monitoring
Energy visibility is becoming a priority for manufacturers seeking to reduce cost and improve sustainability performance. An industrial IoT gateway can collect data from power meters, sensors, compressors, HVAC systems, production machines, and utility equipment.
This allows manufacturers to monitor:
- Energy use by machine
- Peak demand periods
- Idle energy consumption
- Compressed air waste
- Equipment-level power trends
- Energy consumption per production unit
Smart energy monitoring helps teams identify where energy is being wasted and where improvements can produce measurable savings. It also supports ESG reporting and carbon-reduction initiatives through higher-quality, more granular operational data.
Enabling Smart Factory Transformation with NEXCOM Industrial IoT Gateway Solutions
Smart factory transformation starts with connectivity across machines, edge systems, cloud services, and enterprise applications. NEXCOM's industrial IoT gateway solutions help manufacturers connect field control and sensor nodes with higher-level systems, enabling existing equipment to participate in modern data-driven operations without requiring wholesale replacement.
Whether you're pursuing predictive maintenance, energy visibility, or a more connected production line, the starting point is the same: connecting the assets you already have. To accelerate your Industry 4.0 transformation, contact NEXCOM and discuss the right gateway approach for your operation.
-
Related Links:
-
What Is ROS 2? Architecture, ROS 1 vs. ROS 2, and Migration Guide
-
What Is Manufacturing Process Automation? Types, Benefits, Use Cases, and 7 Implementation Steps
-
Browse Other News:
-
Smarter Warehouse & Logistics Inspection Starts at the Edge with NDiS B340
-
NEXCOM Introduces RoboWIZ AI Robotics Platform at GTC Berlin
Committed to Customer Success ©2011-2023 NEXCOM International Co., Ltd. All Rights Reserved. Cookie Privacy Sitemap
Take a minute and tell us what you think!
What Is an Industrial Robot Controller? A Complete Guide
Bull 0
Bear 0
Other
Most Viewed News see more
Physical AI Hits the Factory Floor: Predictive Optimization for Chemical Processes The chemical manufacturing industry is vital to Ta...
Open Innovation Platform Helps Shape the Landscape of IoT Applications The Internet of Things (IoT) inspired numerous app...
Edge Computing Shows IIoT Values with Instant Feedback and Response The heated discussion around Industry 4.0 and smar...
October 12, 2026
What Is an Industrial Robot Controller? A Complete Guide
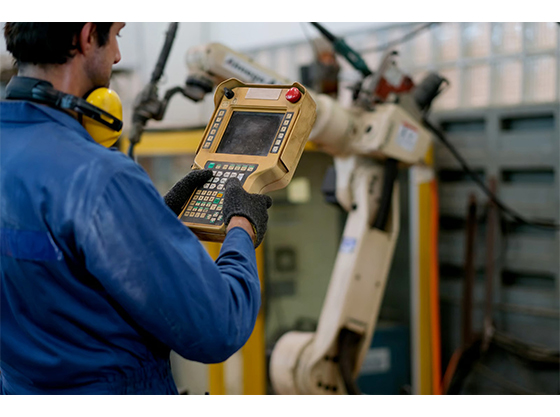
Industrial robots are now central to advanced manufacturing, semiconductor production, electronics assembly, logistics automation, machine tending, and smart factory operations. Behind every precise robotic movement is a control system that coordinates motion, processes feedback, communicates with field devices, and supports safe operation. This control system is the robot controller.
It determines how the robot moves, how accurately it follows a path, how it responds to sensors, and how it integrates with the wider automation environment. For robot builders, machine builders, and system integrators, controller selection directly affects robot performance, system stability, safety design, and long-term scalability.
Industrial robot adoption continues to expand worldwide. According to the International Federation of Robotics , annual global industrial robot installations reached 542,000 units in 2024, more than double the volume recorded ten years earlier. As robot deployment increases, the controller is becoming a strategic platform for motion control, AI integration, industrial communication, and functional safety.
What is a Robot Controller?
A robot controller is a hardware and software system that manages the operation of a physical robot. It interprets programmed instructions, calculates motion trajectories, processes real-time feedback, communicates with external devices, and sends commands to servo drives, motors, grippers, sensors, and safety systems.
In industrial automation, the controller converts digital commands into controlled mechanical motion. It coordinates the robot's axes, manages timing, monitors operating conditions, and ensures that the robot performs tasks with the required precision, speed, and repeatability.
The "Brain" of the Industrial Robot
Think of the robot controller as an industrial robot's brain. It does not simply start and stop movement. It coordinates multiple subsystems in real time and controls how the robot behaves across different production scenarios.
For instance, in a robotic welding application, the controller maintains path accuracy, travel speed, and tool orientation. In a machine-tending cell, it synchronizes robot motion with CNC machines, doors, fixtures, and sensors. In a vision-guided picking system, it uses object-position data to adjust the robot path before motion begins. In collaborative robot applications, it works with safety sensors and monitored zones to reduce operational risk.
A modern industrial robot controller therefore serves as the central coordination layer between mechanical motion, software logic, field devices, safety systems, and factory networks.
How Does an Industrial Robot Controller Work?
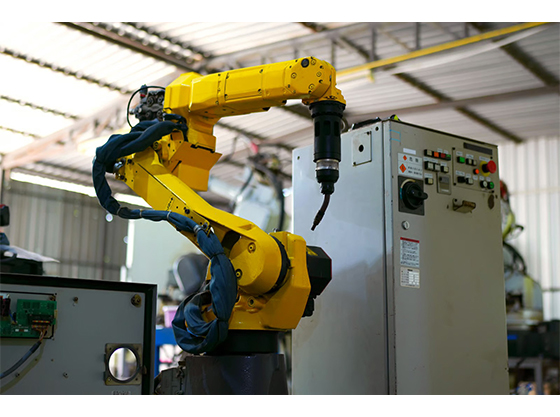
An industrial robot controller works by converting programmed commands into coordinated movement: calculating motion paths, sending commands to drives and motors, and reading feedback from sensors and encoders to confirm the robot is executing as planned. In advanced systems, this same loop extends to vision data, AI inference, conveyor tracking, and multi-robot synchronization — the fundamentals of which are covered in the sections below.
Key Functions and Capabilities
Motion Control and Path Planning
Motion control defines how the robot moves. The controller calculates the required position, speed, acceleration, deceleration, and orientation for each axis. For multi-axis robots, it synchronizes joint movement, so the end effector reaches the target point accurately and efficiently.
Path planning determines how the robot travels through space. In applications such as dispensing, welding, cutting, inspection, and assembly, the robot must follow a controlled path rather than simply move between two points. The controller manages interpolation, trajectory smoothing, speed control, and tool-center-point positioning to maintain process quality.
For high-speed production machines, motion quality directly affects throughput and repeatability. A capable robot controller reduces vibration, improves trajectory control, and supports stable operation across demanding production cycles.
Real-Time Feedback Processing
None of this works without real-time feedback. Encoders, torque sensors, force sensors, proximity sensors, machine vision, and I/O devices feed the controller data it uses to confirm position, detect errors, adjust movement, and catch abnormal behavior before it becomes a problem — critical for maintaining precise torque, velocity, and position control in servo-driven systems.
This matters most in applications where timing is tight: conveyor tracking, vision-guided robotics, force-controlled assembly, high-speed picking, and collaborative robot operation. Delayed feedback reduces control accuracy and increases the risk of unstable machine behavior.
I/O Integration and Communication
Industrial robots operate as part of a larger automation system. A robot controller must communicate with PLCs, HMIs, sensors, grippers, conveyors, safety devices, machine tools, vision systems, and factory networks.
A strong controller architecture supports both local I/O and industrial communication protocols. Common protocols include EtherCAT, EtherNet/IP, PROFINET, Modbus TCP, and CANopen, supported through various interfaces such as RJ45, RS232/422/485, DI/DO, and GPIO.
EtherCAT is widely used in high-speed motion control because it supports deterministic communication and synchronized multi-axis operation. EtherNet/IP and PROFINET are common in factory automation environments that require broad PLC and network integration.
Communication capability determines how easily the robot fits into the production line. It also affects commissioning speed, troubleshooting efficiency, and long-term system expansion.
Safety Monitoring
Safety is a core controller function in modern robotics. The controller must support defined safety responses when hazardous conditions occur, including stop functions, speed limitation, workspace restriction, and safe recovery from abnormal states.
The ISO 10218-1 robot safety standard specifies safety requirements for industrial robots, including design requirements, risk reduction measures, and information for use. These requirements make safety a system-level consideration that begins with controller architecture.
Common safety-related functions include emergency stop, protective stop, safe torque off, speed limitation, workspace limitation, safety-rated monitored stop, collision detection, and safe shutdown behavior—functions that matter even more as cobots and flexible production cells put humans and robots in closer proximity.
Core Components of a Robotic Control System
Delivering those functions depends on a specific set of hardware and software components: computing hardware, motion-control drives, communication interfaces, feedback devices, and operator interfaces. Here's what each one does.
CPU and Main Board
The CPU and main board provide the computing foundation of the robot controller. They execute control software, calculate motion commands, manage real-time tasks, process feedback, and coordinate communication with external devices.
In advanced robotic systems, the controller also handles machine vision, AI inference, sensor fusion, data logging, and predictive maintenance functions. This is why many modern robot controllers are evolving into industrial edge computing platforms.
Processing performance affects control cycle time, axis coordination, vision-processing capability, communication bandwidth, and software scalability.
Servo Drives and Amplifiers
Servo drives and amplifiers convert controller commands into controlled motor output. They regulate torque, speed, and position based on feedback from encoders or sensors.
In a multi-axis robot, each joint requires precise servo control. The controller coordinates these drives to produce smooth, synchronized movement across the entire robot structure.
Servo control quality affects repeatability, speed, vibration, payload handling, and path accuracy. In high-performance industrial robotics, servo coordination is a key factor in production quality.
I/O Modules and Communication Interfaces
I/O modules connect the controller to external devices such as sensors, actuators, grippers, safety devices, conveyors, fixtures, and signal towers. Communication interfaces connect the robot to PLCs, HMIs, edge computers, vision systems, and factory networks.
A flexible industrial robot controller provides sufficient I/O capacity and protocol support for current and future system requirements. Limited connectivity increases integration complexity and restricts expansion.
Teach Pendant (Operator Interface)
A teach pendant is the operator interface used to program, configure, jog, and monitor the robot. It supports setup, commissioning, troubleshooting, and maintenance operations.
Operators use the teach pendant to teach positions, adjust motion paths, check alarms, review system status, switch operation modes, and execute manual control tasks.
An effective operator interface improves commissioning efficiency, reduces training requirements, and supports safer interaction during setup and maintenance.
Types of Robot Controllers in the Market
Robot controllers differ by architecture, processing capability, programming environment, and integration model. The right controller type depends on the robot structure, application requirements, communication needs, and required level of software flexibility.
PC-Based Motion Controllers
PC-based motion controllers use industrial PCs or embedded computing platforms to run robot-control software. They provide strong processing performance, open software architecture, and flexible integration with vision, AI, data, and motion-control systems.
These controllers are suitable for advanced robotics applications that require high computing power, multi-axis coordination, and integration with third-party software or devices.
Typical applications include vision-guided robotics, semiconductor equipment, CNC systems, packaging machines, precision assembly, robotic inspection, AI-enabled robots, and multi-axis production machines.
PC-based controllers provide strong flexibility for robot builders that need customized motion logic, real-time software, and scalable system architecture.
Embedded PLC-Style Controllers
Embedded PLC-style controllers combine machine-control reliability with robot-control functionality. They are commonly used in applications where deterministic control, stable operation, and familiar automation logic are primary requirements.
These controllers are suitable for machine tending, simple robotic cells, assembly systems, material handling, packaging automation, and production equipment with defined motion requirements.
They provide strong reliability and straightforward integration with traditional factory automation systems.
Open-Source and ROS-Based Controllers
ROS-based controllers are used in research, mobile robotics, autonomous systems, and advanced robot development. The ROS 2 documentation highlights middleware flexibility as a key factor in distributed robotic system design.
ROS-based architectures provide useful tools for perception, navigation, simulation, planning, and robot software development. For industrial deployment, they require a robust control architecture that addresses real-time performance, reliability, cybersecurity, safety validation, and lifecycle support.
Production-ready ROS-based systems typically combine open-source development flexibility with industrial-grade hardware, real-time control layers, and validated safety subsystems.
The Future of Industrial Robot Controllers
Industrial robot controllers are shifting from dedicated motion-control devices into intelligent automation platforms. Modern controllers must handle motion, perception, communication, safety, AI processing, and data integration within one system architecture.
AI and Edge Computing Integration
Next-generation controllers no longer execute fixed motion programs. With built-in AI and edge computing, they process visual data, detect objects, optimize paths, identify defects, monitor equipment health, and respond to changing production conditions—all with processing handled close to the robot rather than in the cloud, which reduces latency and improves reliability.
The NIST robotics program focuses on measurement science for manufacturing robot performance, collaboration, agility, autonomy, safety, and implementation. This reflects the direction of industrial robotics: controllers must support both precise motion and intelligent decision-making.
For robot builders, that means evaluating controllers on AI workload capacity, sensor-fusion capability, and software scalability, not just motion performance.
Collaborative Robots (Cobots) and Advanced Functional Safety
Collaborative robots require more advanced controller safety functions because they operate closer to human workers. Controllers must manage safe speed, force limitation, workspace boundaries, protective stop behavior, proximity sensing, and controlled recovery.
Functional safety and cybersecurity are also becoming more connected. As robots communicate through industrial networks and edge systems, secure communication and controlled access become essential to operational safety.
Together, these trends point to where the controller is headed: from a motion-control device to the central platform connecting robot intelligence, safety, and factory execution.
How to Choose the Right Industrial Robot Controller?
Selecting the right industrial robot controller requires a structured evaluation of robot mechanics, motion requirements, communication protocols, safety needs, computing performance, and expansion plans.
The controller must fit the application's current technical requirements while supporting future system upgrades.
Compatibility and Payload Requirements
The controller must match the robot's mechanical structure, number of axes, payload, kinematics, servo system, and required operating performance.
A Cartesian robot, SCARA robot, Delta robot, wafer robot, six-axis arm, and seven-axis robot each requires a different motion-control approach. Payload also affects acceleration, braking, torque control, vibration, and path stability.
Key evaluation factors include robot structure, controlled axes, payload, inertia, repeatability, speed, end-effector type, feedback requirements, and multi-robot coordination.
Processing Performance and Expansion Flexibility
Processing performance determines whether the controller can manage real-time motion, high-speed feedback, industrial communication, machine vision, and AI workloads.
A controller for advanced robotics must support deterministic execution, sufficient computing capacity, flexible I/O expansion, software customization, and long-term platform availability.
Expansion flexibility is critical because automation systems frequently evolve after deployment. Additional sensors, new grippers, more axes, AI modules, remote monitoring, and factory-system integration all require a controller architecture that supports growth.
Supported Industrial Communication Protocols
As covered earlier, protocol support (EtherCAT, EtherNet/IP, PROFINET, CANopen) directly affects how easily the robot integrates into existing factory networks. This should be weighed against your site's installed automation ecosystem.
Partner with NEXCOM Robotic Solutions
Selecting the right industrial robot controller is a critical step in building robots that are precise, reliable, safe, and ready for future automation demands. As industrial robots continue to integrate motion control, real-time feedback, AI computing, and factory communication, robot builders need more than a component supplier; they need a partner who understands control architecture from the ground up.
NEXCOM Robotic Solutions (NexCOBOT Co. Ltd.) supports robot builders, machine builders, and system integrators with the computing, communication, and motion-control foundation needed to develop advanced robotic systems for modern manufacturing environments. To build smarter, safer, and more scalable industrial robots, contact NEXCOM today and explore the right approach for your next automation project.
-
Related Links:
-
What Is ROS 2? Architecture, ROS 1 vs. ROS 2, and Migration Guide
-
What Is Manufacturing Process Automation? Types, Benefits, Use Cases, and 7 Implementation Steps
-
Browse Other News:
-
Smarter Warehouse & Logistics Inspection Starts at the Edge with NDiS B340
-
NEXCOM Introduces RoboWIZ AI Robotics Platform at GTC Berlin
Committed to Customer Success ©2011-2023 NEXCOM International Co., Ltd. All Rights Reserved. Cookie Privacy Sitemap
Take a minute and tell us what you think!
Events
Bull 0
Bear 0
Routine
Most Viewed News see more
Physical AI Hits the Factory Floor: Predictive Optimization for Chemical Processes The chemical manufacturing industry is vital to Ta...
Open Innovation Platform Helps Shape the Landscape of IoT Applications The Internet of Things (IoT) inspired numerous app...
Edge Computing Shows IIoT Values with Instant Feedback and Response The heated discussion around Industry 4.0 and smar...
Solutions Demo see more
| eSAF for Industry 4.0/Smart Manufacturing Security OT Security by eSAF Micro-Segregation:...eSAF for Industry 4.0/Smart Manufacturing Security |
Video see more
| NEXCOM Outdoor Computer Solution 00:00 Intro 00:34 NEXCOM IP65/ IP67 industrial c...NEXCOM Outdoor Computer Solution |
| Online Catalog 2026 Intelligent Platform & Service in Smart City Product Selection Guide |
Events
Find a news: --Select Year-- 2026 2025 2024 2023 2022 2021 2020 2019 2018 2017 2016 2015 2014 2013 2012 2011 2010 --Select One-- IoT Automation Solutions OT Cybersecurity Solution Industrial Wireless Solutions Medical & Healthcare Informatics Intelligent Video Surveillance Intelligent Platform @ Smart City Mobile Computing Solutions Network and Communication Solutions
- September 29, 2026
- NEXCOM Robotic Solutions to Showcase Humanoid Robot Safety Brain with RoboWIZ Partners at NVIDIA GTC Berlin NEXCOM Robotic Solutions will showcase its humanoid robot safety technologies and RoboWIZ AI Robot Open Platform at NVIDIA GTC Berlin 2026. Featuring the RCB400 robot con...
- September 02, 2026
- NEXCOM Group to Showcase Full-Spectrum Smart Manufacturing Solutions at ISA Automation Summit & Expo 2026 NEXCOM Group, a global innovator in Edge computing and Robotics, will exhibit at the ISA Automation Summit & Expo, a leading event for industrial automation and OT cybers...
- August 17, 2026
- From Power Grid to Smart Factory: NEXCOM Group Lands in Texas, Six AIoT Solutions Connect with Critical Supply Chains NEXCOM Group will exhibit six AIoT solutions at Taiwan Expo USA 2026.The lineup spans smart city edge computing, on-premises generative AI, smart manufacturing, robot con...
- August 11, 2026
- Experience the Future of Rail with NEXCOM’s Physical AI at InnoTrans 2026 NEXCOM debuts Physical AI edge computers for rail at InnoTrans 2026—Hall 4.1, Booth 615, Berlin.
- May 25, 2026
- NEXCOM Brings Live Network Customization to Interop Tokyo 2026 Discover NEXCOM at Interop Tokyo 2026 Booth 7F07: Live AtlaXtron™ OS network appliance demos & PQC.
- May 18, 2026
- NEXCOM Joins Forces with Intel at COMPUTEX 2026: Defining New Standards for Smart Production Lines NEXCOM x Intel present Physical AI at COMPUTEX 2026 (Booth A0618), featuring dual-arm assembly, On-Premises GenAI, and humanoid safety solutions.
- May 12, 2026
- NEXCOM Debuts at NRA Show 2026 to Showcase Smart Retails and Foodservice Solutions Integrating Edge Computing and AI Odor-sensing Technology From May 16-19, NEXCOM will participate in the National Restaurant Association Show 2026 (NRA Show), held at McCormick Place in Chicago, where it will present smart appli...
- April 30, 2026
- AI-Driven Transportation and Logistics: NEXCOM Showcases Edge Computing Strength at AI EXPO KOREA 2026 NEXCOM showcases AI edge computing platforms at AI EXPO KOREA 2026 for smart transportation, traffic management, rail, and warehouse logistics safety.
- February 10, 2026
- NEXCOM to Unveil "Embodied AI Robots - Safe by Design" at NVIDIA GTC 2026 NEXCOM is thrilled to announce its participation in NVIDIA GTC, the global epicenter of AI industry, taking place from March 16th to 19th in San Jose, California, USA. ...
- January 20, 2026
- NEXCOM at Embedded World 2026: Unleashing the Ingenuity of Software-Defined Edge Computing NEXCOM, a global innovator in Edge AI computing and robotic solutions, will participate in the landmark Embedded World 2026, held in Nuremberg, Germany, from March 10 to ...
Last Next 21 20 19 18 17 16 15 14 13 12 11 10 9 8 7 6 5 4 3 2 1
Committed to Customer Success ©2011-2023 NEXCOM International Co., Ltd. All Rights Reserved. Cookie Privacy Sitemap
Take a minute and tell us what you think!
Store More Video. Unlock More Intelligence with NViS 6712
Bull 2
Bear 0
Product/operations
Most Viewed News see more
Physical AI Hits the Factory Floor: Predictive Optimization for Chemical Processes The chemical manufacturing industry is vital to Ta...
Open Innovation Platform Helps Shape the Landscape of IoT Applications The Internet of Things (IoT) inspired numerous app...
Edge Computing Shows IIoT Values with Instant Feedback and Response The heated discussion around Industry 4.0 and smar...
Video see more
| 2015 Corporate Video The IoT creates unprecedented opportunities in the...2015 Corporate Video |
September 17, 2026
Store More Video. Unlock More Intelligence with NViS 6712
What happens when a surveillance system has to keep recording while VMS, playback, databases, and AI analytics all compete for resources?
Modern video infrastructure needs more than storage capacity. It also requires fast data access and consistent compute performance to keep concurrent workloads running smoothly.
NEXCOM NViS 6712 brings these resources together in one 2U platform, combining 12-bay high-density storage, dual NVMe SSDs, Intel® Core™ Series 2 processing, and flexible AI expansio****n for recording, applications, and analytics.
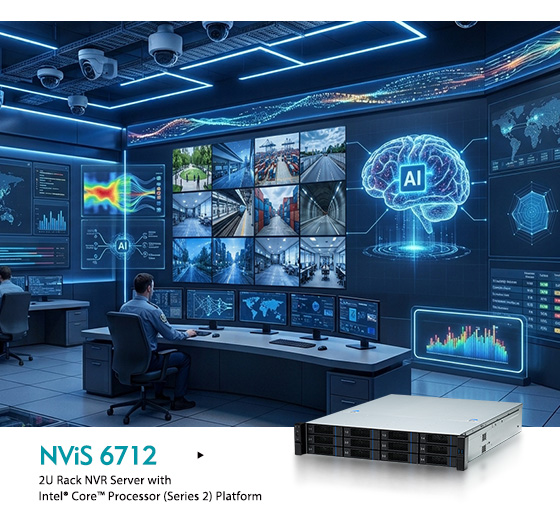
Scale Video Retention Without Scaling Complexity
Higher-resolution cameras generate better evidence, but also much more data. NViS 6712 addresses this with 12 x 3.5-inch HDD bays, supporting up to 312 TB of total JBOD raw capacity for long-duration, multi-camera recording and continuous high-bitrate video streams.
By consolidating high-capacity storage in a single 2U chassis, the platform supports longer retention periods while reducing reliance on separate storage appliances.
In AI-enabled surveillance workflows, the HDD array can preserve large volumes of raw video while higher-speed resources handle applications, metadata, databases, and analytics. This keeps more historical footage available for investigation, review, and downstream analysis while faster storage tiers remain focused on active workloads.
Keep Concurrent Workloads Responsive
NViS 6712 supports Intel® Core™ Series 2 processors, with configurations offering up to 12 Performance-cores, 24 threads, Turbo frequency up to 5.9 GHz, and 36 MB of L3 cache.
Its P-core-focused architecture provides a consistent pool of high-performance compute resources for concurrent VMS, playback, database, video-processing, and AI workloads. This helps maintain predictable performance when multiple applications need to run alongside continuous recording.
The result is a compute platform better suited to surveillance environments where recording, playback, data processing, and analytics must operate simultaneously under sustained workloads.
Separate Workloads to Reduce I/O Contention
NViS 6712 supports two M.2 2280 NVMe SSDs, providing separate high-speed storage resources for different workloads. For example, one NVMe SSD can support the OS and VMS applications while the other handles databases, metadata, AI cache, or other active data workloads. This separation helps reduce I/O contention and keeps applications responsive during concurrent processing.
It also simplifies maintenance by isolating system applications from data-intensive workloads. HDDs provide capacity. NVMe provides speed. Dual NVMe helps keep speed-sensitive workloads from competing for the same storage path.
Scale from Recording to AI Analytics
As surveillance moves beyond passive recording, AI is playing a larger role in how video is analyzed, searched, and acted upon. NViS 6712 supports this shift with an expandable architecture that lets customers scale AI acceleration according to deployment needs.
The system provides PCIe x16 Gen5 expansion for graphics or AI acceleration cards, along with M.2 support for AI accelerator modules. Support for Intel® OpenVINO™ and Intel® Quick Sync Video further extends the platform for AI inference and video-processing workloads.
Potential applications range from object recognition and event detection to image analysis and intelligent video search. Customers can right-size AI acceleration for current workloads, then expand as analytics demands grow.
Keep Video Local While Extending Services to the Cloud
Cloud-connected doesn't have to mean cloud-dependent. NViS 6712 works as a cloud-connected local recording and analytics node, keeping video storage and processing on-site while connecting to cloud-based services.
Acting as the bridge between cameras and the cloud, NViS 6712 can keep high-volume footage stored and processed locally while selected video, events, metadata, or alerts are delivered to cloud applications. This reduces the need to continuously move raw video across the network while maintaining remote access and centralized visibility.
For VSaaS providers and solution partners, this hybrid architecture supports centralized multi-site management, remote viewing, storage relay, playback, and cloud-based services while preserving local recording, storage, and analytics resources at the edge.
Prepare for Emerging Physical AI Workflows
Looking further ahead, the same video infrastructure can support AI model training for Physical AI development. Robots and autonomous systems rely on large volumes of real-world visual data to understand dynamic environments such as factories, warehouses, and roads.
In this emerging workflow, NViS 6712 can serve as a local data collection and preprocessing node. It stores raw footage on HDDs, keeps active datasets on NVMe, and uses compute and AI acceleration resources for tasks such as recognition, labeling, and preprocessing.
This gives collected video a potential role in downstream development of Vision-Language Models (VLMs) and Vision-Language-Action (VLA) models, extending its value beyond security and analytics.
Key Features
- 2U high-density NVR — 12 x 3.5" HDD bays for scalable video storage
- Intel® Core™ Series 2 — P-core-only architecture for consistent high-performance processing
- Tiered storage — 2 x NVMe SSD + 1 x M.2 SATA SSD for workload separation
- Up to 64GB DDR5 — More memory for demanding applications
- AI-ready expansion — PCIe x16 for GPU and accelerator cards
- Dual 2.5GbE — High-speed network connectivity
- Multi-display support — DP 1.4 + HDMI® 2.0b + HDMI® 1.4
- Integrated audio I/O — Audio in/out and microphone support
-
Related Links:
-
Hybrid Cloud Video Surveillance Architecture: What Stays Local and What Moves to the Cloud
-
Browse Other News:
-
Smarter Warehouse & Logistics Inspection Starts at the Edge with NDiS B340
-
NEXCOM Introduces RoboWIZ AI Robotics Platform at GTC Berlin
Committed to Customer Success ©2011-2023 NEXCOM International Co., Ltd. All Rights Reserved. Cookie Privacy Sitemap
Take a minute and tell us what you think!
-
eSAF Cybersecurity Platform
-
Industrial Fanless Computer
Cabinet Mount Controller Fanless PC CMC 300-F0x CMC 300-F13 CMC 300-F2x
Atom™ Compact NISE 105 NISE 105U NISE 106-N3710 NISE 107 NISE 107-E3940 NISE 108 NISE 109-E01/E02 NISE 110-A01/A02 NISE 50 A04-01 NISE 50 A04-02 NISE 50 A04-03 NISE 50 A04-04 NISE 505 NISE 50-J1900 NISE 51 NISE 51-J3455 NISE 52 NISE 53-E01/E02 NISE 70
Core™-i Performance NISE 3000 C30-E
NISE 3000 C30-E2/P2E
NISE 3000 C30-R
NISE 3000 C31-E2/P2E/E16
NISE 3600CE
NISE 3600CE2/P2/P2E
NISE 3700E
NISE 3700E2/P2/P2E
NISE 3900E
NISE 3900E2/P2/P2E
NISE 3900E-H310
NISE 3900R
NISE 3910E
NISE 3910E16/E2/P2/P2E
NISE 3910R
NISE 4310-E01
TT 300-A0Q
TT 300-A2Q/A3Q
TT 300-F00
TT 300-F30 -
Industrial Rackmount Computer
PICMG 1.0/1.3 SBC PEAK 887VL2 PEAK 888VL2 PEAK 889VL2 PEAK 890VL2 PEAK 980/980-H
PICMG 1.0/1.3 BackPlane NBP 0513 NBP 0522 NBP 0641 NBP 06E5 NBP 06P2 NBP 1024 NBP 1052 NBP 1257 NBP 142A0-CX NBP 14570-BX NBP 14570-CX NBP 1465 NBP 14670 NBP 1468 NBP 14880 NBP 2U040 NBP 2U220
Industrial Motherboard NEX 812 NEX 813 NEX 816 NEX 818 NEX 912P NEX 913 NEX 913C NEX 916 NEX 918 NEX 919
-
Embedded Computing
3.5'' / 5.25'' SBC EBC 260 EBC 355A EBC 355U Series EBC 355XP EBC 356 EBC 357 EBC 357X EBC 358 EBC 358X EBC 370/EBC 370X EBC359
Mini-ITX MB NEX 618 NEX 619 NEX 650-ADU
Computer-on-Module ICES 620-HCAD1-USB ICES 620X ICES 674 ICES 675 ICES 675S
-
Panel PC
Human Machine Interface eLITE610 eSMART04 eSMART07M eSMART10 eTOP504 eTOP507 eTOP510
Industrial Panel PC/ Monitor IPPC 1040P IPPC 1050P IPPC 1611-C11 IPPC 1640P IPPC 1650P IPPC 1660-A11 IPPC 1680P IPPC 1850P IPPC 1880P IPPC 2111-C11 IPPC 2140P IPPC 2150P IPPC 2160-A11 IPPC 2180P IPPC 2411-C11 IPPC 2460-A11
Applied Panel PC/ Monitor APPC 0760-A01
APPC 0760-A02
APPC 0760-A04
APPC 1060-A01
APPC 1060-A02
APPC 1060-A04
APPC 1240C-B01
APPC 1245T
APPC 1250T
APPC 1260T-A01
APPC 1540C-B01
APPC 1540T
APPC 1550T
APPC 1560-A01
APPC 1660-A01
APPC 1740C-B01
APPC 1740T
APPC 1750T
APPC 1760-A01
APPC 1940C-B01
APPC 1940T
APPC 1950T
APPC 1960-A01
APPC 2160-A01
APPC 3154
APPC160 C21-01
APPC210 C21-01
APPD 1200-1
APPD 1200-2
APPD 1500-1
APPD 1500-2
APPD 1600-2
APPD 1700-1
APPD 1700-2
APPD 1900-1
APPD 1900-2
APPD 2100-2 -
PC-based Factory Automation
miniPCIe Module - COM NISKECOM3 NISKECOM4 NISKLPT
miniPCIe Modules - Fieldbus FBI90E-COM FBI90E-DNM FBI90E-PBM FBI90E-REM NISKNVRAM
miniPCIe Module - I/O NISKDIO-8I8O
industrial Fieldbus Computer NIFE 106-A01 NIFE 106-A02 NIFE 200 NIFE 200P2/E2/P2E NIFE 200S NIFE210-E01/E02 NIFE210-E11/E12
-
Software Solution
IntervalZero RTX - RTOS RTX 2012 RTX64 2013
USB WhiteList USB WhiteList 1.0
Professional Software Service – BIOS, Bootloader, Kernel, eAPI, Driver & Embedded OS/BSP ProfessionalSoftware Service
-
Machine Automation
-
IoT Solutions
Arm-based HMI nHMI-07L nHMI-10M
Remote Data Acquisition System nDAS 6000 Series
-
Marine Computer
-
Slow Moving Embedded Boards
Slow moving embedded boards ICES 620-HCAD3 NEX 650-ADU NEX 812 NEX 813 NEX 885 NEX 910 NEX 913 NEX 980 PEAK 877VL2
-
Environment and Energy Solutions
Environment and Energy Solutions
Industrial IoT Data Acquisition System RN-30-EG01 RN-30-ND01/02
-
Duro Edge Computer
Accessories DockInfinity-2R8
DockInfinity-2S
DockInfinity-E4X1
DockInfinity-R16F
Compat ARM® NDiS B115 (EOL) NDiS B116 (EOL) NDiS B117
Compact Celeron® NDiS B327(EOL) NDiS B336R(EOL) NDiS B337 (EOL) NDiS B338 NDiS B338-LITE NDiS B339 NDiS B340 Series
Multi-display Computing System NDiS V1000 NDiS V1100
Energy Saver Core™ U NDiS B360 NDiS B361 NDiS B362 NDiS B363 NDiS B364
Hi-Power Core™ NDiS B535 (EOL) NDiS B537 (EOL) NDiS B560 (EOL) NDiS B560-Q (EOL) NDiS B560S (EOL) NDiS B560S-H (EOL) NDiS B561/B561-PoE NDiS B561S NDiS B562 Series NDiS B562-Q Series
-
Embedded Touchscreen Computer
Slim Touchscreen Computer (SPPC Intel® Celeron®) SPPC 16-10N150
High Brightness Touchscreen Computer (HPPC Intel Celeron®) HPPC 12-10X7211 HPPC 15-10X7211
Wide Touchscreen Computer (XPPC Intel® Core™) XPPC 10-200 XPPC 16-200 XPPC 16-201 XPPC 24-200A
Wide Touchscreen Computer (XPPC Intel® Celeron®) XPPC 10-100 (EOL) XPPC 10-100-Ag+ (EOL) XPPC 10-10N97 XPPC 16-100 (EOL) XPPC 16-101 (EOL) XPPC 16-105N150
XPPC 16-105N97
XPPC 16-10N97
XPPC 22-100A (EOL)
XPPC 24-100A (EOL)
XPPC 24-10N97A
4:3 Open Frame Panel PC (OPPC) OPPC 1240T OPPC 1540HT-J1900 OPPC 1540TSeries OPPC 1740T OPPC 1940HT-J1900 OPPC 1940TSeries
-
Edge AI Computer
NVIDIA Solution AIEdge-X®300 AIEdge-X®300-RTX30 AIEdge-X®310 AIEdge-X®500 AIEdge-X®80 AIEdge-X®80-NA AIEdge-X®80-NX-S
Google Coral Solution AIEdge-X®100 AIEdge-X®537 NISE 3800E-GCIoT NISE 50-GCIoT
Intel Movidius Solution AIEdge-X®100-VPU AIEdge-X®300-VPU AIEdge-X®500 AIEdge-X®537-VPU
-
Edge Computing System
Neu-X3 Core™ Series Neu-X1025-N305 Neu-X102-i3 Neu-X1045-N355 Neu-X104-i3 Neu-X302 Neu-X303 Neu-X303mini Neu-X304
Neu-X1 Atom® Series Neu-X100 Neu-X101 Neu-X101-6C-DC Neu-X1025-N50 Neu-X1025-N97 Neu-X102-N50 Neu-X102-N97 Neu-X1045-N150 Neu-X104-N150 Neu-X60 Neu-XE102-N50-4C Neu-XE102-N97-14C2S Neu-XE102-N97-6C2S Neu-XE104-N150-14C2S Neu-XE104-N150-6C2S Neu-XE105-N50-12U
-
Embedded Computing Board
Embedded Add-on Module/Card NTK-MEE-LAN
Mini-ITX Board V1000 V1100 X300 X302 X304-MTX
3.5" Board X100-J3455-P X101 X102 X103 X104 X105-7433RE
X105-N150
X200
X201
X202
X203
X204
X314 -
Embedded Touchscreen Display
Embedded Touchscreen Display XPPD 10-0P10
XPPD 16-CQ10
XPPD 24-0P10A -
Vehicle Telematics Computer
Atom® Compact VTC 1010 VTC 1011 VTC 1020 VTC 1020-PA VTC 1021-BK/C2K VTC 1030 VTC 1031/1031-C2 VTC 1040/1040-C2 VTC 1910-S VTC 1911-IPK VTC 1920 VTC 1921-IP / VTC1921-C2IP
Atom® Performance VTC 6210-BK VTC 6210-VR4 VTC 6220-BK VTC 6221 VTC 6222 VTC 6231 VTC 6231-IP VTC 6232 VTC 6232-C4SIP
Core™ Power Efficient VTC 7260-x VTC 7260-xC4 VTC 7280-7/-5 VTC 7280-7C5/-5C5
Core™ Performance VTC 7250-7C8 VTC 7251 VTC 7251-7C4 VTC 7252-7C4IP VTC 7270 VTC 7270-C4/C8
-
Railway Computer
Atom® Compact nROK 1020 nROK 1030 nROK 1031 Series nROK 1040-A/-AC2 VTC 1911-IPK
Atom® Performance nROK 6221 nROK 6221-IP nROK 6222 nROK 6231 Series nROK 6232-AC4S nROK 6232-WIC4S VTC 6210-R
Core™ Performance aROK 5510 aROK 8110 nROK 7251-7A nROK 7251-7C4 nROK 7251-WI-7C4IP nROK 7252-AC8S nROK 7252-WI2-C8S nROK 7270 nROK 7271 nROK 7280-7AC5IP/-5AC5IP nROK 7280-7WIC5IP/-5WIC5IP
-
Edge AI Telematics Solution
NVIDIA Jetson Platform ATC 3530-IP7-4C ATC 3560-IP7-NA4C ATC 3560-IP7-NX4C ATC 3560-IP7-NX4CF ATC 3560-IP7-NXAI4CR ATC 3561-NA4C ATC 3561-NX4CF ATC 3562-IP7-NA4M ATC 3562-IP7-NX4MF ATC 3563-NA8C/NAA8CR ATC 3563-NX8C/NXA8CR ATC 3750-6C ATC 3750-A6CR ATC 3750-IP7-6C ATC 3750-IP7-8M ATC 3750-IP7-WI6CR ATC 3750-IP7-WI8MR
NVIDIA Discrete Card aROK 5510 aROK 8110 aROK 8120-AC4F ATC 8010/8010-F ATC 8110/8110-F ATC 8120-C4F rROK 5520
Hailo Module VTC 1021-HBIoT/HCIoT VTC 7260-5HBIoT/7HBIoT VTC 7260-5HCIoT/7HCIoT
-
Vehicle Mount Computer
-
Vehicle Mount Display
-
IP Rating Computer/Display
Edge AI Telematics Solution ATC 3530
Vehicle Mount Display VMD 3002 VMD 3110
Vehicle Mount Computer VMC 2020
-
In-Vehicle Networking
-
PIS Solution
-
Telematics Solution with Android
Telematics Solution with Android
-
Embedded Add-on Module/Card
Converter VIOB-LTE/EKEY Converter
-
Universal Fitness Console
-
Railway Panel Computer
-
Cyber Security Solutions
Expansion Cards NA 1000-L2X NAI 1000-OS NSK 6301 NSK 6402-NVME/6404-NVME TPM9660-TT
Desktop - Soc Based Appliance DTA 1600
PDTA 1370
PDTA 1372
Desktop - X86 Based Appliance DNA 1160 DNA 1170A DNA 140 DNA 141
Rackmount - SoC Based Appliance
Rackmount - X86 Based Entry Level Appliance NSA 1160/1160A NSA 1170 NSA 3170 NSA 3170A NSA 3170HA NSA 3180A NSA 3180HA NSA 3190A NSA 3200
Rackmount - X86 Based Mainstream Appliance NSA 5181 NSA 5190 NSA 5200
Rackmount - X86 Based Performance Appliance NSA 7150 Series NSA 7160R
LAN Module NC 120FIS4-OS NC 120FMS4 NC 220FMS3-1 ND 180C-OS ND 184CX1-OS NI 140C-OS NI 142CX1 NI 142CX1-OS NI 180C-OS NI 180F-OS NI 184CX1 NI 184CX1-OS NI Series NL 110FI-OS NL 110FM-OS NQ Series NV 120F NV 140F-OS NX 140C-OS NX 140F-OS NX 142FX1 NX 142FX1-LR NX 142FX1-LR-OS NX 142FX1-OS NX Series
-
Edge & Cloud Solutions
5G Edge Solutions FWA over 5G uCPE
nexCPE™ Appliance DFA 1163 Series FTA 1170 FTA 5180
uCPE/Edge Appliance DTA 1160 DTA 1162 DTA 1164W Series DTA 1165
DTA 1376/1376A
DTA 1600
SD-WAN Appliance FTA 5190 NSA 6310/6310-1GE TCA 5170 TCA 5170B TCA 5170C TCA 6710 (ODM Only)
-
OT Security Solutions
-
Network Peripheral Solutions
NVR Solutions PNSA 3170 PNSA 3171/3171A PNSA 3190 PNSA 3280/3280A PNSA 3281/3281A
-
SoC Capability & S/W Services
No Series Page 01 Page 02 Page 03 Page 04 Page 05 Page 06 Page 07 Page 08 Page 09 Page 10 Page 11 Page 12 Page 13 Page 14
-
NVR Hardware Platform
AI NVR Workstation NVAiS 1502 NVAiS 8108
Rackmount NVR Platform NViS 5704 NViS 57244 NViS 6708 NViS 6712
-
Network Camera
Multi Sensor Camera NCp-521F NCp-551G NCp-811F NCp-831G NMP881
PTZ Camera NCs-551-211MSV-R NCs-831-000MSV-RS NCs-831-221MSV-R NDS295PRO
Dome Camera NCi-261 NCi-522 NCi-522C-F28RV3 NCi-822C-F28RV3 NCo-261 NCo-521 NCo-523C-F28RV3 NCo-525C NCo-811 NCo-823C-F28RV3 NCo-832C
-
Industrial Wireless Product
-
Remote Network Management
-
Embedded Computing
-
Video Conference System
-
Software Package
-
HealthCare & Medical
-
Embedded Boards
-
Vertical Applications
-
Computer-on-Modules (CCC)
Design-Win Support Spec-in Service Valiodation Service Value Added Services Design-in Assistance
Customization to Order Service
Business Models introduction
COM Technology
COM Express
ETX
COM Application
公告本公司內部稽核主管異動
Bull 0
Bear 0
Routine
NEXCOM Group to Showcase Full-Spectrum Smart Manufacturing Solutions at ISA Automation Summit & Expo 2026
Bull 1
Bear 0
Other
Most Viewed News see more
Physical AI Hits the Factory Floor: Predictive Optimization for Chemical Processes The chemical manufacturing industry is vital to Ta...
Open Innovation Platform Helps Shape the Landscape of IoT Applications The Internet of Things (IoT) inspired numerous app...
Edge Computing Shows IIoT Values with Instant Feedback and Response The heated discussion around Industry 4.0 and smar...
Solutions Demo see more
| NEXCOM Networking and Communication: Powerful Enterprise Networking Solution for Cybersecurity Application NEXCOM Network and Communication Solutions Busines...NEXCOM Networking and Communication: Powerful Enterprise Networking Solution for Cybersecurity Application |
Video see more
| NEXCOM, Stand Up to the Challenges of OT Network Security Learn how NEXCOM’s ISA 140 addresses everyday chal...NEXCOM, Stand Up to the Challenges of OT Network Security |
| Online Catalog 2026 Network and Communication Solutions |
September 02, 2026
NEXCOM Group to Showcase Full-Spectrum Smart Manufacturing Solutions at ISA Automation Summit & Expo 2026
NEXCOM Group, a global innovator in Edge computing and Robotics, will exhibit at the ISA Automation Summit & Expo, a leading event for industrial automation and OT cybersecurity, for the second consecutive year. The 2026 conference agenda covers AI, industrial control systems (ICS), robotics, and the ISA/IEC 62443 standards for industrial cybersecurity. The Expo features leading suppliers in industrial automation, process control, and OT cybersecurity, as well as Robot Experience Hub which highlights practical robotic applications in action.
Consolidating its smart manufacturing, robotics, and networking product lines, NEXCOM Group will showcase bottom-to-top smart factory solutions ranging from data acquisition, robotic control, industrial networking, and OT cybersecurity, powered by its next-generation AIoT platform, iAT3000. Meet NEXCOM Group at the Walt Disney World Swan and Dolphin in Florida, USA, from September 28–29**.**
Key Highlights
1. Smart Manufacturing: nPAC, nDAS, and nHMI
The nPAC 2000 PC-based PAC unites edge computing, PLC control, and gateway communications, making it suitable for machine-to-machine (M2M) control applications. The nDAS 6000 series data acquisition system enables remote data collection, supports a wide range of industrial protocols and cloud services connection, also features Daisy-chain topology and Bypass. The nHMI-10M human-machine interface provides intuitive operation and multilingual support for visualized process control. Together, they construct a foundation for data acquisition, process control, and visualization in smart manufacturing environments.
2. Robot Control: MARS 400 and ESC 211
Powered by the NVIDIA® Jetson T5000™ SoM, the MARS400 T10-05 robot controller delivers up to 2,070 TFLOPS of AI inference performance, enabling AI-based autonomous decision-making and real-time motion control. As robotic systems become increasingly autonomous, their safety mechanisms must evolve accordingly. Leveraging the FSoE (Failsafe over EtherCAT) protocol, the ESC 211 safety controller helps robot manufacturers develop systems that meet SIL 3 / PL e functional safety requirements and the ISO 10218-1:2025 standard.
3. Networking and OT Cybersecurity: ISA 140, ISA 142, and ISA 120
NEXCOM will showcase a variety of OT networking appliances. The ISA 140 security gateway supports ISA/IEC 62443 requirements and provides micro-segmentation across OT and IT environments. The ISA 142 switch delivers Time Sensitive Networking (TSN) deterministic communications, providing the real-time networking for robotic motion control. The ISA 120 gateway applies Zero Trust architecture to protect equipment in the factory's core control layer. These appliances build a secure networking foundation to integrate distributed OT endpoints into a unified, mission-oriented automation system.
4. iAT3000: Next-Gen AIoT Platform for Smart Manufacturing
The iAT3000 platform can connects PLCs from different vendors and multiple types of sensors to collect process data, monitor hardware health, and customize automation workflows by the support of NexVIC Edge and NexVIC Community IoT management suites. The platform also integrates AI-assisted decision-making with eSAF cybersecurity solutions, transforming from monitoring operations toward intelligent, data-driven actions across the factory.
Visit NEXCOM Group at Booth 402 at ISA Automation Summit & Expo 2026 to explore comprehensive smart manufacturing solutions that bring together AI, IoT, robotics, and industrial networking technologies.
Event Information
- Date: September 28 – 29, 2026
- Venue: Walt Disney World Swan and Dolphin, Lake Buena Vista, Florida, USA
- Booth: 402

-
Related Links:
-
Browse Other News:
-
Smarter Warehouse & Logistics Inspection Starts at the Edge with NDiS B340
-
NEXCOM Introduces RoboWIZ AI Robotics Platform at GTC Berlin
Committed to Customer Success ©2011-2023 NEXCOM International Co., Ltd. All Rights Reserved. Cookie Privacy Sitemap
Take a minute and tell us what you think!
NEXCOM Group (8234) Joins Hands with Ecosystem Partners to Build the "RoboWIZ AI Robot Open Platform," Implementing Complete AI Robotics Suites into Practical Applications to Accelerate Robotics Devel
Bull 2
Bear 0
Product/operations
Most Viewed News see more
Physical AI Hits the Factory Floor: Predictive Optimization for Chemical Processes The chemical manufacturing industry is vital to Ta...
Open Innovation Platform Helps Shape the Landscape of IoT Applications The Internet of Things (IoT) inspired numerous app...
Edge Computing Shows IIoT Values with Instant Feedback and Response The heated discussion around Industry 4.0 and smar...
August 26, 2026
NEXCOM Group (8234) Joins Hands with Ecosystem Partners to Build the "RoboWIZ AI Robot Open Platform," Implementing Complete AI Robotics Suites into Practical Applications to Accelerate Robotics Devel
TAIPEI – August 19, 2026 – As Artificial Intelligence technology transitions into new phases of Physical AI and Embodied AI, the AI discourse has shifted from computing power competition to practical "application landing." Leveraging its deep expertise in robot motion control and functional safety, NEXCOM Group has united Compal, Synapticon, Reynolds & Moore, R2 Labs, Realsense, and dozens of key component partners to introduce the "RoboWIZ AI Robot Open Platform" concept at this week's Automation Taipei. Built upon the five key robotics architecture pillars, the platform showcases comprehensive AI robotics suite solutions spanning humanoid, quadrupedal, and dual-arm robots. NEXCOM Group and its ecosystem partners are fully committed to helping the industry overcome hardware-software integration bottlenecks and accelerating the deployment of AI robots into real-world application sites.
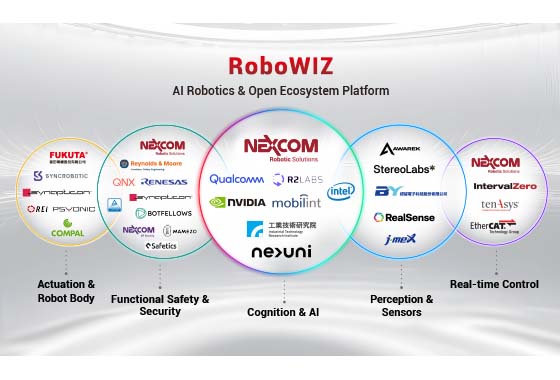
NEXCOM Targets the Last Mile of AI Robotics Deployment Building the RoboWIZ AI Robot Open Platform Centered on Robot Control
NEXCOM's RoboWIZ AI Robot Open Platform covers the five key architectural pillars of robotics: cognition and AI, functional safety and security, visual perception, real-time control, and actuation and integrated systems. NEXCOM Robotics Solutions (NEXCOBOT), acting as a crucial robot control core provider within the group, draws on decades of deep motion control technology and cross-platform hardware-software integration capabilities. By connecting dozens of ecosystem partners including Compal, Synapticon, Reynolds & Moore, R2 Labs, Realsense, NEXCOBOT assists robotics vendors in rapidly integrating across all architectural layers while utilizing validated functional safety technologies to significantly shorten robot development cycles.
Partnering with RoboWIZ AI Robot Open Platform ecosystem members, NEXCOM is displaying various co-developed physical robot applications built on NEXCOBOT's self-developed MARS Pro platform combined with each partner's specialized technologies. Highlights include a dynamic balance humanoid robot co-developed with Safetics, a dual-arm robot with ITRI, and a smart, safe quadrupedal robot dog with Nexuni. The MARS Pro platform can integrate cross-platform AI "brains" based on NVIDIA, Intel, and Qualcomm, paired with NEXCOBOT's motion safety control "cerebellum" and value-added robot application software, to create various types of AI robots. For instance, the dynamic balance humanoid robot showcased this time integrates power control and balancing technology from Safetics, resulting in a humanoid robot that maintains stability without falling even when subjected to external pushes while walking.
The collaboration with partner Nexuni utilizes NEXCOBOT's MARS400-T10 high-compute controller as the AI core brain, loaded with Nexuni's VLA technology. Together, they have created a 4-in-1 smart, safe quadrupedal robot dog that combines AI computing, functional safety, motion control, and cybersecurity. Capable of autonomous obstacle avoidance, meter reading, and fire alerts, it can be deployed in factory inspection and environmental monitoring scenarios.
NEXCOM Unveils Complete AI Solutions from Robotics to Smart Factories at Automation Taipei and will be Showcasing Benchmark AI Applications at TAIWAN EXPO USA 2026 in Dallas
Under the theme "Physical AI Empowers Smart Manufacturing: Building AI Automation from Robots to Factories," NEXCOM is exhibiting comprehensive smart manufacturing applications spanning AI Robot, AI Machine, AI Production Line, and AI Factory, that fully demonstrate NEXCOM Group's capability to assist enterprises in their AI automation transformation. Furthermore, backed by its solid technical expertise, NEXCOM Group has been invited as a benchmark Taiwanese Edge AI vendor to showcase a series of its latest AI applications at the Taiwan Pavilion in Dallas, USA this September. Exhibits will include the MARS Pro series for robotics, AI Production Assistant and industrial-grade cyber defense eSAF system for smart factories, enterprise-grade EdgeGPT AI-X, and the NDiS series for constructing various smart city AI applications.
-
Related Links:
-
NEXCOM Introduces RoboWIZ AI Robotics Platform at GTC Berlin
-
Browse Other News:
-
Smarter Warehouse & Logistics Inspection Starts at the Edge with NDiS B340
-
NEXCOM Introduces RoboWIZ AI Robotics Platform at GTC Berlin
Committed to Customer Success ©2011-2023 NEXCOM International Co., Ltd. All Rights Reserved. Cookie Privacy Sitemap
Take a minute and tell us what you think!
-
eSAF Cybersecurity Platform
-
Industrial Fanless Computer
Cabinet Mount Controller Fanless PC CMC 300-F0x CMC 300-F13 CMC 300-F2x
Atom™ Compact NISE 105 NISE 105U NISE 106-N3710 NISE 107 NISE 107-E3940 NISE 108 NISE 109-E01/E02 NISE 110-A01/A02 NISE 50 A04-01 NISE 50 A04-02 NISE 50 A04-03 NISE 50 A04-04 NISE 505 NISE 50-J1900 NISE 51 NISE 51-J3455 NISE 52 NISE 53-E01/E02 NISE 70
Core™-i Performance NISE 3000 C30-E
NISE 3000 C30-E2/P2E
NISE 3000 C30-R
NISE 3000 C31-E2/P2E/E16
NISE 3600CE
NISE 3600CE2/P2/P2E
NISE 3700E
NISE 3700E2/P2/P2E
NISE 3900E
NISE 3900E2/P2/P2E
NISE 3900E-H310
NISE 3900R
NISE 3910E
NISE 3910E16/E2/P2/P2E
NISE 3910R
NISE 4310-E01
TT 300-A0Q
TT 300-A2Q/A3Q
TT 300-F00
TT 300-F30 -
Industrial Rackmount Computer
PICMG 1.0/1.3 SBC PEAK 887VL2 PEAK 888VL2 PEAK 889VL2 PEAK 890VL2 PEAK 980/980-H
PICMG 1.0/1.3 BackPlane NBP 0513 NBP 0522 NBP 0641 NBP 06E5 NBP 06P2 NBP 1024 NBP 1052 NBP 1257 NBP 142A0-CX NBP 14570-BX NBP 14570-CX NBP 1465 NBP 14670 NBP 1468 NBP 14880 NBP 2U040 NBP 2U220
Industrial Motherboard NEX 812 NEX 813 NEX 816 NEX 818 NEX 912P NEX 913 NEX 913C NEX 916 NEX 918 NEX 919
-
Embedded Computing
3.5'' / 5.25'' SBC EBC 260 EBC 355A EBC 355U Series EBC 355XP EBC 356 EBC 357 EBC 357X EBC 358 EBC 358X EBC 370/EBC 370X EBC359
Mini-ITX MB NEX 618 NEX 619 NEX 650-ADU
Computer-on-Module ICES 620-HCAD1-USB ICES 620X ICES 674 ICES 675 ICES 675S
-
Panel PC
Human Machine Interface eLITE610 eSMART04 eSMART07M eSMART10 eTOP504 eTOP507 eTOP510
Industrial Panel PC/ Monitor IPPC 1040P IPPC 1050P IPPC 1611-C11 IPPC 1640P IPPC 1650P IPPC 1660-A11 IPPC 1680P IPPC 1850P IPPC 1880P IPPC 2111-C11 IPPC 2140P IPPC 2150P IPPC 2160-A11 IPPC 2180P IPPC 2411-C11 IPPC 2460-A11
Applied Panel PC/ Monitor APPC 0760-A01
APPC 0760-A02
APPC 0760-A04
APPC 1060-A01
APPC 1060-A02
APPC 1060-A04
APPC 1240C-B01
APPC 1245T
APPC 1250T
APPC 1260T-A01
APPC 1540C-B01
APPC 1540T
APPC 1550T
APPC 1560-A01
APPC 1660-A01
APPC 1740C-B01
APPC 1740T
APPC 1750T
APPC 1760-A01
APPC 1940C-B01
APPC 1940T
APPC 1950T
APPC 1960-A01
APPC 2160-A01
APPC 3154
APPC160 C21-01
APPC210 C21-01
APPD 1200-1
APPD 1200-2
APPD 1500-1
APPD 1500-2
APPD 1600-2
APPD 1700-1
APPD 1700-2
APPD 1900-1
APPD 1900-2
APPD 2100-2 -
PC-based Factory Automation
miniPCIe Module - COM NISKECOM3 NISKECOM4 NISKLPT
miniPCIe Modules - Fieldbus FBI90E-COM FBI90E-DNM FBI90E-PBM FBI90E-REM NISKNVRAM
miniPCIe Module - I/O NISKDIO-8I8O
industrial Fieldbus Computer NIFE 106-A01 NIFE 106-A02 NIFE 200 NIFE 200P2/E2/P2E NIFE 200S NIFE210-E01/E02 NIFE210-E11/E12
-
Software Solution
IntervalZero RTX - RTOS RTX 2012 RTX64 2013
USB WhiteList USB WhiteList 1.0
Professional Software Service – BIOS, Bootloader, Kernel, eAPI, Driver & Embedded OS/BSP ProfessionalSoftware Service
-
Machine Automation
-
IoT Solutions
Arm-based HMI nHMI-07L nHMI-10M
Remote Data Acquisition System nDAS 6000 Series
-
Marine Computer
-
Slow Moving Embedded Boards
Slow moving embedded boards ICES 620-HCAD3 NEX 650-ADU NEX 812 NEX 813 NEX 885 NEX 910 NEX 913 NEX 980 PEAK 877VL2
-
Environment and Energy Solutions
Environment and Energy Solutions
Industrial IoT Data Acquisition System RN-30-EG01 RN-30-ND01/02
-
Duro Edge Computer
Accessories DockInfinity-2R8
DockInfinity-2S
DockInfinity-E4X1
DockInfinity-R16F
Compat ARM® NDiS B115 (EOL) NDiS B116 (EOL) NDiS B117
Compact Celeron® NDiS B327(EOL) NDiS B336R(EOL) NDiS B337 (EOL) NDiS B338 NDiS B338-LITE NDiS B339 NDiS B340 Series
Multi-display Computing System NDiS V1000 NDiS V1100
Energy Saver Core™ U NDiS B360 NDiS B361 NDiS B362 NDiS B363 NDiS B364
Hi-Power Core™ NDiS B535 (EOL) NDiS B537 (EOL) NDiS B560 (EOL) NDiS B560-Q (EOL) NDiS B560S (EOL) NDiS B560S-H (EOL) NDiS B561/B561-PoE NDiS B561S NDiS B562 Series NDiS B562-Q Series
-
Embedded Touchscreen Computer
Slim Touchscreen Computer (SPPC Intel® Celeron®) SPPC 16-10N150
High Brightness Touchscreen Computer (HPPC Intel Celeron®) HPPC 12-10X7211 HPPC 15-10X7211
Wide Touchscreen Computer (XPPC Intel® Core™) XPPC 10-200 XPPC 16-200 XPPC 16-201 XPPC 24-200A
Wide Touchscreen Computer (XPPC Intel® Celeron®) XPPC 10-100 (EOL) XPPC 10-100-Ag+ (EOL) XPPC 10-10N97 XPPC 16-100 (EOL) XPPC 16-101 (EOL) XPPC 16-105N150
XPPC 16-105N97
XPPC 16-10N97
XPPC 22-100A (EOL)
XPPC 24-100A (EOL)
XPPC 24-10N97A
4:3 Open Frame Panel PC (OPPC) OPPC 1240T OPPC 1540HT-J1900 OPPC 1540TSeries OPPC 1740T OPPC 1940HT-J1900 OPPC 1940TSeries
-
Edge AI Computer
NVIDIA Solution AIEdge-X®300 AIEdge-X®300-RTX30 AIEdge-X®310 AIEdge-X®500 AIEdge-X®80 AIEdge-X®80-NA AIEdge-X®80-NX-S
Google Coral Solution AIEdge-X®100 AIEdge-X®537 NISE 3800E-GCIoT NISE 50-GCIoT
Intel Movidius Solution AIEdge-X®100-VPU AIEdge-X®300-VPU AIEdge-X®500 AIEdge-X®537-VPU
-
Edge Computing System
Neu-X3 Core™ Series Neu-X1025-N305 Neu-X102-i3 Neu-X1045-N355 Neu-X104-i3 Neu-X302 Neu-X303 Neu-X303mini Neu-X304
Neu-X1 Atom® Series Neu-X100 Neu-X101 Neu-X101-6C-DC Neu-X1025-N50 Neu-X1025-N97 Neu-X102-N50 Neu-X102-N97 Neu-X1045-N150 Neu-X104-N150 Neu-X60 Neu-XE102-N50-4C Neu-XE102-N97-14C2S Neu-XE102-N97-6C2S Neu-XE104-N150-14C2S Neu-XE104-N150-6C2S Neu-XE105-N50-12U
-
Embedded Computing Board
Embedded Add-on Module/Card NTK-MEE-LAN
Mini-ITX Board V1000 V1100 X300 X302 X304-MTX
3.5" Board X100-J3455-P X101 X102 X103 X104 X105-7433RE
X105-N150
X200
X201
X202
X203
X204
X314 -
Embedded Touchscreen Display
Embedded Touchscreen Display XPPD 10-0P10
XPPD 16-CQ10
XPPD 24-0P10A -
Vehicle Telematics Computer
Atom® Compact VTC 1010 VTC 1011 VTC 1020 VTC 1020-PA VTC 1021-BK/C2K VTC 1030 VTC 1031/1031-C2 VTC 1040/1040-C2 VTC 1910-S VTC 1911-IPK VTC 1920 VTC 1921-IP / VTC1921-C2IP
Atom® Performance VTC 6210-BK VTC 6210-VR4 VTC 6220-BK VTC 6221 VTC 6222 VTC 6231 VTC 6231-IP VTC 6232 VTC 6232-C4SIP
Core™ Power Efficient VTC 7260-x VTC 7260-xC4 VTC 7280-7/-5 VTC 7280-7C5/-5C5
Core™ Performance VTC 7250-7C8 VTC 7251 VTC 7251-7C4 VTC 7252-7C4IP VTC 7270 VTC 7270-C4/C8
-
Railway Computer
Atom® Compact nROK 1020 nROK 1030 nROK 1031 Series nROK 1040-A/-AC2 VTC 1911-IPK
Atom® Performance nROK 6221 nROK 6221-IP nROK 6222 nROK 6231 Series nROK 6232-AC4S nROK 6232-WIC4S VTC 6210-R
Core™ Performance aROK 5510 aROK 8110 nROK 7251-7A nROK 7251-7C4 nROK 7251-WI-7C4IP nROK 7252-AC8S nROK 7252-WI2-C8S nROK 7270 nROK 7271 nROK 7280-7AC5IP/-5AC5IP nROK 7280-7WIC5IP/-5WIC5IP
-
Edge AI Telematics Solution
NVIDIA Jetson Platform ATC 3530-IP7-4C ATC 3560-IP7-NA4C ATC 3560-IP7-NX4C ATC 3560-IP7-NX4CF ATC 3560-IP7-NXAI4CR ATC 3561-NA4C ATC 3561-NX4CF ATC 3562-IP7-NA4M ATC 3562-IP7-NX4MF ATC 3563-NA8C/NAA8CR ATC 3563-NX8C/NXA8CR ATC 3750-6C ATC 3750-A6CR ATC 3750-IP7-6C ATC 3750-IP7-8M ATC 3750-IP7-WI6CR ATC 3750-IP7-WI8MR
NVIDIA Discrete Card aROK 5510 aROK 8110 aROK 8120-AC4F ATC 8010/8010-F ATC 8110/8110-F ATC 8120-C4F rROK 5520
Hailo Module VTC 1021-HBIoT/HCIoT VTC 7260-5HBIoT/7HBIoT VTC 7260-5HCIoT/7HCIoT
-
Vehicle Mount Computer
-
Vehicle Mount Display
-
IP Rating Computer/Display
Edge AI Telematics Solution ATC 3530
Vehicle Mount Display VMD 3002 VMD 3110
Vehicle Mount Computer VMC 2020
-
In-Vehicle Networking
-
PIS Solution
-
Telematics Solution with Android
Telematics Solution with Android
-
Embedded Add-on Module/Card
Converter VIOB-LTE/EKEY Converter
-
Universal Fitness Console
-
Railway Panel Computer
-
Cyber Security Solutions
Expansion Cards NA 1000-L2X NAI 1000-OS NSK 6301 NSK 6402-NVME/6404-NVME TPM9660-TT
Desktop - Soc Based Appliance DTA 1600
PDTA 1370
PDTA 1372
Desktop - X86 Based Appliance DNA 1160 DNA 1170A DNA 140 DNA 141
Rackmount - SoC Based Appliance
Rackmount - X86 Based Entry Level Appliance NSA 1160/1160A NSA 1170 NSA 3170 NSA 3170A NSA 3170HA NSA 3180A NSA 3180HA NSA 3190A NSA 3200
Rackmount - X86 Based Mainstream Appliance NSA 5181 NSA 5190 NSA 5200
Rackmount - X86 Based Performance Appliance NSA 7150 Series NSA 7160R
LAN Module NC 120FIS4-OS NC 120FMS4 NC 220FMS3-1 ND 180C-OS ND 184CX1-OS NI 140C-OS NI 142CX1 NI 142CX1-OS NI 180C-OS NI 180F-OS NI 184CX1 NI 184CX1-OS NI Series NL 110FI-OS NL 110FM-OS NQ Series NV 120F NV 140F-OS NX 140C-OS NX 140F-OS NX 142FX1 NX 142FX1-LR NX 142FX1-LR-OS NX 142FX1-OS NX Series
-
Edge & Cloud Solutions
5G Edge Solutions FWA over 5G uCPE
nexCPE™ Appliance DFA 1163 Series FTA 1170 FTA 5180
uCPE/Edge Appliance DTA 1160 DTA 1162 DTA 1164W Series DTA 1165
DTA 1376/1376A
DTA 1600
SD-WAN Appliance FTA 5190 NSA 6310/6310-1GE TCA 5170 TCA 5170B TCA 5170C TCA 6710 (ODM Only)
-
OT Security Solutions
-
Network Peripheral Solutions
NVR Solutions PNSA 3170 PNSA 3171/3171A PNSA 3190 PNSA 3280/3280A PNSA 3281/3281A
-
SoC Capability & S/W Services
No Series Page 01 Page 02 Page 03 Page 04 Page 05 Page 06 Page 07 Page 08 Page 09 Page 10 Page 11 Page 12 Page 13 Page 14
-
NVR Hardware Platform
AI NVR Workstation NVAiS 1502 NVAiS 8108
Rackmount NVR Platform NViS 5704 NViS 57244 NViS 6708 NViS 6712
-
Network Camera
Multi Sensor Camera NCp-521F NCp-551G NCp-811F NCp-831G NMP881
PTZ Camera NCs-551-211MSV-R NCs-831-000MSV-RS NCs-831-221MSV-R NDS295PRO
Dome Camera NCi-261 NCi-522 NCi-522C-F28RV3 NCi-822C-F28RV3 NCo-261 NCo-521 NCo-523C-F28RV3 NCo-525C NCo-811 NCo-823C-F28RV3 NCo-832C
-
Industrial Wireless Product
-
Remote Network Management
-
Embedded Computing
-
Video Conference System
-
Software Package
-
HealthCare & Medical
-
Embedded Boards
-
Vertical Applications
-
Computer-on-Modules (CCC)
Design-Win Support Spec-in Service Valiodation Service Value Added Services Design-in Assistance
Customization to Order Service
Business Models introduction
COM Technology
COM Express
ETX
COM Application
公告本公司除息基準日相關事宜
Bull 0
Bear 0
Routine
本公司受邀參加櫃買中心舉辦之「櫃買市場業績發表會」
Bull 0
Bear 0
Routine
本公司董事會決議通過115年第二季合併財務報告
Bull 0
Bear 5
Results
公告本公司115年第二季合併財務報告董事會召開日期
Bull 0
Bear 0
Routine
Bringing Smart City Applications to Users’ Fingertips with the XPPD Series
Bull 1
Bear 0
Product/operations
Most Viewed News see more
Physical AI Hits the Factory Floor: Predictive Optimization for Chemical Processes The chemical manufacturing industry is vital to Ta...
Open Innovation Platform Helps Shape the Landscape of IoT Applications The Internet of Things (IoT) inspired numerous app...
Edge Computing Shows IIoT Values with Instant Feedback and Response The heated discussion around Industry 4.0 and smar...
| Online Catalog 2021 Intelligent Platform & Services in Smart City Product Selection Guide |
July 28, 2026
Bringing Smart City Applications to Users’ Fingertips with the XPPD Series
From self-service kiosks and information terminals to parking systems and recycling machines, touchscreen displays have become an essential interface between users and digital services. Their intuitive operation allows people to access information, complete transactions, and perform everyday tasks quickly and efficiently. As digital transformation continues to reshape cities and public services, reliable touchscreen solutions play a critical role in delivering seamless user experiences. Meet NEXCOM’s XPPD series embedded touchscreen displays, designed to bring digital information directly to users’ fingertips.

One display platform, multiple possibilities
The XPPD series connects to existing computing platforms and serves as a durable, responsive touchscreen interface for a wide range of smart city and industrial applications. Available in 10.1" , 15.6" , and 23.8" display sizes, each model features 10-point PCAP touch, a slim-bezel design, anti-smudge coating, and IP66 front-panel protection for reliable operation in demanding environments. Flexible mounting options and multiple display interfaces simplify integration, while the CQ10 variants add DP and USB Type-C connectivity for even greater deployment flexibility.
A seamless interface between people and digital services
One of the greatest challenges in smart city deployments is making technology accessible to everyone. Whether checking parking information, navigating transportation systems, completing self-service transactions, or accessing public services, users expect intuitive and responsive interactions.
The XPPD series provides a familiar touchscreen experience through its 10-point PCAP technology, allowing users to interact naturally with displayed information. Available in multiple screen sizes, the displays can be tailored to the requirements of compact kiosks, information terminals, and larger public-facing installations.
Designed for public-facing environments
Interactive systems often operate continuously in locations exposed to heavy usage, dust, moisture, and frequent cleaning. To support these demanding conditions, the XPPD series features IP66 front-panel protection and an anti-smudge coating that helps maintain screen clarity, reduce visible fingerprints, and simplify maintenance.
Its slim-bezel, flush-mount design further enhances the user experience by creating a clean, modern appearance that integrates naturally into kiosks, cabinets, and control panels.
Deployment flexibility without system replacement
The XPPD series is designed to work with existing computing systems, allowing organizations to add touchscreen functionality without replacing their underlying hardware. Support for VESA, panel, and open-frame mounting enables straightforward integration into a variety of installations, while HDMI® connectivity provides compatibility with a broad range of embedded systems and industrial computers.
For applications requiring greater installation flexibility, the CQ10 variants add DisplayPort and USB Type-C connectivity, simplifying cabling and deployment in space-constrained environments. A single USB Type-C connection can simultaneously deliver video, touch data, and power, helping reduce cable clutter and streamline system integration.
Main Features
- 10.1” WXGA 16:10 panel / 15.6” TFT FHD 16:9 panel / 23.8” TFT FHD 16:9 panel
- 10-point PCAP multi-touch, with slim-bezel design
- IP66 front-panel protection
- Support VESA, panel, and open frame mounting
Ordering Information
XPPD 10-0P10 (P/N: 10W30XPPD05X0)
10.1” display with 10-point PCAP touchscreen, 1 x HDMI® input
XPPD 16-CQ10 (PN: 10W30XPPD04X0)
15.6” display with 10-point PCAP touchscreen, 1 x HDMI® input, 1 x DP input, 1 x USB Type-C
XPPD 24-0P10A (PN: 10W30XPPD03X0)
23.8” display with 10-point PCAP touchscreen, 1 x HDMI® input
-
Related Links:
-
Smarter Warehouse & Logistics Inspection Starts at the Edge with NDiS B340
-
Browse Other News:
-
Smarter Warehouse & Logistics Inspection Starts at the Edge with NDiS B340
-
NEXCOM Introduces RoboWIZ AI Robotics Platform at GTC Berlin
Committed to Customer Success ©2011-2023 NEXCOM International Co., Ltd. All Rights Reserved. Cookie Privacy Sitemap
Take a minute and tell us what you think!
-
eSAF Cybersecurity Platform
-
Industrial Fanless Computer
Cabinet Mount Controller Fanless PC CMC 300-F0x CMC 300-F13 CMC 300-F2x
Atom™ Compact NISE 105 NISE 105U NISE 106-N3710 NISE 107 NISE 107-E3940 NISE 108 NISE 109-E01/E02 NISE 110-A01/A02 NISE 50 A04-01 NISE 50 A04-02 NISE 50 A04-03 NISE 50 A04-04 NISE 505 NISE 50-J1900 NISE 51 NISE 51-J3455 NISE 52 NISE 53-E01/E02 NISE 70
Core™-i Performance NISE 3000 C30-E
NISE 3000 C30-E2/P2E
NISE 3000 C30-R
NISE 3000 C31-E2/P2E/E16
NISE 3600CE
NISE 3600CE2/P2/P2E
NISE 3700E
NISE 3700E2/P2/P2E
NISE 3900E
NISE 3900E2/P2/P2E
NISE 3900E-H310
NISE 3900R
NISE 3910E
NISE 3910E16/E2/P2/P2E
NISE 3910R
NISE 4310-E01
TT 300-A0Q
TT 300-A2Q/A3Q
TT 300-F00
TT 300-F30 -
Industrial Rackmount Computer
PICMG 1.0/1.3 SBC PEAK 887VL2 PEAK 888VL2 PEAK 889VL2 PEAK 890VL2 PEAK 980/980-H
PICMG 1.0/1.3 BackPlane NBP 0513 NBP 0522 NBP 0641 NBP 06E5 NBP 06P2 NBP 1024 NBP 1052 NBP 1257 NBP 142A0-CX NBP 14570-BX NBP 14570-CX NBP 1465 NBP 14670 NBP 1468 NBP 14880 NBP 2U040 NBP 2U220
Industrial Motherboard NEX 812 NEX 813 NEX 816 NEX 818 NEX 912P NEX 913 NEX 913C NEX 916 NEX 918 NEX 919
-
Embedded Computing
3.5'' / 5.25'' SBC EBC 260 EBC 355A EBC 355U Series EBC 355XP EBC 356 EBC 357 EBC 357X EBC 358 EBC 358X EBC 370/EBC 370X EBC359
Mini-ITX MB NEX 618 NEX 619 NEX 650-ADU
Computer-on-Module ICES 620-HCAD1-USB ICES 620X ICES 674 ICES 675 ICES 675S
-
Panel PC
Human Machine Interface eLITE610 eSMART04 eSMART07M eSMART10 eTOP504 eTOP507 eTOP510
Industrial Panel PC/ Monitor IPPC 1040P IPPC 1050P IPPC 1611-C11 IPPC 1640P IPPC 1650P IPPC 1660-A11 IPPC 1680P IPPC 1850P IPPC 1880P IPPC 2111-C11 IPPC 2140P IPPC 2150P IPPC 2160-A11 IPPC 2180P IPPC 2411-C11 IPPC 2460-A11
Applied Panel PC/ Monitor APPC 0760-A01
APPC 0760-A02
APPC 0760-A04
APPC 1060-A01
APPC 1060-A02
APPC 1060-A04
APPC 1240C-B01
APPC 1245T
APPC 1250T
APPC 1260T-A01
APPC 1540C-B01
APPC 1540T
APPC 1550T
APPC 1560-A01
APPC 1660-A01
APPC 1740C-B01
APPC 1740T
APPC 1750T
APPC 1760-A01
APPC 1940C-B01
APPC 1940T
APPC 1950T
APPC 1960-A01
APPC 2160-A01
APPC 3154
APPC160 C21-01
APPC210 C21-01
APPD 1200-1
APPD 1200-2
APPD 1500-1
APPD 1500-2
APPD 1600-2
APPD 1700-1
APPD 1700-2
APPD 1900-1
APPD 1900-2
APPD 2100-2 -
PC-based Factory Automation
miniPCIe Module - COM NISKECOM3 NISKECOM4 NISKLPT
miniPCIe Modules - Fieldbus FBI90E-COM FBI90E-DNM FBI90E-PBM FBI90E-REM NISKNVRAM
miniPCIe Module - I/O NISKDIO-8I8O
industrial Fieldbus Computer NIFE 106-A01 NIFE 106-A02 NIFE 200 NIFE 200P2/E2/P2E NIFE 200S NIFE210-E01/E02 NIFE210-E11/E12
-
Software Solution
IntervalZero RTX - RTOS RTX 2012 RTX64 2013
USB WhiteList USB WhiteList 1.0
Professional Software Service – BIOS, Bootloader, Kernel, eAPI, Driver & Embedded OS/BSP ProfessionalSoftware Service
-
Machine Automation
-
IoT Solutions
Arm-based HMI nHMI-07L nHMI-10M
Remote Data Acquisition System nDAS 6000 Series
-
Marine Computer
-
Slow Moving Embedded Boards
Slow moving embedded boards ICES 620-HCAD3 NEX 650-ADU NEX 812 NEX 813 NEX 885 NEX 910 NEX 913 NEX 980 PEAK 877VL2
-
Environment and Energy Solutions
Environment and Energy Solutions
Industrial IoT Data Acquisition System RN-30-EG01 RN-30-ND01/02
-
Duro Edge Computer
Accessories DockInfinity-2R8
DockInfinity-2S
DockInfinity-E4X1
DockInfinity-R16F
Compat ARM® NDiS B115 (EOL) NDiS B116 (EOL) NDiS B117
Compact Celeron® NDiS B327(EOL) NDiS B336R(EOL) NDiS B337 (EOL) NDiS B338 NDiS B338-LITE NDiS B339 NDiS B340 Series
Multi-display Computing System NDiS V1000 NDiS V1100
Energy Saver Core™ U NDiS B360 NDiS B361 NDiS B362 NDiS B363 NDiS B364
Hi-Power Core™ NDiS B535 (EOL) NDiS B537 (EOL) NDiS B560 (EOL) NDiS B560-Q (EOL) NDiS B560S (EOL) NDiS B560S-H (EOL) NDiS B561/B561-PoE NDiS B561S NDiS B562 Series NDiS B562-Q Series
-
Embedded Touchscreen Computer
Slim Touchscreen Computer (SPPC Intel® Celeron®) SPPC 16-10N150
High Brightness Touchscreen Computer (HPPC Intel Celeron®) HPPC 12-10X7211 HPPC 15-10X7211
Wide Touchscreen Computer (XPPC Intel® Core™) XPPC 10-200 XPPC 16-200 XPPC 16-201 XPPC 24-200A
Wide Touchscreen Computer (XPPC Intel® Celeron®) XPPC 10-100 (EOL) XPPC 10-100-Ag+ (EOL) XPPC 10-10N97 XPPC 16-100 (EOL) XPPC 16-101 (EOL) XPPC 16-105N150
XPPC 16-105N97
XPPC 16-10N97
XPPC 22-100A (EOL)
XPPC 24-100A (EOL)
XPPC 24-10N97A
4:3 Open Frame Panel PC (OPPC) OPPC 1240T OPPC 1540HT-J1900 OPPC 1540TSeries OPPC 1740T OPPC 1940HT-J1900 OPPC 1940TSeries
-
Edge AI Computer
NVIDIA Solution AIEdge-X®300 AIEdge-X®300-RTX30 AIEdge-X®310 AIEdge-X®500 AIEdge-X®80 AIEdge-X®80-NA AIEdge-X®80-NX-S
Google Coral Solution AIEdge-X®100 AIEdge-X®537 NISE 3800E-GCIoT NISE 50-GCIoT
Intel Movidius Solution AIEdge-X®100-VPU AIEdge-X®300-VPU AIEdge-X®500 AIEdge-X®537-VPU
-
Edge Computing System
Neu-X3 Core™ Series Neu-X1025-N305 Neu-X102-i3 Neu-X1045-N355 Neu-X104-i3 Neu-X302 Neu-X303 Neu-X303mini Neu-X304
Neu-X1 Atom® Series Neu-X100 Neu-X101 Neu-X101-6C-DC Neu-X1025-N50 Neu-X1025-N97 Neu-X102-N50 Neu-X102-N97 Neu-X1045-N150 Neu-X104-N150 Neu-X60 Neu-XE102-N50-4C Neu-XE102-N97-14C2S Neu-XE102-N97-6C2S Neu-XE104-N150-14C2S Neu-XE104-N150-6C2S Neu-XE105-N50-12U
-
Embedded Computing Board
Embedded Add-on Module/Card NTK-MEE-LAN
Mini-ITX Board V1000 V1100 X300 X302 X304-MTX
3.5" Board X100-J3455-P X101 X102 X103 X104 X105-7433RE
X105-N150
X200
X201
X202
X203
X204
X314 -
Embedded Touchscreen Display
Embedded Touchscreen Display XPPD 10-0P10
XPPD 16-CQ10
XPPD 24-0P10A -
Vehicle Telematics Computer
Atom® Compact VTC 1010 VTC 1011 VTC 1020 VTC 1020-PA VTC 1021-BK/C2K VTC 1030 VTC 1031/1031-C2 VTC 1040/1040-C2 VTC 1910-S VTC 1911-IPK VTC 1920 VTC 1921-IP / VTC1921-C2IP
Atom® Performance VTC 6210-BK VTC 6210-VR4 VTC 6220-BK VTC 6221 VTC 6222 VTC 6231 VTC 6231-IP VTC 6232 VTC 6232-C4SIP
Core™ Power Efficient VTC 7260-x VTC 7260-xC4 VTC 7280-7/-5 VTC 7280-7C5/-5C5
Core™ Performance VTC 7250-7C8 VTC 7251 VTC 7251-7C4 VTC 7252-7C4IP VTC 7270 VTC 7270-C4/C8
-
Railway Computer
Atom® Compact nROK 1020 nROK 1030 nROK 1031 Series nROK 1040-A/-AC2 VTC 1911-IPK
Atom® Performance nROK 6221 nROK 6221-IP nROK 6222 nROK 6231 Series nROK 6232-AC4S nROK 6232-WIC4S VTC 6210-R
Core™ Performance aROK 5510 aROK 8110 nROK 7251-7A nROK 7251-7C4 nROK 7251-WI-7C4IP nROK 7252-AC8S nROK 7252-WI2-C8S nROK 7270 nROK 7271 nROK 7280-7AC5IP/-5AC5IP nROK 7280-7WIC5IP/-5WIC5IP
-
Edge AI Telematics Solution
NVIDIA Jetson Platform ATC 3530-IP7-4C ATC 3560-IP7-NA4C ATC 3560-IP7-NX4C ATC 3560-IP7-NX4CF ATC 3560-IP7-NXAI4CR ATC 3561-NA4C ATC 3561-NX4CF ATC 3562-IP7-NA4M ATC 3562-IP7-NX4MF ATC 3563-NA8C/NAA8CR ATC 3563-NX8C/NXA8CR ATC 3750-6C ATC 3750-A6CR ATC 3750-IP7-6C ATC 3750-IP7-8M ATC 3750-IP7-WI6CR ATC 3750-IP7-WI8MR
NVIDIA Discrete Card aROK 5510 aROK 8110 aROK 8120-AC4F ATC 8010/8010-F ATC 8110/8110-F ATC 8120-C4F rROK 5520
Hailo Module VTC 1021-HBIoT/HCIoT VTC 7260-5HBIoT/7HBIoT VTC 7260-5HCIoT/7HCIoT
-
Vehicle Mount Computer
-
Vehicle Mount Display
-
IP Rating Computer/Display
Edge AI Telematics Solution ATC 3530
Vehicle Mount Display VMD 3002 VMD 3110
Vehicle Mount Computer VMC 2020
-
In-Vehicle Networking
-
PIS Solution
-
Telematics Solution with Android
Telematics Solution with Android
-
Embedded Add-on Module/Card
Converter VIOB-LTE/EKEY Converter
-
Universal Fitness Console
-
Railway Panel Computer
-
Cyber Security Solutions
Expansion Cards NA 1000-L2X NAI 1000-OS NSK 6301 NSK 6402-NVME/6404-NVME TPM9660-TT
Desktop - Soc Based Appliance DTA 1600
PDTA 1370
PDTA 1372
Desktop - X86 Based Appliance DNA 1160 DNA 1170A DNA 140 DNA 141
Rackmount - SoC Based Appliance
Rackmount - X86 Based Entry Level Appliance NSA 1160/1160A NSA 1170 NSA 3170 NSA 3170A NSA 3170HA NSA 3180A NSA 3180HA NSA 3190A NSA 3200
Rackmount - X86 Based Mainstream Appliance NSA 5181 NSA 5190 NSA 5200
Rackmount - X86 Based Performance Appliance NSA 7150 Series NSA 7160R
LAN Module NC 120FIS4-OS NC 120FMS4 NC 220FMS3-1 ND 180C-OS ND 184CX1-OS NI 140C-OS NI 142CX1 NI 142CX1-OS NI 180C-OS NI 180F-OS NI 184CX1 NI 184CX1-OS NI Series NL 110FI-OS NL 110FM-OS NQ Series NV 120F NV 140F-OS NX 140C-OS NX 140F-OS NX 142FX1 NX 142FX1-LR NX 142FX1-LR-OS NX 142FX1-OS NX Series
-
Edge & Cloud Solutions
5G Edge Solutions FWA over 5G uCPE
nexCPE™ Appliance DFA 1163 Series FTA 1170 FTA 5180
uCPE/Edge Appliance DTA 1160 DTA 1162 DTA 1164W Series DTA 1165
DTA 1376/1376A
DTA 1600
SD-WAN Appliance FTA 5190 NSA 6310/6310-1GE TCA 5170 TCA 5170B TCA 5170C TCA 6710 (ODM Only)
-
OT Security Solutions
-
Network Peripheral Solutions
NVR Solutions PNSA 3170 PNSA 3171/3171A PNSA 3190 PNSA 3280/3280A PNSA 3281/3281A
-
SoC Capability & S/W Services
No Series Page 01 Page 02 Page 03 Page 04 Page 05 Page 06 Page 07 Page 08 Page 09 Page 10 Page 11 Page 12 Page 13 Page 14
-
NVR Hardware Platform
AI NVR Workstation NVAiS 1502 NVAiS 8108
Rackmount NVR Platform NViS 5704 NViS 57244 NViS 6708 NViS 6712
-
Network Camera
Multi Sensor Camera NCp-521F NCp-551G NCp-811F NCp-831G NMP881
PTZ Camera NCs-551-211MSV-R NCs-831-000MSV-RS NCs-831-221MSV-R NDS295PRO
Dome Camera NCi-261 NCi-522 NCi-522C-F28RV3 NCi-822C-F28RV3 NCo-261 NCo-521 NCo-523C-F28RV3 NCo-525C NCo-811 NCo-823C-F28RV3 NCo-832C
-
Industrial Wireless Product
-
Remote Network Management
-
Embedded Computing
-
Video Conference System
-
Software Package
-
HealthCare & Medical
-
Embedded Boards
-
Vertical Applications
-
Computer-on-Modules (CCC)
Design-Win Support Spec-in Service Valiodation Service Value Added Services Design-in Assistance
Customization to Order Service
Business Models introduction
COM Technology
COM Express
ETX
COM Application
One Platform, 17 Systems, Zero Blind Spots: How a Taiwanese Snack Manufacturer Took Control of Multi-Plant Operations
Bull 1
Bear 0
Other
Most Viewed News see more
Physical AI Hits the Factory Floor: Predictive Optimization for Chemical Processes The chemical manufacturing industry is vital to Ta...
Open Innovation Platform Helps Shape the Landscape of IoT Applications The Internet of Things (IoT) inspired numerous app...
Edge Computing Shows IIoT Values with Instant Feedback and Response The heated discussion around Industry 4.0 and smar...
Video see more
| [NOW OPEN] Make Future City into Reality: NEXCOM Future City Virtual Expo NEXCOM Future City Virtual Expo is Now Open! Start...[NOW OPEN] Make Future City into Reality: NEXCOM Future City Virtual Expo |
July 28, 2026
One Platform, 17 Systems, Zero Blind Spots: How a Taiwanese Snack Manufacturer Took Control of Multi-Plant Operations
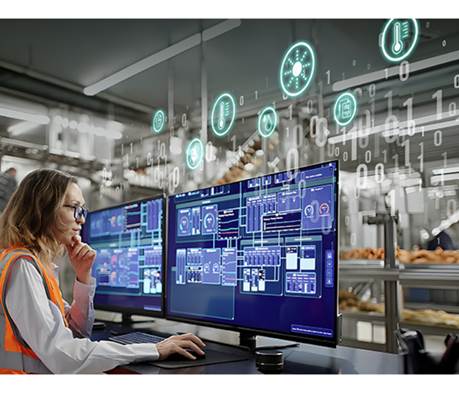
Impact at a Glance
- Reduced Monitoring Headcount: Shift monitoring requirements decreased by 1–2 personnel through centralized visibility, automated data collection, and real-time alerts, freeing teams to focus on analysis and production decisions.
- Faster Operational Response: Detection cycles shortened from manual checks to continuous, automated monitoring, enabling teams to respond to operational abnormalities before production is affected.
- Proactive Energy Management: Real-time electrical load visibility and automated threshold alerts allow operators to intervene before utility demand limits are exceeded, upgrading energy management into an active control process.
- Scalable Multi-Plant Operations: A single remotely accessible SCADA platform now unifies more than 17 operational systems across multiple expanding sub-plants, providing the visibility and management infrastructure needed for continued growth.
Before vs. After Deployment
| Operational Aspect | Legacy Environment | After NEXCOM Deployment |
|---|---|---|
| Data Collection | Operators manually collected meter readings and equipment data every 1–2 hours, leaving critical visibility gaps between inspections. | Operational data is automatically collected and centralized in real time across all factory systems. |
| System Visibility | Production, utility, and environmental systems operated in isolation with no cross-system view. | A unified SCADA platform delivers centralized visibility across production, energy, water, and environmental infrastructure. |
| Energy Management | Utility demand issues were typically identified only after thresholds had already been exceeded. | Real-time monitoring and automated alerts enable operators to respond before demand limits are breached. |
| Anomaly Detection | Equipment abnormalities and environmental deviations were discovered during scheduled walkarounds — often hours after onset. | Real-time alarms accelerate investigation and enable response before issues escalate into production disruptions. |
| Workforce Requirements | Continuous monitoring required 4–5 personnel per shift for routine inspections and manual data collection. | Routine monitoring requirements reduced by 1–2 personnel per shift through automation and centralized oversight. |
| Management Access | Monitoring was limited to on-site control rooms. | Plant managers can remotely monitor operations through web-based desktop and mobile access from anywhere. |
The Challenge: Scaling Without Visibility
Our client, a major Taiwanese foods company, owns a primary manufacturing base for its classic and best-selling snack brands. In this high-throughput facility, precision is everything. Frying temperatures, ambient conditions, line yield rates, and process parameters must be exact. Any deviation, however small, can mean compromised product quality, increased waste, or an unplanned production halt.
As the client expanded capacity and brought new sub-plants online, maintaining that precision became increasingly difficult. More than 17 critical plant operations and production systems ran in isolation, each relying on its own interface and communication protocol. There was no unified view of the plant's massive data output, which included:
- Power Integration Monitoring: 11 distinct power panels continuously tracking voltage, current, power factor, and power consumption.
- Water Usage Monitoring: Front and back well systems tracking accumulated water consumption.
- Production Equipment: Fryers require strict oversight of vacuum pump temperature, pressure limits (PV/SV), fryer and condenser temperatures, frying timers, and basket lift intervals. Additionally, two NIR alarm systems track temperatures, active production recipes, and upper/lower recipe limits.
- Environmental Systems: Factory-wide temperature and humidity sensors.
Operators compensated by walking the floor every one to two hours to manually collect these highly granular meter readings and equipment states. It was heavily labor-intensive and left massive visibility gaps. If the fryer's vacuum pressure drifted out of spec, electrical demand on the facility's power panels crept toward utility thresholds, or ambient humidity shifted, no one knew until the next manual inspection. By then, the damage to product quality, energy costs, or production continuity was already done. Replacing infrastructure wholesale wasn't an option; the solution had to bridge these legacy systems without disrupting active production.
The NEXCOM Solution: A Unified Operational Center
Rather than replacing existing systems, NEXCOM Industry AIoT (NexAIoT Co., Ltd.) engineered a solution around them, deploying a centralized SCADA platform that could unify the facility's existing EMS, environmental monitoring, and production systems through a single, coherent interface.

At the core of the deployment is a two-tiered architecture bridging the factory's field devices and the supervisory system. The nDAS 6000 data acquisition (DAQ) gateway acts as a universal translator, leveraging its extensive protocol support to extract and normalize real-time data from all 17 isolated systems—including production fryers, high-voltage power panels, and water meters. This unified data stream feeds directly into the NEXCOM NISE 3900R industrial computer running JMobile SCADA. By consolidating these previously scattered metrics into one real-time environment, the platform gives operators a complete, single-dashboard view of facility conditions without the need to navigate competing interfaces.
Critically, the deployment improved operational visibility without requiring major infrastructure replacement. Existing EMS and environmental monitoring systems were integrated into the unified platform, protecting prior technology investments while extending their usefulness.
Real-Time Monitoring and Response
Instead of running across the factory floor to check isolated control panels, operators and plant managers now see the entire facility from a single screen, accessible on desktop or mobile from anywhere. Through JMobile SCADA, teams now have continuous access to:
- Live plant visualization across all connected systems
- Real-time operational data and trend analysis
- Automated alarm notifications for threshold breaches and anomalies
- Historical performance records for root cause analysis and reporting
- Remote monitoring via web-based desktop and mobile access
When an abnormality occurs, such as a temperature deviation on a frying line, an unexpected equipment reading, or a power demand spike, affected systems are immediately visible. Teams can review current operating conditions and coordinate corrective action before issues escalate into batch losses, quality failures, or production stoppages.
Outcomes
Improved Operational Efficiency
Following deployment, routine shift monitoring requirements decreased from 4–5 personnel to 3–4 personnel, while continuous visibility across operations was maintained and improved.
Automated data collection, centralized dashboards, and real-time alerts eliminated the manual walk round cycles that had consumed significant operator time. Teams now spend less time gathering information and more time acting on it: analyzing conditions, anticipating issues, and supporting production decisions.
Faster Decision-Making and Operational Response
Near real-time visibility into production, environmental, and utility conditions has fundamentally changed how the facility responds to operational events.
Equipment abnormalities and environmental deviations that once depended on scheduled inspections can now be identified and investigated within minutes. Faster detection means faster coordination: production, engineering, and maintenance teams align on response actions earlier, reducing the likelihood of prolonged disruptions or quality impacts across production lines.
Predictive Energy Control and Hazard Prevention
The platform transforms energy management from reactive oversight to predictive control by providing deep trend analysis of critical metrics like voltage, current, power factor, and accumulated consumption. By visualizing emerging energy trends over time, operators can anticipate peak demands and take preemptive action—such as staggering equipment startups or adjusting production runs—long before utility demand thresholds are even threatened.
Beyond cost optimization, continuous monitoring provides a crucial layer of electrical safety. Tracking anomalies in power signatures acts as an early warning mechanism for equipment degradation. Maintenance teams can instantly detect irregularities, such as capacitor aging or abnormal thermal stress, enabling them to intervene early and prevent dangerous electrical hazards or costly factory fires.
Scalable Multi-Plant Operations
As our client continues expanding across multiple facilities and sub-plants, centralized visibility has become a core operational capability rather than a convenience.
Real-time alerts are automatically delivered whenever operational abnormalities or environmental deviations occur. Plant managers can remotely monitor facility conditions, review live operational data, and coordinate responses without being physically present on the factory floor. The unified architecture is designed to absorb new systems and facilities as expansion continues, without adding monitoring complexity.
Conclusion
By unifying more than 17 previously fragmented systems into a centralized SCADA platform, NEXCOM Industry AIoT helped our client move from reactive monitoring to genuine operational control. The deployment improved visibility across critical production and facility systems, reduced manual monitoring workloads, accelerated response to abnormalities, and gave management teams the remote access and scalability needed to grow with confidence.
All of this was achieved without replacing existing infrastructure, allowing our client to modernize operations while fully preserving prior technology investments.
Today, the centralized architecture provides the operational visibility, responsiveness, and management capabilities that a high-throughput food manufacturing environment demands, along with a strong foundation for whatever expansion comes next.
-
Related Links:
-
Before the Numbers Could Talk: Verifying Energy Savings at a Water Treatment Plant
-
NEXCOM Joins Forces with Intel at COMPUTEX 2026: Defining New Standards for Smart Production Lines
-
Browse Other News:
-
Smarter Warehouse & Logistics Inspection Starts at the Edge with NDiS B340
-
NEXCOM Introduces RoboWIZ AI Robotics Platform at GTC Berlin
Committed to Customer Success ©2011-2023 NEXCOM International Co., Ltd. All Rights Reserved. Cookie Privacy Sitemap
Take a minute and tell us what you think!
AI-Powered PPE Monitoring for Safer Steel Coil Packaging Operations
Bull 1
Bear 0
Product/operations
Most Viewed News see more
Physical AI Hits the Factory Floor: Predictive Optimization for Chemical Processes The chemical manufacturing industry is vital to Ta...
Open Innovation Platform Helps Shape the Landscape of IoT Applications The Internet of Things (IoT) inspired numerous app...
Edge Computing Shows IIoT Values with Instant Feedback and Response The heated discussion around Industry 4.0 and smar...
July 16, 2026
AI-Powered PPE Monitoring for Safer Steel Coil Packaging Operations
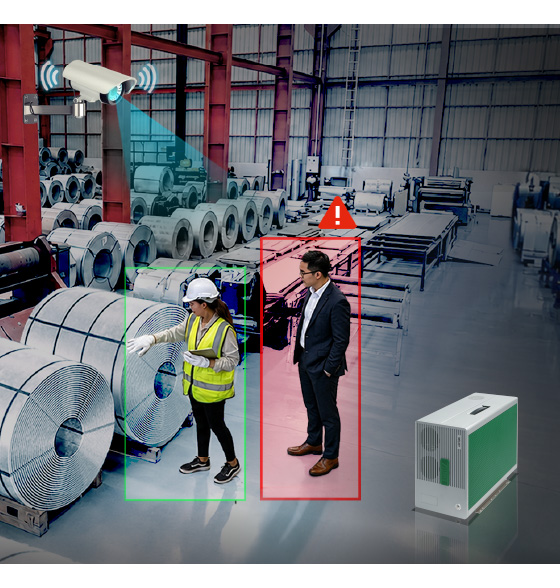
Impact at a Glance
When PPE compliance breaks down, safety risks escalate quickly. A 2024 meta-analysis published in BMC Public Health, covering 36,470 workers across nine countries, found that workers who failed to wear personal protective equipment (PPE) were 4.06 times more likely to be injured than compliant workers, making PPE non-compliance a greater risk factor than nightshift work or years of service.
Many steel coil packaging facilities still rely on periodic patrols and post-incident video reviews, creating gaps where PPE violations can go unnoticed. In contrast, edge AI-powered monitoring closes these gaps through continuous detection, real-time alerts, and automated compliance documentation.
| Area | Traditional Approach | AI Edge Vision Approach |
|---|---|---|
| PPE Monitoring | Manual floor patrols | Continuous automated monitoring |
| Violation Response | Supervisor-dependent | Automated real-time alerts |
| Incident Review | Post-incident video review | Immediate detection and logging |
| EHS Workload | High manual inspection burden | Reduced audit and inspection effort |
| Compliance Records | Fragmented manual review | Centralized digital audit trail |
From Periodic Patrols to Continuous Coverage
Manufacturers supplying tinplate packaging materials to the global F&B industry operate highly automated facilities where worker safety remains critical. For instance, in steel coil packaging environments, employees routinely work around heavy materials, lifting equipment, and automated machinery. PPE requirements — safety helmets, protective eyewear, wrist guards — help reduce workplace risk, but ensuring consistent compliance across multiple work zones is a resource-intensive task that traditional methods struggle to meet.
In a typical operation, supervisors oversee several production areas simultaneously. Routine patrols catch visible violations but cannot continuously track every worker across an entire shift. Legacy surveillance systems face the same ceiling: footage supports investigations after an incident but does nothing to prevent the next one.
The result is a set of operational risks: PPE violations go undetected between patrols. Unsafe behavior persists for minutes or hours before anyone intervenes. Audit preparation consumes significant EHS hours. And without trend data, recurring safety risks stay invisible until they become incidents.
This is where automated monitoring steps in and directly addresses each of these gaps.
How NEXCOM's Edge AI Computing Solution Works
NEXCOM Industry AIoT's (NexAIoT Co., Ltd.) edge AI portfolio delivers intelligent PPE monitoring directly within industrial environments by combining industrial cameras, edge AI processing, automated alerts, and centralized reporting into a single continuous safety workflow. The objective is clear: automatically identify sustained PPE violations, notify personnel in real time, and maintain a searchable compliance record for future review.
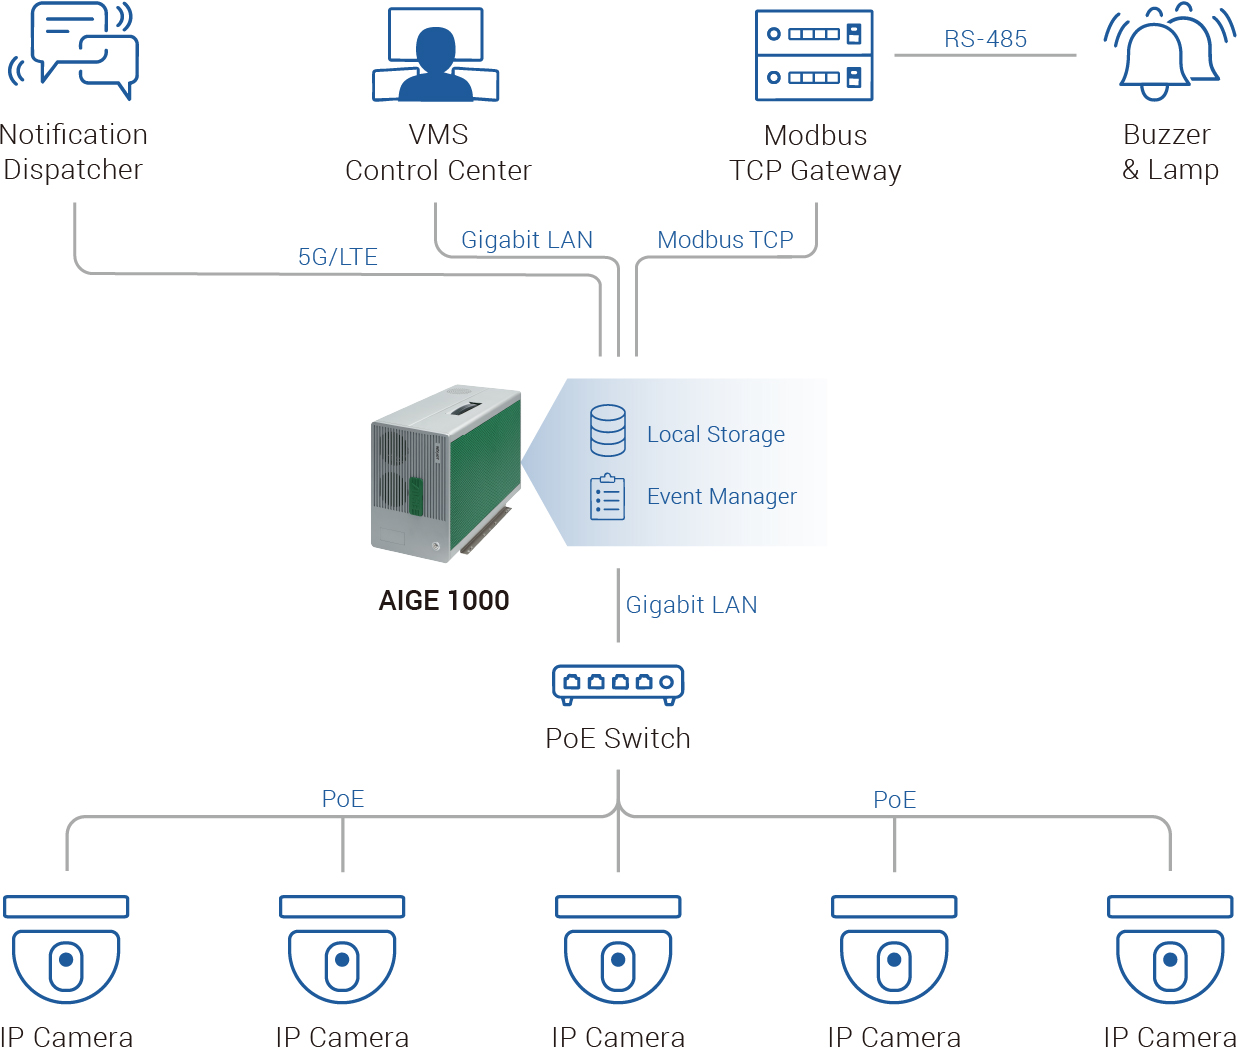
A typical deployment runs on the NEXCOM AIGE 1000 C10 , which processes real-time monitoring workloads locally at the edge across four integrated functions:
1. Video Capture
Multiple IP cameras installed across packaging lines, lifting zones, and material handling areas feed live streams via Gigabit LAN. Coverage is continuous throughout operating hours, not limited to inspection windows.
2. AI Detection
Video streams are analyzed in real time by AI vision models running locally on the edge platform. The system detects missing PPE and other site-specific equipment with sustained accuracy above 91%. To eliminate false positives from routine adjustments, a configurable persistence threshold requires a violation to appear across 100 frames within a 10-second window before triggering a response.
3. Automated Alerting
When a sustained violation is confirmed, the system immediately activates warning lights and buzzers through the plant's alarm system via Modbus TCP. Simultaneously, incident footage and event details are logged to the central monitoring platform, which distributes real-time notifications to safety personnel's mobile devices. Because alerts fire while the unsafe behavior is still occurring, corrective action begins in real time; not after the fact.
4. Incident Documentation
Raw footage is recorded locally with a 7-day auto-purge policy. When a violation is detected, a 30-second clip is automatically extracted and dispatched to the centralized VMS database for long-term retention and audit access. All events are tagged and searchable, allowing safety personnel to locate specific incidents in seconds rather than scrubbing through hours of footage.
What This Means for EHS Teams and Plant Operations
Deploying continuous AI-powered PPE monitoring produces tangible operational improvements across safety management, compliance, and audit readiness.
1. Safety personnel shift from reactive to proactive.
Routine monitoring is automated across all production areas, freeing EHS teams from repetitive patrol cycles. Instead of managing inspections, safety personnel focus on interpreting data, addressing root causes, and advancing higher-priority safety initiatives.
2. Violations are caught and corrected faster.
Real-time alerts shorten the window between unsafe behavior and intervention from hours to seconds. Violations that previously went unnoticed between patrols are now flagged and addressed while they are still happening.
3. Audit preparation becomes a matter of minutes.
Automatically tagged incidents, searchable video records, and system-generated violation reports replace the manual documentation process. When internal reviews or external audits occur, the evidence is already organized and ready.
4. Compliance trends become visible and actionable.
Historical event data reveals which production areas generate the most violations, which PPE types are most frequently missing, and whether compliance improves or deteriorates over time. EHS teams move from reacting to incidents to preventing them through targeted, data-driven interventions.
5. Enforcement standards become consistent across shifts.
Automated detection applies the same criteria at 6 AM as it does at 10 PM, eliminating the variability inherent in human observation across different supervisors, shifts, and fatigue levels.
One Edge Platform, Multiple Applications
Real-time analysis of multiple high-resolution video streams demands serious computing infrastructure. Built for this exact workload, the AIGE 1000 C10 supports Intel® 12th, 13th, and 14th Gen Intel® Core™ processors and features a PCIe x16 expansion slot capable of accommodating high-performance GPUs with up to 500W power consumption. This provides the AI acceleration necessary to run advanced computer vision models at low latency without relying on cloud connectivity.
Because processing happens entirely at the edge, video data never leaves the facility. Network bandwidth requirements stay low, response latency remains minimal, and operations are unaffected by internet disruptions—a critical advantage for manufacturers where reliability and data sovereignty are non-negotiable.
PPE monitoring is only the beginning. The system eliminates single-purpose hardware, acting as a unified foundation for facility-wide intelligence. Using existing cameras, manufacturers can instantly activate new AI workloads—expanding from basic helmet detection to forklift tracking and intrusion alerts.
Build Safety Infrastructure That Scales
PPE compliance is not a problem that periodic inspections can fully solve in high-activity production environments. The gaps between patrols are where violations persist, incidents develop, and audit trails go dark.
NEXCOM Industry AIoT's edge AI platform closes those gaps. It turns passive surveillance infrastructure into an active safety system: It detects violations in real time, triggers immediate corrective action, and produces compliance records that manual oversight cannot reliably generate.
This architecture extends directly to production. The same engine driving safety protocols also powers visual quality inspections and predictive maintenance. As operational demands grow, simply upgrade the GPU without replacing the platform, maximizing ROI as your facility scales.
For manufacturers ready to move beyond reactive safety management, the AIGE 1000 C10 provides the foundation: proven in demanding industrial environments, built for continuous AI workloads, and designed to expand as operational requirements evolve.
-
Related Links:
-
Physical AI Hits the Factory Floor: Predictive Optimization for Chemical Processes
-
Browse Other News:
-
Smarter Warehouse & Logistics Inspection Starts at the Edge with NDiS B340
-
NEXCOM Introduces RoboWIZ AI Robotics Platform at GTC Berlin
Committed to Customer Success ©2011-2023 NEXCOM International Co., Ltd. All Rights Reserved. Cookie Privacy Sitemap
Take a minute and tell us what you think!
Use Case
Bull 0
Bear 0
Routine
Most Viewed News see more
Physical AI Hits the Factory Floor: Predictive Optimization for Chemical Processes The chemical manufacturing industry is vital to Ta...
Open Innovation Platform Helps Shape the Landscape of IoT Applications The Internet of Things (IoT) inspired numerous app...
Edge Computing Shows IIoT Values with Instant Feedback and Response The heated discussion around Industry 4.0 and smar...
Solutions Demo see more
| eSAF for Industry 4.0/Smart Manufacturing Security OT Security by eSAF Micro-Segregation:...eSAF for Industry 4.0/Smart Manufacturing Security |
Video see more
| NEXCOM Outdoor Computer Solution 00:00 Intro 00:34 NEXCOM IP65/ IP67 industrial c...NEXCOM Outdoor Computer Solution |
| Online Catalog 2026 Intelligent Platform & Service in Smart City Product Selection Guide |
Use Case
Find a news: --Select Year-- 2026 2025 2024 --Select One-- IoT Automation Solutions OT Cybersecurity Solution Industrial Wireless Solutions Medical & Healthcare Informatics Intelligent Video Surveillance Intelligent Platform @ Smart City Mobile Computing Solutions Network and Communication Solutions
- July 16, 2026
- AI-Powered PPE Monitoring for Safer Steel Coil Packaging Operations AI-powered PPE monitoring detects safety violations in real time. NEXCOM's edge AI platform automates alerts & compliance records.
- October 28, 2025
- No Escape for Robot Hackers: Breaking the Kill Chain with AI/ML-Driven OT Cybersecurity in E-Commerce Warehouses As e-commerce warehouses evolve into hyper-automated ecosystems powered by intelligent robots and AMRs, every connected robotic system represents not just productivity, b...
- July 30, 2025
- Physical AI Hits the Factory Floor: Predictive Optimization for Chemical Processes The chemical manufacturing industry is vital to Taiwan and the global economy but faces rising complexity and inefficiencies in quality control. Traditional methods fall ...
- June 26, 2025
- When You Knows but Can’t Act: The Hidden Hurdle in Semiconductor Smart Manufacturing As Taiwan continues to advance its semiconductor leadership, the gap between knowing and doing has become a growing pressure point in smart manufacturing. See how NEXCOM ...
- March 17, 2025
- The Great Train Robbery: How We Captured the Tech Struggles Bandits Optimize railway safety with AI-powered image analysis. NEXCOM's nROK 7280-AC5IP and VTK-SCAP simplify wiring, ensure stable power, and handle large data volumes. Featuri...
- April 30, 2024
- AI Emerges as a Game-Changer in Disaster Management: From Reactive to Proactive Throughout history, humanity has constantly faced the threat of natural disasters, such as earthquakes, hurricanes, wildfires, and floods, which have the potential to cau...
Committed to Customer Success ©2011-2023 NEXCOM International Co., Ltd. All Rights Reserved. Cookie Privacy Sitemap
Take a minute and tell us what you think!
代重要子公司新漢智能系統股份有限公司公告- 115年股東常會重要決議事項
Bull 0
Bear 0
Routine
本公司115年股東常會重要決議事項
Bull 0
Bear 0
Routine
更正本公司115年第1季iXBRL申報重大或有負債及未認列之合約承 諾部分資訊
Bull 0
Bear 0
Routine
本公司董事會通過解除經理人競業禁止限制案
Bull 0
Bear 0
Routine
本公司董事會決議114年度股利分派
Bull 1
Bear 0
Capital return
公告本公司董事會通過代理發言人異動案
Bull 0
Bear 0
Routine
本公司董事會決議通過115年第1季合併財務報告
Bull 0
Bear 4
Results
公告本公司115年第一季合併財務報告董事會召開日期
Bull 0
Bear 0
Routine
代重要子公司新漢智能系統股份有限公司公告- 董事會決議召開115年股東常會
Bull 0
Bear 0
Routine
公告本公司代理發言人異動
Bull 0
Bear 0
Routine
Prompts
Click prompts to add them under the company line, click again to take one out, then copy the result into your AI chat. Shared by Asian Century Stocks and Uncovered Thai Stocks. Thank you.
NEXCOM International Co., Ltd. (ticker 8234.TWO), listed in Taiwan.
Copied
ETFs Holding NEXCOM International Co., Ltd.
Exchange-traded funds whose newest published daily portfolio holds one of the company's listings, largest weight first.