公告本公司庫藏股註銷減資變更登記完成
Bull 0
Bear 0
Routine
8027.TWO
|
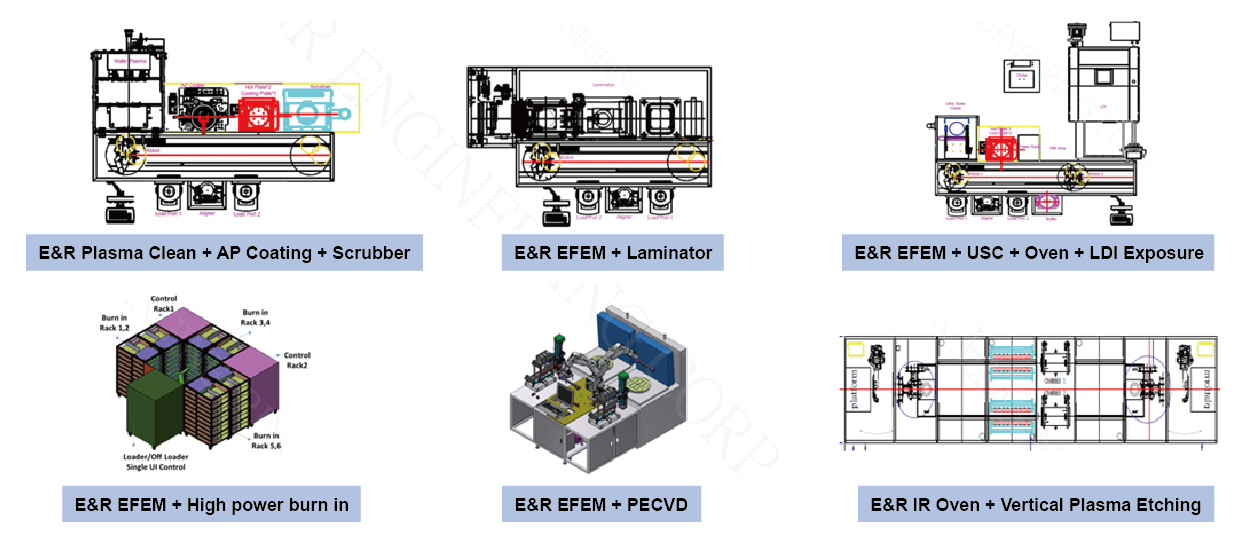
E&R Engineering Corporation is a manufacturer of automation equipment and process solutions for the semiconductor, LED, passive and active components, and biotechnology industries. The company provides laser processing, plasma cleaning, and flexible printed circuit (FPC) equipment, along with carrier tape packaging materials. It develops customized equipment and process solutions for clients, including major global brands, and conducts research and development in Taiwan. Founded in 1994, the company serves customers worldwide with products designed and produced in Taiwan. Summarised from the company's own disclosures |
Industry Specialty Industrial Machinery | Homepage enr.com.tw |
| Sector Industrials | IR page enr.com.tw | |
|
Tags
laser processing, plasma cleaning, fpc equipment, semiconductor equipment, led equipment, biotechnology equipment, automation, packaging materials
|
Press page — |
Metrics
| Valuation | |
|---|---|
| Market cap | NT$ 12.135B |
| Market cap (USD) | $ 368.311M |
| P/E | -289.47 |
| PEG | — |
| P/BV | 4.23 |
| P/S | 5.28 |
| P/OCF | 34.16 |
| P/FCF | — |
| Dividend yield | — |
| Turnover / mcap | — |
| Returns | |
|---|---|
| ROE | -3.6% |
| ROI | -3.7% |
| ROIC | -2.2% |
| Profit margin | -5.4% |
| Growth | |
|---|---|
| Revenue growing | Yes |
| Profits growing | No |
| Revenue up 3y | No |
| Revenue up 5y | No |
| Earnings growth 3y (net profit CAGR) | — |
| Quality | |
|---|---|
| Profitable | No |
| Margin expanding | No |
| Buying back stock | No |
| Diluting (TTM) | Yes |
| Debt/Equity | — |
| Podcast bulls (TTM) | Sign up |
| Podcast bears (TTM) | Sign up |
| Podcast sentiment (TTM) | Sign up |
| Podcast sentiment % (TTM) | Sign up |
| News sentiment (TTM) | 0 |
| Quality score | -75.0% |
| Insiders | |
|---|---|
| Buys, 1w | Sign up |
| Buys, 1m | Sign up |
| Buys, 1y | Sign up |
| Sells, 1w | Sign up |
| Sells, 1m | Sign up |
| Sells, 1y | Sign up |
Sign up to see this company's insider trades
| Figure | FY 2025 | FY 2024 | FY 2023 | FY 2022 | FY 2021 | FY 2020 | FY 2019 | FY 2018 | FY 2017 | FY 2016 | FY 2015 | FY 2014 | FY 2013 | FY 2012 | FY 2011 | FY 2010 |
|---|---|---|---|---|---|---|---|---|---|---|---|---|---|---|---|---|
| Revenue | 1.809B | 1.645B | 1.549B | 3.223B | 2.545B | 2.041B | 1.469B | 2.051B | 1.426B | 1.392B | 1.542B | 1.994B | 1.315B | 1.373B | 1.001B | 1.35B |
| Net profit | -97.799M | -51.125M | 30.911M | 390.789M | 243.979M | 161.266M | -80.86M | 100.215M | -86.738M | -128.451M | 308K | 117.23M | 24.787M | 82.856M | 15.004M | 95.585M |
| Figure | FY 2025 | FY 2024 | FY 2023 | FY 2022 | FY 2021 | FY 2020 | FY 2019 | FY 2018 | FY 2017 | FY 2016 | FY 2015 | FY 2014 | FY 2013 | FY 2012 | FY 2011 | FY 2010 |
|---|---|---|---|---|---|---|---|---|---|---|---|---|---|---|---|---|
| Share price | 109.5 | — | — | — | — | — | — | — | — | — | — | — | — | — | — | — |
| P/S | 6.37 | — | — | — | — | — | — | — | — | — | — | — | — | — | — | — |
Sign up to see institutional holdings
Sign UpPodcast Mentions
Sign up to see podcast mentions and sentiment
Sign UpMaterial information published on MOPS, newest first, subjects as filed in Chinese, guarantee and loan balance notices and routine equipment purchases included. The link opens the company's material information on MOPS. Press releases from the company's own website, newest first.
更正已公告115年度第三季合併資產負債表「預收股款(權益 項下)之約當發行股數」(單位:股)及「每股淨值」(元)
Bull 0
Bear 0
Routine
公告本公司國內第三次無擔保轉換公司債115年第3季轉換普通股之 增資基準日
Bull 0
Bear 0
Routine




Prompts
Click prompts to add them under the company line, click again to take one out, then copy the result into your AI chat. Shared by Asian Century Stocks and Uncovered Thai Stocks. Thank you.
E&R Engineering Corporation (ticker 8027.TWO), listed in Taiwan.
Copied