本公司與母公司聖暉工程科技(股)公司及子公司銳澤實業(股)公司,受邀參加國泰證券舉辦之聖暉集團2026年第三季聯合法人說明會
Bull 0
Bear 0
Routine
6613.TWO
|
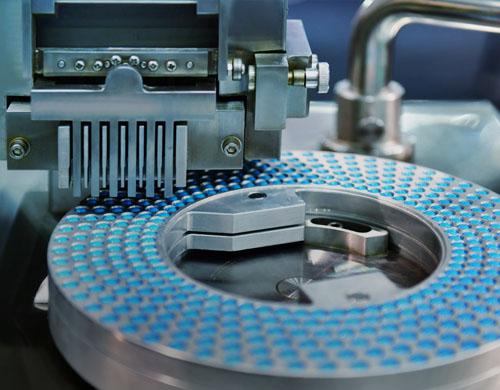
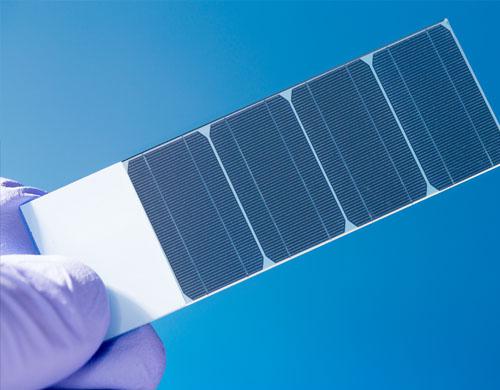
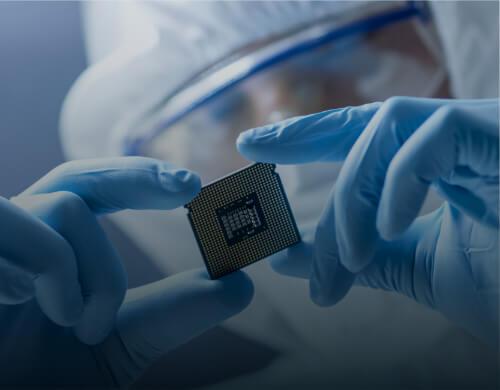
Nova Technology Corporation is a specialized engineering firm providing integrated water, gas, and chemical systems for high-tech manufacturing facilities. The company serves clients in the semiconductor, optoelectronics, solar energy, biotechnology, pharmaceutical, and chemical industries. Its services include project engineering, equipment supply, and the design, manufacture, and sale of specialized systems such as gas cylinder cabinets and cleanroom infrastructure. The company operates through subsidiaries including Novatech Engineering & Construction Pte. Ltd. in Singapore, Suzhou Guanli Technology Co., Ltd. in China, and Bao Yun Technology Co., Ltd. in Taiwan. It also maintains a strategic partnership with Sheng Hui Engineering Technology Co., Ltd. Founded in 1997, the company provides services across Taiwan, mainland China, Vietnam, Singapore, and Malaysia. Summarised from the company's own disclosures, fiscal year ended Oct 2026 |
Industry Engineering & Construction | Homepage novatech.com.tw |
| Sector Industrials | IR page novatech.com.tw/investors | |
|
Tags
semiconductor fab systems, gas supply systems, chemical supply systems, cleanroom engineering, process integration, pharmaceutical facilities, solar energy systems, optoelectronics, equipment manufacturing, industrial automation, Novatech Engineering & Construction Pte. Ltd., Suzhou Guanli Technology Co. Ltd., Bao Yun Technology Co. Ltd., Sheng Hui Engineering Technology Co. Ltd., Winmax Technology Corporation, Xuanfu Technology Co. Ltd., Lihai Technology Research Co. Ltd., Dade Design Co. Ltd.
|
Press page novatech.com.tw/news |
Metrics
| Valuation | |
|---|---|
| Market cap | NT$ 15.677B |
| Market cap (USD) | $ 475.818M |
| P/E | 11.36 |
| PEG | 1.22 |
| P/BV | 2.42 |
| P/S | 1.17 |
| P/OCF | 8.07 |
| P/FCF | — |
| Dividend yield | — |
| Turnover / mcap | — |
| Returns | |
|---|---|
| ROE | 20.2% |
| ROI | 19.5% |
| ROIC | 23.2% |
| Profit margin | 11.7% |
| Growth | |
|---|---|
| Revenue growing | No |
| Profits growing | No |
| Revenue up 3y | No |
| Revenue up 5y | No |
| Earnings growth 3y (net profit CAGR) | 9.3% |
| Quality | |
|---|---|
| Profitable | Yes |
| Margin expanding | Yes |
| Buying back stock | No |
| Diluting (TTM) | No |
| Debt/Equity | — |
| Podcast bulls (TTM) | Sign up |
| Podcast bears (TTM) | Sign up |
| Podcast sentiment (TTM) | Sign up |
| Podcast sentiment % (TTM) | Sign up |
| News sentiment (TTM) | 0 |
| Quality score | 18.8% |
| Insiders | |
|---|---|
| Buys, 1w | Sign up |
| Buys, 1m | Sign up |
| Buys, 1y | Sign up |
| Sells, 1w | Sign up |
| Sells, 1m | Sign up |
| Sells, 1y | Sign up |
Sign up to see this company's insider trades
| Figure | FY 2025 | FY 2024 | FY 2023 | FY 2022 | FY 2021 | FY 2020 | FY 2019 | FY 2018 | FY 2017 | FY 2016 | FY 2015 |
|---|---|---|---|---|---|---|---|---|---|---|---|
| Revenue | 8.915B | 10.382B | 9.14B | 8.593B | 6.26B | 3.877B | 4.406B | 4.867B | 3.343B | 2.651B | 2.624B |
| Net profit | 1.04B | 1.279B | 1.042B | 796.566M | 568.254M | 407.392M | 496.941M | 559.863M | 447.475M | 264.391M | 150.448M |
| Figure | FY 2025 | FY 2024 | FY 2023 | FY 2022 | FY 2021 | FY 2020 | FY 2019 | FY 2018 | FY 2017 | FY 2016 | FY 2015 |
|---|---|---|---|---|---|---|---|---|---|---|---|
| Share price | 201.5 | — | — | — | — | — | — | — | — | — | — |
| P/S | 1.76 | — | — | — | — | — | — | — | — | — | — |
Sign up to see institutional holdings
Sign UpPodcast Mentions
Sign up to see podcast mentions and sentiment
Sign UpMaterial information published on MOPS, newest first, subjects as filed in Chinese, guarantee and loan balance notices and routine equipment purchases included. The link opens the company's material information on MOPS. Press releases from the company's own website, newest first.
公告更正本公司115年第三季合併財務報告附註揭露事項 之大陸投資資訊內容誤植
Bull 0
Bear 0
Routine
公告本公司董事會決議通過本公司因子公司蘇州冠禮科技 股份有限公司擬於深圳證券交易所創業板上市所出具補充承諾案
Bull 0
Bear 0
Routine







Prompts
Click prompts to add them under the company line, click again to take one out, then copy the result into your AI chat. Shared by Asian Century Stocks and Uncovered Thai Stocks. Thank you.
Nova Technology Corporation (ticker 6613.TWO), listed in Taiwan.
Copied
ETFs Holding Nova Technology Corporation
Exchange-traded funds whose newest published daily portfolio holds one of the company's listings, largest weight first.
| ETF | Weight in ETF | Shares | Market value | As of |
|---|---|---|---|---|
| AVES | 0.01% | 19,000 | $ 121.272K | Nov 16, 2026 |
| AVSE | 0.01% | 4,000 | $ 25.531K | Nov 16, 2026 |
| AVEE | 0.01% | 3,000 | $ 19.148K | Nov 16, 2026 |
| AVXC | 0.01% | 4,000 | $ 25.531K | Nov 16, 2026 |
| DEXC | 0.01% | 2,000 | $ 13.528K | Nov 12, 2026 |
| DFEV | 0.00% | 14,000 | $ 94.694K | Nov 12, 2026 |
| DFEM | 0.00% | 48,000 | $ 324.664K | Nov 12, 2026 |
| DFAE | 0.00% | 41,000 | $ 277.317K | Nov 12, 2026 |
| DFAX | 0.00% | 26,000 | $ 175.86K | Nov 12, 2026 |
| AVEM | 0.00% | 33,000 | $ 210.63K | Nov 16, 2026 |