受邀參加美銀集團舉行BofA Asia Pacific Conference
Bull 0
Bear 0
Routine
6274.TWO
|
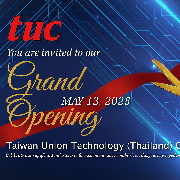
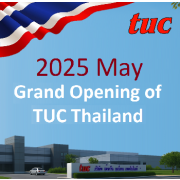
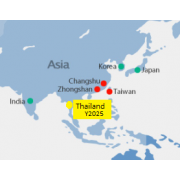
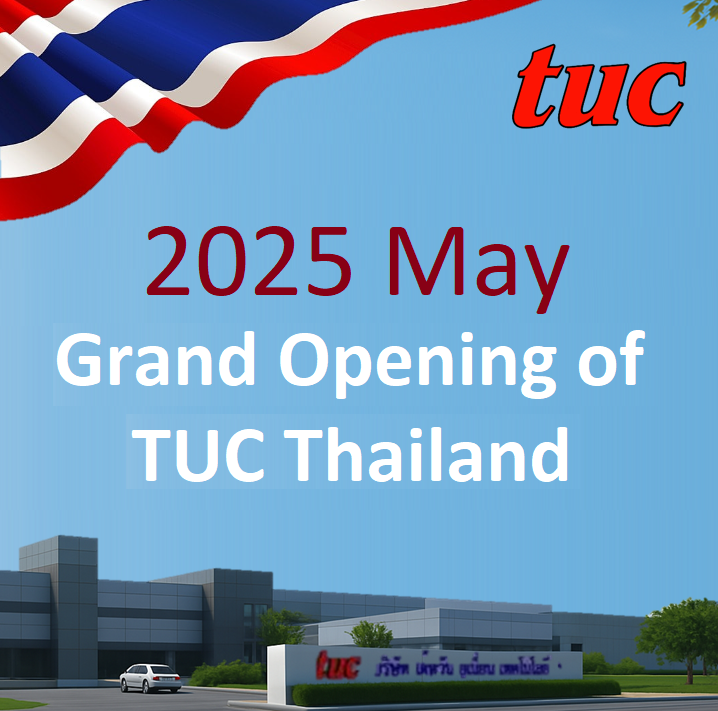
Taiwan Union Technology Corporation is an electronics materials manufacturer established in 1974, formerly known as Taiwan Union Glass Industrial Co., Ltd. The company produces Copper Clad Laminate (CCL) and Prepreg, and provides Mass Lamination services for the global electronics industry. Its product portfolio includes materials for Radio Frequency, High Speed Digital, High Density Interconnect, and Automotive applications, featuring high-speed low-loss, lead-free, and halogen-free properties. TUC serves customers in the Greater China area and maintains a global service network across Taiwan, China, Japan, South Korea, the USA, and Germany. The company operates production facilities in Changshu and Zhongshan, China, and is establishing a new production base in Chonburi, Thailand, to support decentralized supply plans for European and American OEM and PCB customers. Summarised from the company's own disclosures, fiscal year ended Oct 2026 |
Industry Specialty Chemicals | Homepage tuc.com.tw |
| Sector Basic Materials | IR page tuc.com.tw/en-us/corporate/id/133 | |
|
Tags
copper clad laminate, prepreg, mass lamination, printed circuit boards, high speed digital, radio frequency, automotive electronics, rigid-flex, CCL, High Density Interconnect, Automotive, TUC Changshu, TUC Zhongshan, TUC Chonburi
|
Press page tuc.com.tw/en-us/news |
Metrics
| Valuation | |
|---|---|
| Market cap | NT$ 207.254B |
| Market cap (USD) | $ 6.291B |
| P/E | 23.72 |
| PEG | 0.60 |
| P/BV | 7.37 |
| P/S | 4.03 |
| P/OCF | 317.30 |
| P/FCF | — |
| Dividend yield | — |
| Turnover / mcap | — |
| Returns | |
|---|---|
| ROE | 20.7% |
| ROI | 18.3% |
| ROIC | 17.6% |
| Profit margin | 11.2% |
| Growth | |
|---|---|
| Revenue growing | Yes |
| Profits growing | Yes |
| Revenue up 3y | No |
| Revenue up 5y | No |
| Earnings growth 3y (net profit CAGR) | 39.3% |
| Quality | |
|---|---|
| Profitable | Yes |
| Margin expanding | No |
| Buying back stock | No |
| Diluting (TTM) | Yes |
| Debt/Equity | — |
| Podcast bulls (TTM) | Sign up |
| Podcast bears (TTM) | Sign up |
| Podcast sentiment (TTM) | Sign up |
| Podcast sentiment % (TTM) | Sign up |
| News sentiment (TTM) | 1 |
| Quality score | 0% |
| Insiders | |
|---|---|
| Buys, 1w | Sign up |
| Buys, 1m | Sign up |
| Buys, 1y | Sign up |
| Sells, 1w | Sign up |
| Sells, 1m | Sign up |
| Sells, 1y | Sign up |
Sign up to see this company's insider trades
| Figure | FY 2025 | FY 2024 | FY 2023 | FY 2022 | FY 2021 | FY 2020 | FY 2019 | FY 2018 | FY 2017 | FY 2016 | FY 2015 | FY 2014 | FY 2013 | FY 2012 | FY 2011 | FY 2010 |
|---|---|---|---|---|---|---|---|---|---|---|---|---|---|---|---|---|
| Revenue | 30.34B | 23.07B | 16.003B | 18.472B | 21.132B | 18.047B | 17.527B | 17.787B | 16.103B | 13.423B | 12.903B | 13.408B | 11.94B | 11.811B | 10.995B | 9.975B |
| Net profit | 3.409B | 2.604B | 823.435M | 1.261B | 1.881B | 1.776B | 1.752B | 1.836B | 1.002B | 909.411M | 751.388M | 748.682M | 612.995M | 474.065M | 182.299M | 372.079M |
| Figure | FY 2025 | FY 2024 | FY 2023 | FY 2022 | FY 2021 | FY 2020 | FY 2019 | FY 2018 | FY 2017 | FY 2016 | FY 2015 | FY 2014 | FY 2013 | FY 2012 | FY 2011 | FY 2010 |
|---|---|---|---|---|---|---|---|---|---|---|---|---|---|---|---|---|
| Share price | 494 | — | — | — | — | — | — | — | — | — | — | — | — | — | — | — |
| P/S | 4.7 | — | — | — | — | — | — | — | — | — | — | — | — | — | — | — |
Sign up to see institutional holdings
Sign UpPodcast Mentions
Sign up to see podcast mentions and sentiment
Sign UpMaterial information published on MOPS, newest first, subjects as filed in Chinese, guarantee and loan balance notices and routine equipment purchases included. The link opens the company's material information on MOPS. Press releases from the company's own website, newest first.
受邀參加中民國證券櫃檯買中心及麥格里證券聯合舉行 Macquarie Taiwan Conference 2026
Bull 0
Bear 0
Routine
受邀參加里昂證券舉行 Taiwan Market Mover Access Day
Bull 0
Bear 0
Routine





































Prompts
Click prompts to add them under the company line, click again to take one out, then copy the result into your AI chat. Shared by Asian Century Stocks and Uncovered Thai Stocks. Thank you.
Taiwan Union Technology Corporation (ticker 6274.TWO), listed in Taiwan.
Copied
ETFs Holding Taiwan Union Technology Corporation
Exchange-traded funds whose newest published daily portfolio holds one of the company's listings, largest weight first.
| ETF | Weight in ETF | Shares | Market value | As of |
|---|---|---|---|---|
| ASCI | 0.83% | 19,000 | $ 652.557K | Jul 31, 2026 |
| DEXC | 0.68% | 62,000 | $ 1.798M | Nov 12, 2026 |
| AVEE | 0.24% | 12,000 | $ 316.17K | Nov 16, 2026 |
| DFEM | 0.20% | 605,000 | $ 17.543M | Nov 12, 2026 |
| DFSE | 0.13% | 26,000 | $ 753.909K | Nov 12, 2026 |
| DEHP | 0.13% | 18,000 | $ 521.937K | Nov 12, 2026 |
| DFEV | 0.11% | 85,000 | $ 2.465M | Nov 12, 2026 |
| AVES | 0.11% | 62,000 | $ 1.634M | Nov 16, 2026 |
| AVSE | 0.07% | 6,000 | $ 158.085K | Nov 16, 2026 |
| DFAE | 0.06% | 192,000 | $ 5.567M | Nov 12, 2026 |
| AVEM | 0.06% | 578,000 | $ 15.229M | Nov 16, 2026 |
| AVXC | 0.04% | 6,000 | $ 158.085K | Nov 16, 2026 |
| DFAX | 0.04% | 152,000 | $ 4.407M | Nov 12, 2026 |