公告本公司住宅新建工程承攬契約追減案
Bull 0
Bear 0
Order/contract
|
Full Wang International Development Co., Ltd. is a construction and real estate development company established in 1990. The firm specializes in the design and construction of residential buildings, luxury housing, and commercial complexes, with a focus on integrating green energy and smart home technologies into its projects. Its portfolio includes developments such as Fu Wang Qian Yun, Guo Mei Special Zone, Fu Wang Xin Hai Zhan, and the TSMC Transportation Residence. The company also operates the Fu Wang F PLAZA, a large-scale composite shopping mall located near the Taichung High-Speed Rail station. Full Wang International serves the residential and commercial markets in Taiwan, catering to homebuyers and tenants seeking modern, sustainable living spaces. The company emphasizes quality construction, after-sales service, and environmental sustainability in its business operations. Summarised from the company's own disclosures, fiscal year ended Oct 2026 |
Industry Residential Construction | Homepage fwgroup.com.tw |
| Sector Consumer Cyclical | IR page fwgroup.com.tw/investor | |
|
Tags
residential construction, real estate development, luxury housing, commercial complexes, green energy, smart homes, shopping malls, Fu Wang Qian Yun, Guo Mei Special Zone, Fu Wang Xin Hai Zhan, TSMC Transportation Residence, Fu Wang F PLAZA, Yue Rong Garden, Tian Ji W One, Wei Mei Ju, Xie Zou Qu
|
Press page fwgroup.com.tw/news |
Metrics
| Valuation | |
|---|---|
| Market cap | NT$ 1.195B |
| Market cap (USD) | $ 36.266M |
| P/E | 3.50 |
| PEG | — |
| P/BV | 0.56 |
| P/S | 0.22 |
| P/OCF | -0.65 |
| P/FCF | — |
| Dividend yield | — |
| Turnover / mcap | — |
| Returns | |
|---|---|
| ROE | -4.7% |
| ROI | -4.8% |
| ROIC | -3.1% |
| Profit margin | -3.4% |
| Growth | |
|---|---|
| Revenue growing | No |
| Profits growing | No |
| Revenue up 3y | No |
| Revenue up 5y | No |
| Earnings growth 3y (net profit CAGR) | — |
| Quality | |
|---|---|
| Profitable | No |
| Margin expanding | No |
| Buying back stock | No |
| Diluting (TTM) | No |
| Debt/Equity | — |
| Podcast bulls (TTM) | Sign up |
| Podcast bears (TTM) | Sign up |
| Podcast sentiment (TTM) | Sign up |
| Podcast sentiment % (TTM) | Sign up |
| News sentiment (TTM) | 30 |
| Quality score | -56.3% |
| Insiders | |
|---|---|
| Buys, 1w | Sign up |
| Buys, 1m | Sign up |
| Buys, 1y | Sign up |
| Sells, 1w | Sign up |
| Sells, 1m | Sign up |
| Sells, 1y | Sign up |
Sign up to see this company's insider trades
| Figure | FY 2025 | FY 2024 | FY 2023 | FY 2022 | FY 2021 | FY 2020 | FY 2019 | FY 2018 | FY 2017 | FY 2016 | FY 2015 | FY 2014 | FY 2013 | FY 2012 | FY 2011 | FY 2010 |
|---|---|---|---|---|---|---|---|---|---|---|---|---|---|---|---|---|
| Revenue | 2.77B | 4.77B | 2.6B | 578.022M | 3.186B | 3.191B | 1.623B | 2.381B | 1.719B | 1.294B | 1.217B | 2.281B | 1.898B | 2.31B | 816.352M | 3.527B |
| Net profit | -95.195M | 604.961M | 193.112M | -977.659M | 67.822M | 362.59M | 200.479M | 109.4M | 128.784M | 16.64M | 22.991M | 511.088M | 373.645M | 261.021M | -240.254M | 445.706M |
| Figure | FY 2025 | FY 2024 | FY 2023 | FY 2022 | FY 2021 | FY 2020 | FY 2019 | FY 2018 | FY 2017 | FY 2016 | FY 2015 | FY 2014 | FY 2013 | FY 2012 | FY 2011 | FY 2010 |
|---|---|---|---|---|---|---|---|---|---|---|---|---|---|---|---|---|
| Share price | 20.2 | — | — | — | — | — | — | — | — | — | — | — | — | — | — | — |
| P/S | 0.91 | — | — | — | — | — | — | — | — | — | — | — | — | — | — | — |
Sign up to see institutional holdings
Sign UpPodcast Mentions
Sign up to see podcast mentions and sentiment
Sign UpMaterial information published on MOPS, newest first, subjects as filed in Chinese, guarantee and loan balance notices and routine equipment purchases included. The link opens the company's material information on MOPS. Press releases from the company's own website, newest first.
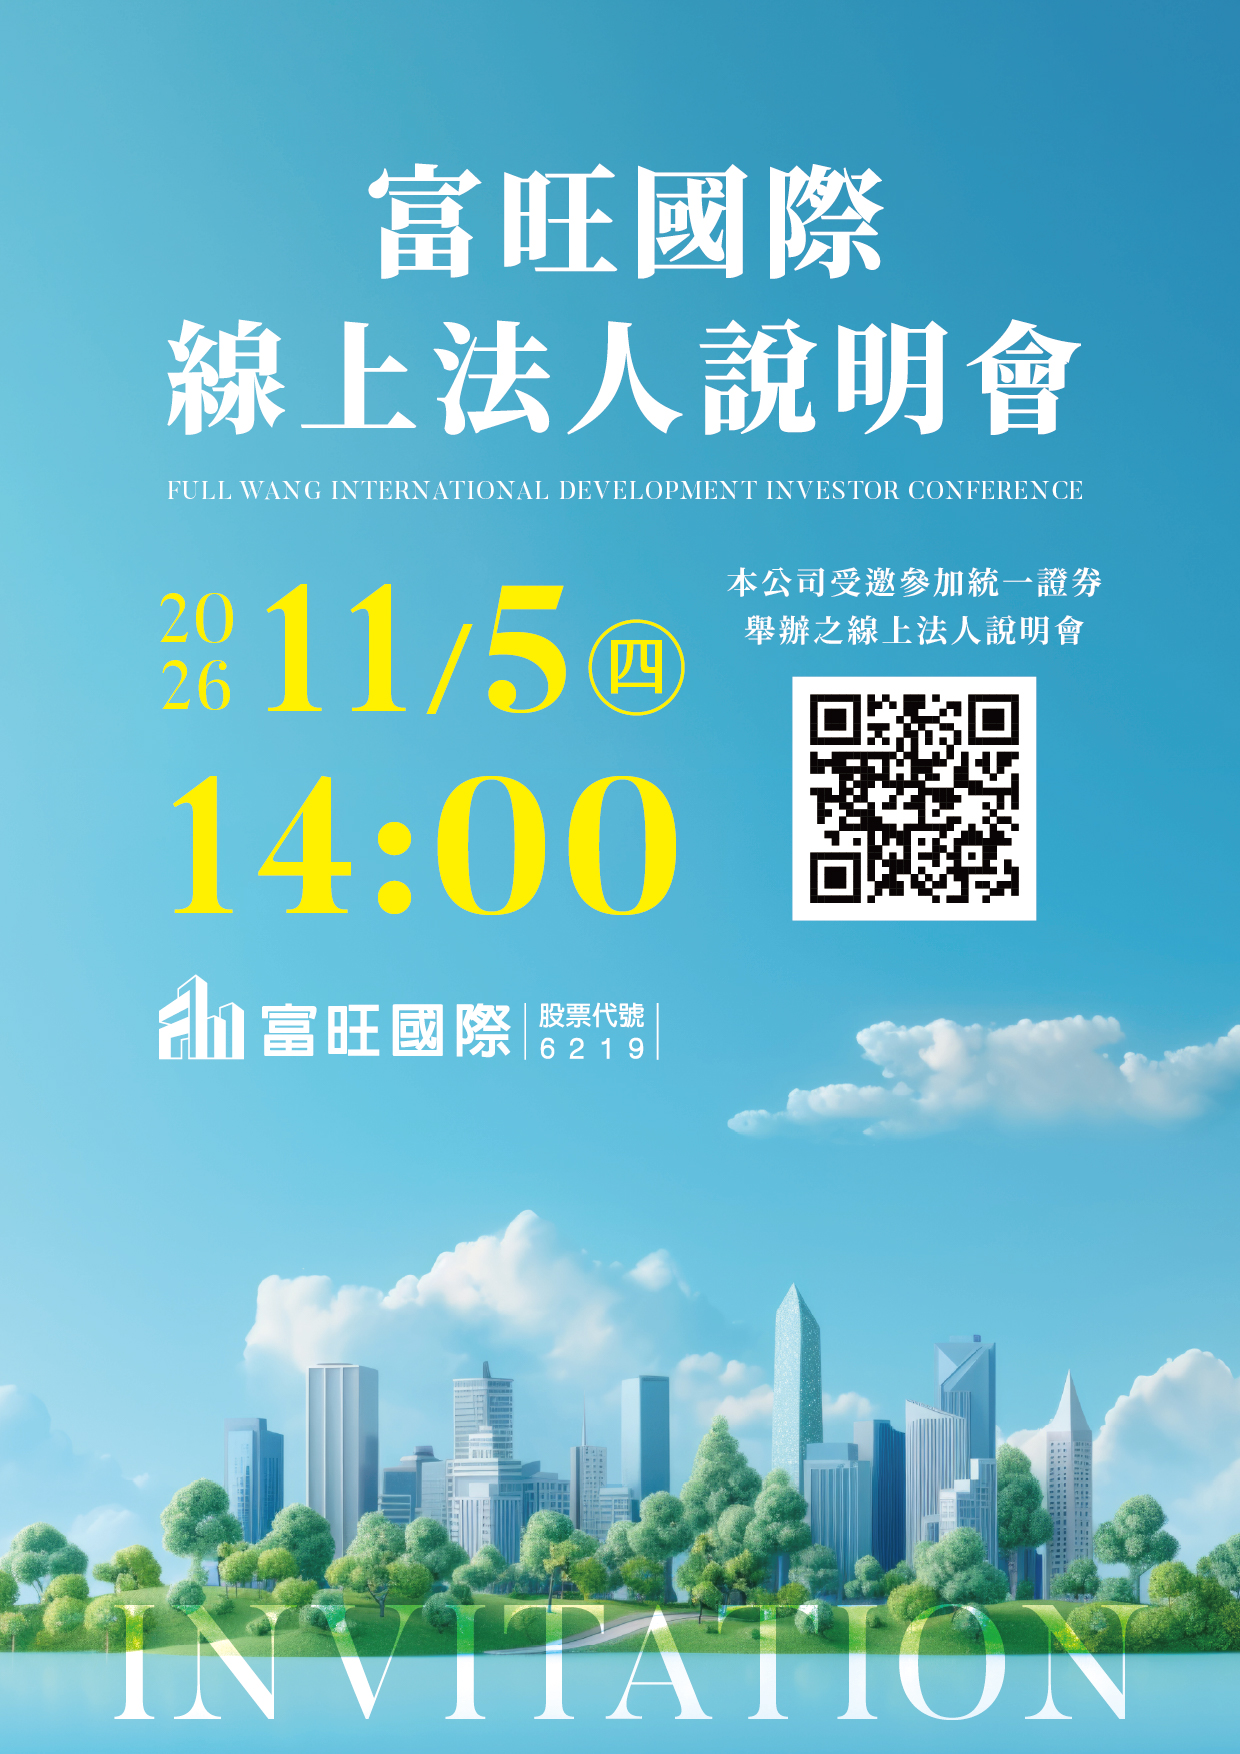


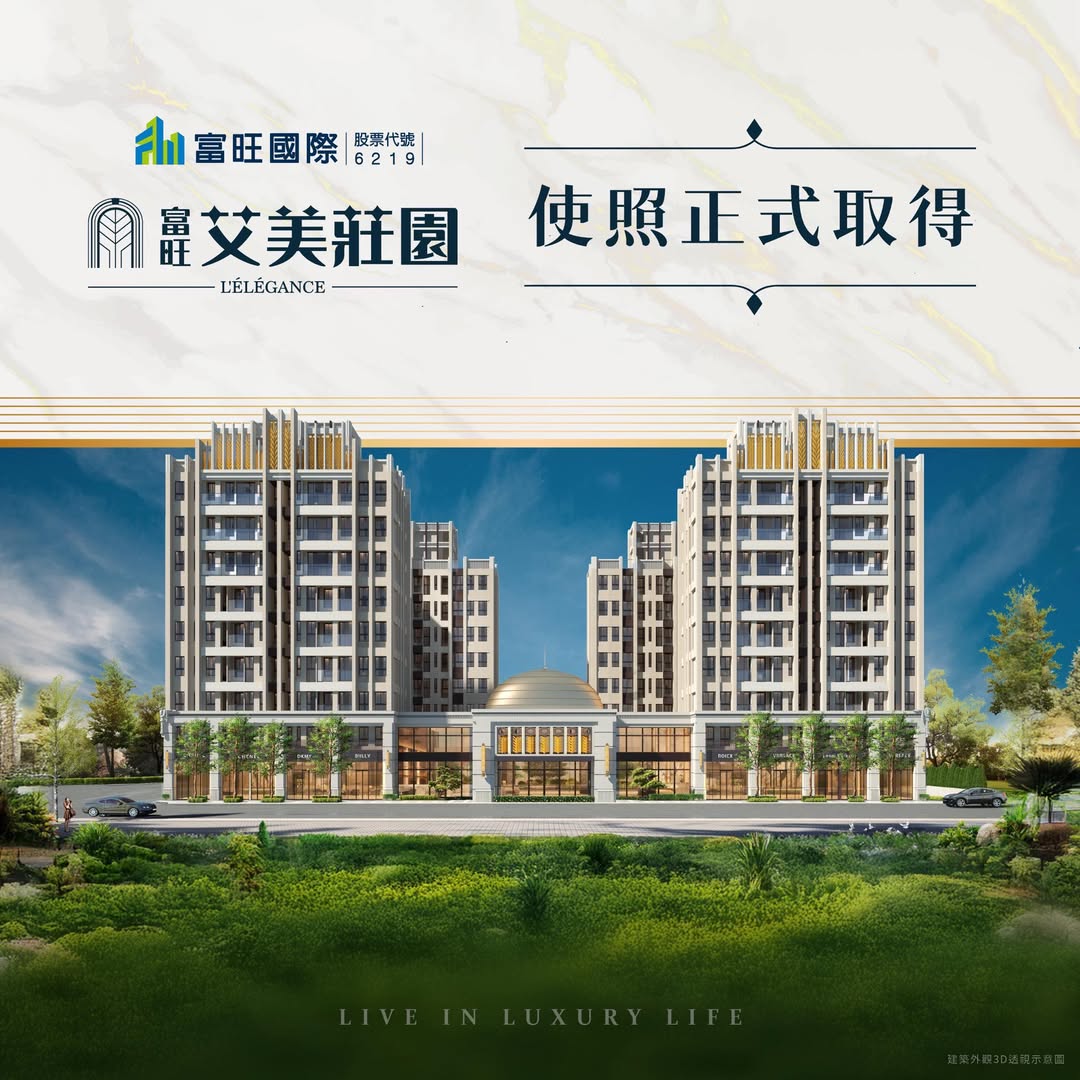
 富旺好宅進駐雲林「悅榕花園」驚艷落成 更推超青安買房零負擔
Prompts
Click prompts to add them under the company line, click again to take one out, then copy the result into your AI chat. Shared by Asian Century Stocks and Uncovered Thai Stocks. Thank you.
Full Wang International Development Co., Ltd. (ticker 6219.TWO), listed in Taiwan.
Copied
ETFs Holding Full Wang International Development Co., Ltd.
Exchange-traded funds whose newest published daily portfolio holds one of the company's listings, largest weight first.
| ETF | Weight in ETF | Shares | Market value | As of |
|---|---|---|---|---|
| AVES | 0.00% | 3,886 | $ 1,189.90 | Nov 16, 2026 |