董事會決議買回庫藏股
Bull 2
Bear 0
Capital return
|
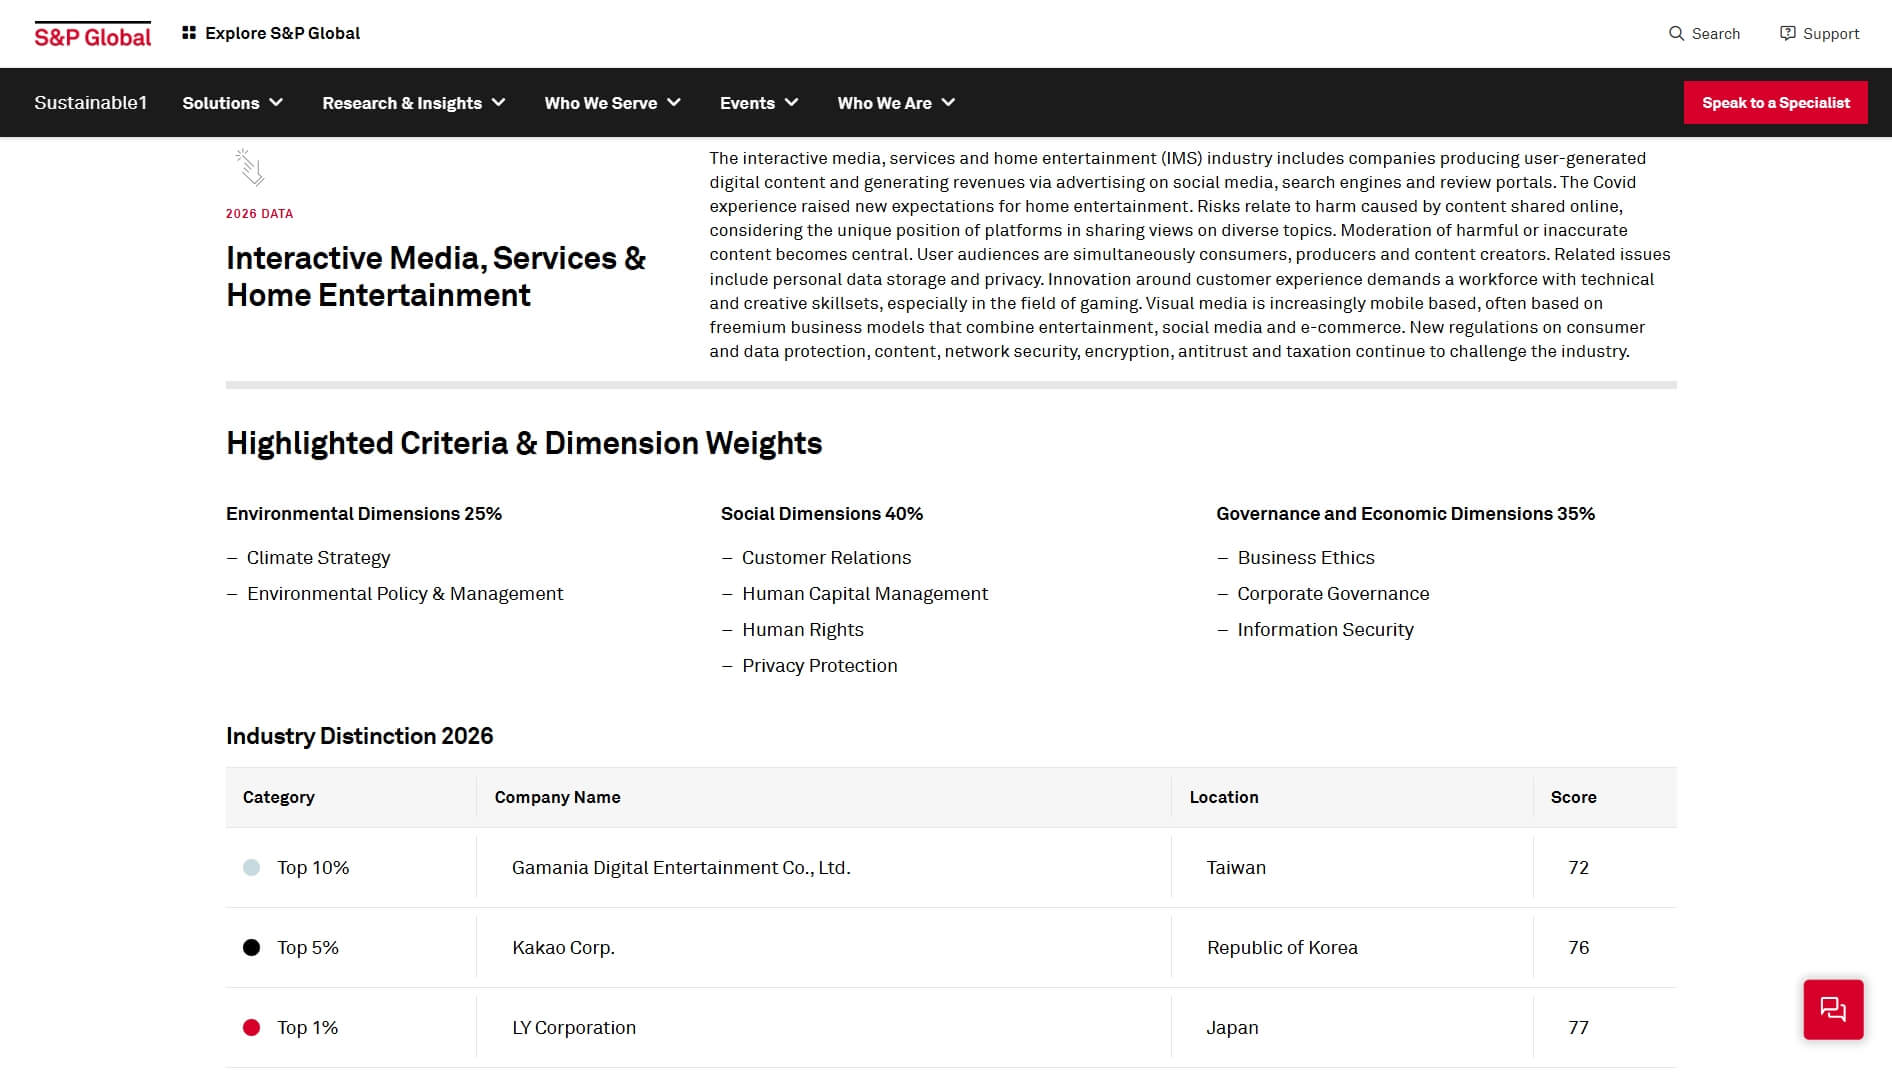
Gamania Digital Entertainment Co., Ltd. is a technology company operating across digital entertainment, news media, original content, digital lifestyle, enterprise solutions, and AI innovation. The group develops and publishes online games, including titles such as Lineage, MapleStory, and Convenience Store, and operates the GASH+ virtual currency platform. Its business segments include mobile payment, e-commerce, and media services, with subsidiaries and platforms such as MOJOIN for original IP development, Vyin AI for smart retail solutions, and gplay. The company serves markets in Asia and globally, partnering with international game publishers and leveraging local operational capabilities. Founded in 1995, the group has expanded from a game publisher to a full-spectrum tech ecosystem provider, integrating AI and big data into its core operations. Summarised from the company's own disclosures, fiscal year ended Oct 2026 |
Industry Electronic Gaming & Multimedia | Homepage gamania.com |
| Sector Communication Services | IR page gamania.com | |
|
Tags
online games, mobile payment, e-commerce, news media, original content, ai innovation, virtual currency, smart retail, digital lifestyle, enterprise solutions, Lineage, MapleStory, Convenience Store, GASH+, MOJOIN, Vyin AI, gplay, Literature Star, Comic Star, Seal Hunter
|
Press page gamania.com/news |
Metrics
| Valuation | |
|---|---|
| Market cap | NT$ 6.728B |
| Market cap (USD) | $ 204.209M |
| P/E | -47.83 |
| PEG | — |
| P/BV | 1.67 |
| P/S | 0.76 |
| P/OCF | 4.64 |
| P/FCF | — |
| Dividend yield | — |
| Turnover / mcap | — |
| Returns | |
|---|---|
| ROE | -5.4% |
| ROI | -6.3% |
| ROIC | -8.3% |
| Profit margin | -3.0% |
| Growth | |
|---|---|
| Revenue growing | No |
| Profits growing | No |
| Revenue up 3y | No |
| Revenue up 5y | No |
| Earnings growth 3y (net profit CAGR) | — |
| Quality | |
|---|---|
| Profitable | No |
| Margin expanding | No |
| Buying back stock | No |
| Diluting (TTM) | No |
| Debt/Equity | — |
| Podcast bulls (TTM) | Sign up |
| Podcast bears (TTM) | Sign up |
| Podcast sentiment (TTM) | Sign up |
| Podcast sentiment % (TTM) | Sign up |
| News sentiment (TTM) | 5 |
| Quality score | -62.5% |
| Insiders | |
|---|---|
| Buys, 1w | Sign up |
| Buys, 1m | Sign up |
| Buys, 1y | Sign up |
| Sells, 1w | Sign up |
| Sells, 1m | Sign up |
| Sells, 1y | Sign up |
Sign up to see this company's insider trades
| Figure | FY 2025 | FY 2024 | FY 2023 | FY 2022 | FY 2021 | FY 2020 | FY 2019 | FY 2018 | FY 2017 | FY 2016 | FY 2015 | FY 2014 | FY 2013 | FY 2012 | FY 2011 | FY 2010 |
|---|---|---|---|---|---|---|---|---|---|---|---|---|---|---|---|---|
| Revenue | 8.867B | 11.077B | 9.791B | 11.388B | 11.372B | 10.443B | 9.681B | 14.335B | 8.475B | 8.409B | 9.68B | 9.07B | 8.238B | 7.12B | 7.245B | 5.854B |
| Net profit | -269.341M | 2.068B | 575.188M | 1.28B | 1.106B | 872.496M | 887.895M | 1.76B | 26.68M | -382.883M | 387.888M | 93.265M | 73.921M | -356.345M | 187.01M | 231.523M |
| Figure | FY 2025 | FY 2024 | FY 2023 | FY 2022 | FY 2021 | FY 2020 | FY 2019 | FY 2018 | FY 2017 | FY 2016 | FY 2015 | FY 2014 | FY 2013 | FY 2012 | FY 2011 | FY 2010 |
|---|---|---|---|---|---|---|---|---|---|---|---|---|---|---|---|---|
| Share price | 52.3 | — | — | — | — | — | — | — | — | — | — | — | — | — | — | — |
| P/S | 1.03 | — | — | — | — | — | — | — | — | — | — | — | — | — | — | — |
Sign up to see institutional holdings
Sign UpPodcast Mentions
Sign up to see podcast mentions and sentiment
Sign UpMaterial information published on MOPS, newest first, subjects as filed in Chinese, guarantee and loan balance notices and routine equipment purchases included. The link opens the company's material information on MOPS. Press releases from the company's own website, newest first.
公告本公司董事會通過115年第三季合併財務報告
Bull 0
Bear 0
Routine
代重要子公司橘子支行動支付股份有限公司 公告訂定減資基準日及其他相關事宜
Bull 0
Bear 4
Routine













































Prompts
Click prompts to add them under the company line, click again to take one out, then copy the result into your AI chat. Shared by Asian Century Stocks and Uncovered Thai Stocks. Thank you.
Gamania Digital Entertainment Co., Ltd. (ticker 6180.TWO), listed in Taiwan.
Copied
ETFs Holding Gamania Digital Entertainment Co., Ltd.
Exchange-traded funds whose newest published daily portfolio holds one of the company's listings, largest weight first.
| ETF | Weight in ETF | Shares | Market value | As of |
|---|---|---|---|---|
| AVEE | 0.01% | 8,000 | $ 9,700.12 | Nov 16, 2026 |
| DEXC | 0.00% | 4,000 | $ 4,937.90 | Nov 12, 2026 |
| DFAE | 0.00% | 101,000 | $ 124.682K | Nov 12, 2026 |
| DFEM | 0.00% | 68,000 | $ 83.944K | Nov 12, 2026 |
| DFAX | 0.00% | 79,000 | $ 97.523K | Nov 12, 2026 |
| AVEM | 0.00% | 303,000 | $ 367.392K | Nov 16, 2026 |
| AVES | 0.00% | 8,000 | $ 9,700.12 | Nov 16, 2026 |
| AVSE | 0.00% | 3,000 | $ 3,637.54 | Nov 16, 2026 |
| AVXC | 0.00% | 1,000 | $ 1,212.52 | Nov 16, 2026 |