公告本公司董事會通過115年第三季之合併財務報告
Bull 0
Bear 0
Routine
6163.TWO
|
HwaCom Systems Inc. is a computer system integration service company founded in 1994. The business operates across four main areas: information and communications technology, digital media, smart applications, and information security. It provides products and services related to the Internet of Things, ICT, and mobile markets, positioning itself as a connected application innovation integration service provider. The company serves customers in Taiwan, with offices located in Taipei, Taoyuan, Zhongli, Hsinchu, Taichung, Tainan, Kaohsiung, Taitung, and Hualien. Summarised from the company's own disclosures, fiscal year ended Oct 2026 |
Industry Information Technology Services | Homepage hwacom.com |
| Sector Technology | IR page — | |
|
Tags
system integration, information security, digital media, smart applications, internet of things, ict solutions
|
Press page — |
Metrics
| Valuation | |
|---|---|
| Market cap | NT$ 5.114B |
| Market cap (USD) | $ 155.207M |
| P/E | 28.63 |
| PEG | — |
| P/BV | 1.73 |
| P/S | 0.69 |
| P/OCF | -5.80 |
| P/FCF | — |
| Dividend yield | — |
| Turnover / mcap | — |
| Returns | |
|---|---|
| ROE | 4.0% |
| ROI | 3.8% |
| ROIC | 3.6% |
| Profit margin | 1.7% |
| Growth | |
|---|---|
| Revenue growing | Yes |
| Profits growing | No |
| Revenue up 3y | No |
| Revenue up 5y | No |
| Earnings growth 3y (net profit CAGR) | -8.6% |
| Quality | |
|---|---|
| Profitable | Yes |
| Margin expanding | No |
| Buying back stock | No |
| Diluting (TTM) | Yes |
| Debt/Equity | — |
| Podcast bulls (TTM) | Sign up |
| Podcast bears (TTM) | Sign up |
| Podcast sentiment (TTM) | Sign up |
| Podcast sentiment % (TTM) | Sign up |
| News sentiment (TTM) | 0 |
| Quality score | -31.3% |
| Insiders | |
|---|---|
| Buys, 1w | Sign up |
| Buys, 1m | Sign up |
| Buys, 1y | Sign up |
| Sells, 1w | Sign up |
| Sells, 1m | Sign up |
| Sells, 1y | Sign up |
Sign up to see this company's insider trades
| Figure | FY 2025 | FY 2024 | FY 2023 | FY 2022 | FY 2021 | FY 2020 | FY 2019 | FY 2018 | FY 2017 | FY 2016 | FY 2015 | FY 2014 | FY 2013 | FY 2012 | FY 2011 | FY 2010 |
|---|---|---|---|---|---|---|---|---|---|---|---|---|---|---|---|---|
| Revenue | 6.106B | 5.504B | 5.253B | 6.094B | 6.193B | 4.482B | 4.528B | 4.343B | 3.915B | 3.827B | 3.12B | 3.339B | 4.462B | 4.428B | 3.303B | 3.108B |
| Net profit | 105.354M | 130.58M | 57.62M | 138.097M | 171.524M | 2.551M | 83.006M | 103.668M | 116.985M | 18.714M | -148.451M | -86.202M | 245.881M | 245.419M | 65.366M | 8.141M |
| Figure | FY 2025 | FY 2024 | FY 2023 | FY 2022 | FY 2021 | FY 2020 | FY 2019 | FY 2018 | FY 2017 | FY 2016 | FY 2015 | FY 2014 | FY 2013 | FY 2012 | FY 2011 | FY 2010 |
|---|---|---|---|---|---|---|---|---|---|---|---|---|---|---|---|---|
| Share price | 54.2 | — | — | — | — | — | — | — | — | — | — | — | — | — | — | — |
| P/S | 1.26 | — | — | — | — | — | — | — | — | — | — | — | — | — | — | — |
Sign up to see institutional holdings
Sign UpPodcast Mentions
Sign up to see podcast mentions and sentiment
Sign UpMaterial information published on MOPS, newest first, subjects as filed in Chinese, guarantee and loan balance notices and routine equipment purchases included. The link opens the company's material information on MOPS. Press releases from the company's own website, newest first.
本公司有價證券近期多次達公布注意交易資訊標準, 故公告相關訊息,以利投資人區別暸解。
Bull 0
Bear 0
Routine
公告本公司公司治理主管異動
Bull 0
Bear 0
Routine



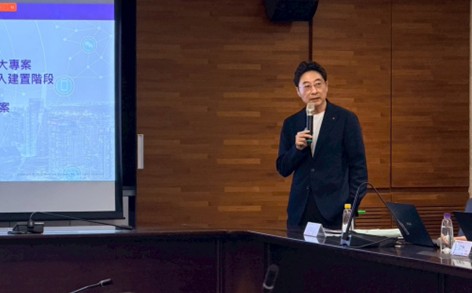
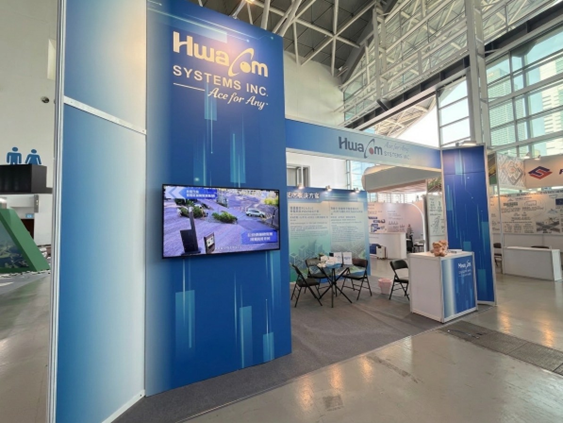
 臺灣大學土木研究大樓。圖/華電聯網提供






Prompts
Click prompts to add them under the company line, click again to take one out, then copy the result into your AI chat. Shared by Asian Century Stocks and Uncovered Thai Stocks. Thank you.
HwaCom Systems Inc. (ticker 6163.TWO), listed in Taiwan.
Copied
ETFs Holding HwaCom Systems Inc.
Exchange-traded funds whose newest published daily portfolio holds one of the company's listings, largest weight first.
| ETF | Weight in ETF | Shares | Market value | As of |
|---|---|---|---|---|
| AVEE | 0.01% | 10,000 | $ 12.391K | Nov 16, 2026 |
| DFSE | 0.00% | 14,000 | $ 16.094K | Nov 12, 2026 |
| DFEV | 0.00% | 44,000 | $ 50.58K | Nov 12, 2026 |
| DFEM | 0.00% | 174,000 | $ 200.021K | Nov 12, 2026 |
| DFAX | 0.00% | 120,000 | $ 137.946K | Nov 12, 2026 |
| DFAE | 0.00% | 34,000 | $ 39.085K | Nov 12, 2026 |
| AVEM | 0.00% | 395,000 | $ 489.44K | Nov 16, 2026 |
| AVES | 0.00% | 20,000 | $ 24.782K | Nov 16, 2026 |
| AVXC | 0.00% | 4,000 | $ 4,956.36 | Nov 16, 2026 |