Skip to content 繁體中文 English 選單 繁體中文 English 新聞與活動 新聞訊息 活動訊息 關於中美矽晶 公司簡介 大事紀 經營理念 願景與使命 企業集團 獎項與榮譽 產品與製程 產品 多晶高質量材料 類方形單晶片 高效能多晶片 太陽能電池 太陽能模組 使用實績 解決方案…
Skip to content
選單
選單

選單
Blog
- Home
>
- 活動訊息
>
- 本公司召開2026Q2英文線上法說會
本公司召開2026Q2英文線上法說會
影音連結
中美矽晶 (5483 TT)
2026年Q2營運報告
2026/08/07
© Sino-American Silicon Products Inc. All rights reserved.
Disclaimer
This presentation has been prepared by Sino-American Silicon Products Inc. (the “Company”). This
presentation and the materials provided herewith do not constitute an offer to sell or issue or the
solicitation of an offer to buy or acquire securities of the Company in any jurisdiction or an
inducement to enter into investment activity, nor may it or any part of it form the basis of or be relied
on in connection with any contract or commitment whatsoever. Any decision to purchase securities in
a proposed offering should be made solely on the basis of the information contained in the offering
circular published in relation to such proposed offering, if any.
The information contained in this presentation has not been independently verified. No
representation, warranty or undertaking, express or implied, is made as to, and no reliance should
be placed on, the fairness, accuracy, completeness or correctness of the information or the opinions
contained herein. The information contained in this document should be considered in the context of
the circumstances prevailing at the time and has not been, and will not be, updated to reflect
material developments which may occur after the date of the presentation. None of the Company nor
any of its affiliates, advisors or representatives will be liable (in negligence or otherwise) for any loss
howsoever arising from any use of this presentation or its contents or otherwise arising in connection
with the presentation.
2
© Sino-American Silicon Products Inc. All rights reserved.
01
經營團隊重點報告
3
© Sino-American Silicon Products Inc. All rights reserved.
經營團隊重點報告
- 財務表現
營業收入
•
•
營業毛利率
2026年第二季 → 新台幣211億元,季增8.96%
2026年上半年 → 新台幣405億元,年增2.26%
(新台幣百萬元)
•
•
2026年第二季 → 22.7%
2026年上半年 → 22.9%
(新台幣百萬元; %)
20251H,
25.7%
78,171
19,483
第二季營收創歷年同期新高
上半年營收創歷年同期次高
19,084
40,501
20261H,
22.9%
19,571
5,518
3,857
9,288
21,119
20,231
5,123
4,784
19,373
19,382
5,073
4,504
2025
2026
2025
2026
Q1
Q2
Q3
Q4
Q1
Q2
Q3
Q4
營業毛利率(%)
4
© Sino-American Silicon Products Inc. All rights reserved.
經營團隊重點報告
- 財務表現
營業淨利率
•
•
稅後淨利率
•
•
2026年第二季 → 10.6%
2026年上半年 → 11.2%
(新台幣百萬元; %)
2026年第二季 → 21.1%
2026年上半年 → 17.4%
(新台幣百萬元; %)
20251H,
14.5%
20261H,
11.2%
20261H,
17.4%
20251H,
8.9%
10,792
9,282
第二季稅後淨利創歷年同期次高
上半年稅後淨利創歷年同期第三高
3,235
7,063
2,521
4,453
3362
1,673
4,550
2,828
2,248
1,728
2,929
2,302
1,798
2,610
2025
2026
2025
2026
營業淨利率(%)
Q1
Q1
Q2
Q3
Q4
Q2
Q3
Q4
稅後淨利率(%)
5
© Sino-American Silicon Products Inc. All rights reserved.
經營團隊重點報告
- 財務表現
每股盈餘
•
•
2026年第二季 → 新台幣3.19元
2026年上半年 → 新台幣5.02元
(新台幣元 )
6.71
第二季每股盈餘
創歷年同期第三高
2.63
5.02
1.71
3.19
1.17
1.83
1.19
2025
2026
Q1
Q2
Q3
Q4
6
© Sino-American Silicon Products Inc. All rights reserved.
經營團隊重點報告
2. 子公司及關聯企業營運亮點
中美矽晶 (SAS, 5483:TT)
續日 (SUN)
續升綠能 (SGE, 7931:TT)
多元布局半導體、車用元件與再生能源事業
台灣製太陽能電池布局全球市場
▪ 營收創新高 — 受惠於半導體、車用元件及再生能源等
多元事業同步成長,帶動 2026 年第二季營收創下歷年
同期新高,展現跨事業綜效持續提升,即使部分市場
總體經濟環境仍具挑戰,集團整體營運表現依然穩健。
▪ 海外需求多元化 — 海外訂單維 ▪ 一站式能源服務平台— 整合「創能、
持強勁,需求遍及多個地區市場;
售能、儲能、節能」服務,協助企業
續日的台灣製造太陽能電池產品
實現 RE100 承諾與淨零轉型。
持續獲得國際客戶採用,客戶基 ▪ 規模與長約優勢 — 打造整合型能源平
礎多元且穩健。
台,串聯近 2,300 座電廠,年發電量
▪ 拓展國際布局 — 中美矽晶宣布與聯合再生能源
(URECO)成立合資公司,規劃於美國建置 1GW 太陽
能模組廠,強化美國在地供應能力,掌握 AI 帶動電力
需求成長所帶來的市場機會。
▪ 實現投資價值 — 中美矽晶旗下續升綠能於 2026 年 6 月
29 日登錄興櫃,為集團再生能源投資實現價值的重要
里程碑。
AI驅動能源轉型平台/全方位能源
解決方案提供者
▪ 特殊應用太陽能產品 — 受惠於
超過 1GW的太陽能;逾 85% 合約年
低軌道 (LEO) 衛星應用需求強勁,
期超過 10 年,累計簽署合約金額突破
以及零能耗建築(ZEB)太陽能屋
新台幣 1,000 億元。
頂市場持續發展,帶動續日特殊 ▪ 台灣離岸風電先行者 —成為台灣首家
應用太陽能產品穩定量產。
販售離岸風電的民營售電業者,強化
企業客戶再生能源供應。
▪ 永續供應鏈領導地位 — 中美矽晶透過半導體和再生能
源事業布局,持續強化產品可追溯性及低碳製造能力 ,
協助客戶達成永續發展目標並滿足供應鏈要求。
7
© Sino-American Silicon Products Inc. All rights reserved.
經營團隊重點報告
2. 子公司及關聯企業營運亮點
環球晶圓 (GWC, 6488 TT)
宏捷科 (AWSC, 8086:TT)
先進矽晶圓與化合物半導體晶圓/AI資料中心、車用及電源管理應用
射頻元件/智慧型手機、無人機及光通訊應用
▪ 營收— 2026 年上半年營收達新台幣 292 億元,年減 7.6%。
▪ 營收— 2026 年上半年營收達25.2億,年增 44.4%,
營收及每股盈餘均創歷年同期次高。
▪ 結構性成長 — 第二季營收較第一季顯著回升,反映半導體市場復甦,以及高
階應用需求持續成長,帶動營運動能改善。
▪ 復甦動能擴大 — 產業復甦由 AI 相關應用逐步擴展至更多終端市場;現有 12 吋
產線維持滿載,8 吋與 6 吋矽晶圓產線稼動率持續提升。
▪ 全球製造布局 — 全球擴產計畫持續推進,美國密蘇里州部分 SOI 產品已投入
量產,美國謝爾曼及義大利諾瓦拉廠區客戶認證持續推進,日本宇都宮擴產則
持續挹注營收、獲利及現金流。
▪ 產品組合 — 持續深化與客戶合作,高階技術獲客戶
採用並成功切入中高階智慧型手機市場,帶動產品
組合持續優化,有效降低低階手機市場疲弱帶來的
影響。
▪ 新需求 — 隨著應用擴大及效能升級需求增加,WiFi
無人機需求持續成長,GaAs WiFi PA 已成為主流需
求。此外,受 AI 資料中心及高速資料傳輸需求帶動,
▪ 深化客戶合作 — 持續深化與全球客戶的長期合作關係,近期宣布與美光
光通訊元件需求持續成長。發射光源 LD 與光偵測
(Micron)建立 10 年策略合作。憑藉環球晶圓全球製造布局,持續推動 SOI、
器 PD 為核心關鍵元件,目前,公司已與多家國際
GaN、SiC、方形晶片等高附加價值產品組合,結合全球在地製造布局,支援
客戶展開合作,相關產品已進入送樣驗證階段。
AI 、高效能運算、車用及工業等多元應用需求,進一步提升長期營運能見度。
備註:LD(Laser Diode,雷射二極體);PD(Photo Diode,光電二極體)
8
© Sino-American Silicon Products Inc. All rights reserved.
經營團隊重點報告
2. 子公司及關聯企業營運亮點
朋程 (Actron, 8255:TT)
車用功率半導體/工業與AI電源模組
台特化 (TSC, 4772:TT)
特殊氣體/半導體材料
弘潔科技 (HJT)
半導體零組件清洗、鍍膜與維修服務
▪ 營收— 2026 年上半年營收達新台幣 40.7 億元, ▪ 營收— 2026 年上半年個體營收年增 29.7 %;
▪ 營收— 2026 年上半年營收達新台幣 7.8億
元,年增 6.4%。
▪ 需求具韌性 — 全球 OEM 與 Tier 1客戶對公司
▪ 先進製程放量 — 先進製程專案完成客戶驗
證並陸續量產,帶動營收創下歷史新高。
年減 4.9%。
STD/LLD/ULLD、車用 MOSFET 及功率模組
產品維持穩定需求,並受惠於長期客戶合作
關係及產品持續升級。
▪ 客戶需求 — 燃油車(ICE)及油電混合車
(Hybrid)應用持續獲得客戶採用,帶動設計
導入持續推進,並逐步邁向量產。
▪ 長期成長動能 — SiC 功率模組、SiC IPM、高
壓半導體及AI電源電子等客戶專案,持續依照
AI資料中心、工業電力、儲能、高壓直流輸電
(HVDC)和固態變壓器(SST)等應用的開
發時程推進。
合併營收年增 262.8%,營收及每股盈餘雙雙
創下歷史新高。
▪ 訂單能見度佳 — 核心產品矽乙烷
(Disilane),受惠於穩健訂單需求,持續規
劃產能擴充,以滿足客戶需求。
▪ 客戶驗證進展順利 — 無水氫氟酸(AHF)已
進入穩定供貨階段,並持續推進多家半導體
客戶驗證,支撐產能利用率提升及未來產能
擴充。
▪ 產能持續擴充 — 產能接近滿載;持續推動
新竹廠與台南廠擴產計畫,以支應未來營
運成長需求。
▪ 2026年成長動能 — 先進製程專案量產將持
續帶動成長;先進封裝相關業務亦持續推
進客戶驗證與新產品導入。
▪ 前驅物產品布局 — 首款前驅物產品正進行客
戶驗證和制程評估。
▪ 成長動能 — 受惠於強勁客戶需求,核心業務
持續成長,子公司弘潔科技亦持續擴充產能。
備註:STD(Standard Diode,標準車用二極體);LLD(Low Leakage Diode,高效率車用二極體);ULLD(Ultra Low Leakage Diode,超高效率車用二極體);
SiC IPM(Silicon Carbide Intelligent Power Module,碳化矽智慧功率模組)。
9
© Sino-American Silicon Products Inc. All rights reserved.
經營團隊重點報告
3. 再生能源產業概況
✓ 全球電力需求預計將由 2025 年的 28,200TWh 增加至 2035 年的 33,600TWh,在 AI 資料中心、電氣化、工業生產及極
端氣候帶動下,五年成長約 20%。未來五年新增電力需求預計將較過去十年平均水準高出約 50%,帶動發電及電網基
礎建設投資。
✓ 再生能源,尤其是太陽能光電仍將是新增發電容量的主要來源。至 2030 年,再生能源發電量預估將以每年約
1,000TWh 的速度增加,其中太陽能光電貢獻超過 600TWh,並帶動儲能、電網彈性及整合能源服務相關投資。
✓ 台灣用電需求預計將由 2025 年的 283TWh 增加至 2035 年的329TWh,五年成長約 16%。配合政府推動 2035 年再生能
源裝置容量達 58GW 的政策目標,可望持續帶動綠電採購、再生能源憑證及能源管理解決方案長期需求。
- 低軌衛星產業概況
✓ 隨著資料傳輸需求持續增加、數位化發展,以及各界對通訊韌性的重視提升,低軌衛星正逐步成為下一代通訊基礎設
施的重要組成。其低延遲與廣域覆蓋特性正推動寬頻、物聯網 (IoT)、航空、海事、緊急應變及國防等應用。產業已進
入快速布建階段,2025年共發射 4,434 顆衛星,未來五年全球累計發射量預計將達 70,000 顆。
✓ 產業發展日益受到傳統寬頻以外連網需求的驅動,市場對高韌性、全天候連網的需求持續增加。2025 年衛星寬頻用
戶數年增 62%,各國政府與電信業者亦積極推動衛星與地面整合網路,以擴大通訊覆蓋、提升網路韌性,並支援新興
的裝置直連(Direct-to-Device)通訊,進一步強化低軌衛星在全球數位基礎建設中的關鍵地位。
10
© Sino-American Silicon Products Inc. All rights reserved.
經營團隊重點報告
5. 環球晶圓財務表現
營業收入
•
•
營業毛利率
2026年第二季 →新台幣152億元,季增8.79%
2026年上半年 →新台幣292億元,年減7.60%
(新台幣百萬元)
•
•
2026年第二季 → 20.6%
2026年上半年 → 20.7%
(新台幣百萬元)
2025 1H,
26.1%
60,598
2026 1H,
20.7%
14,502
14,624
14,493
29,199
3,726
2,662
16,008
15,214
6,054
4,123
3,140
15,595
13,985
4,112
2,914
2025
2026
2025
2026
Q1
Q2
Q3
Q4
Q1
Q2
Q3
Q4
營業毛利率(%)
11
© Sino-American Silicon Products Inc. All rights reserved.
經營團隊重點報告
5. 環球晶圓財務表現
營業淨利率
•
•
稅後淨利率
2026年第二季 → 9.4%
2026年上半年 → 9.9%
•
•
(新台幣百萬元)
2026年第二季 → 24.8%
2026年上半年 → 19.4%
(新台幣百萬元)
2026 1H,
19.4%
2025 1H,
15.9%
2026 1H,
9.9%
8,636
2025 1H,
9.9%
7,312
2,379
2,205
5,675
2,898
1,969
3,779
2,589
1,423
1,475
1,682
1,456
1,896
2025
2026
2025
2026
1,230
2,438
Q1
Q2
Q3
Q4
營業淨利率(%)
Q1
Q2
Q3
Q4
稅後淨利率(%)
12
© Sino-American Silicon Products Inc. All rights reserved.
經營團隊重點報告
5. 環球晶圓財務表現
每股盈餘
•
•
預收貨款
2026年第二季 →新台幣7.90元
2026年上半年 →新台幣11.87元
•
新台幣208億元(6.6億美元)1
(新台幣元)
15.29
11.87
4.60
4.12
7.90
3.52
3.05
3.97
2025
2026
Q1
備註:
匯率:新台幣兑美元 = 31.85,含保證金。
Q2
Q3
Q4
13
© Sino-American Silicon Products Inc. All rights reserved.
經營團隊重點報告
➢ 環球晶圓產業概況
◼
隨著 AI 需求擴及更多應用領域,市場展望有所改善,惟整體復甦仍呈漸進且不均衡
✓
AI 需求具結構性成長動能——全球主要雲端服務供應商持續上調 AI 相關資本支出預期,支撐中期強勁需求週期
的能見度。隨著代理式AI(Agentic AI) 與雲端至邊緣(Cloud-to-Edge)運算架構持續發展,帶動運算及記憶體
需求提升,成為半導體需求成長的重要驅動力。
✓
復甦範圍持續擴大,但進程仍漸進且不均衡——客戶庫存已逐步回歸健康水位,訂單能見度亦持續改善,復甦範
圍擴展至更多終端應用。AI 需求亦逐步由先進製程延伸至部分成熟製程,帶動工業及電力等應用改善,同時推
升新興應用領域的需求(如 AI 可穿戴設備、新世代通訊等)。
✓
全球供應鏈重組正在重塑企業的優先考量——在地緣政治不確定性持續影響全球供應鏈布局下,客戶更加重視供
應穩定性、區域化生產及營運韌性。採購決策亦已由價格導向,逐步擴展至供應穩定性、在地化及低碳製造能
力、產品可追溯性、再生能源供應能力,以及長期合作關係等多元考量。
✓
技術演進持續推升高規格晶圓需求——AI、高階封裝及先進製程持續演進,帶動晶圓使用量提升,並提高晶圓品
質及驗證要求。部分高規格產品的供需仍然偏緊,主要因市場需求強勁,且具備合格先進晶圓生產能力的供應
商數量有限。
14
© Sino-American Silicon Products Inc. All rights reserved.
經營團隊重點報告
➢ 環球晶圓產業概況
◼
AI 驅動成長持續擴展至更多應用領域,環球晶圓可望受惠
✓
營運動能增強,帶動稼動率持續提升——除AI及先進製程需求維持強勁外,成熟製程相關應用,包括工業及電
源管理等需求亦持續改善。既有12吋晶圓產線維持滿載(不含仍處於導入及量產爬坡階段之新增產能),8吋
產線維持高稼動率,復甦動能亦逐步延伸至6吋產品。
✓
全球擴產成果逐步顯現——環球晶圓近年持續推動全球擴產策略,隨著新產能陸續完工並進入客戶驗證階段,
公司現階段重點聚焦於客戶驗證、生產爬坡及營運效率優化。在產業基本面持續改善的帶動下,將有助於公司
掌握成長機會,並進一步釋放新建及擴建廠區的營運效益。
✓
全球製造布局優勢持續深化——環球晶圓多元化的全球生產據點與客戶區域化布局相互配合,持續強化在地供
應能力,並提升各主要市場的服務效率與回應速度。公司將依據客戶需求及產品驗證進度,靈活配置全球產能,
並透過長期合作夥伴關係(包括近期宣布與美光(Micron)的策略合作),進一步提升供應穩定性及營運效率。
✓
高附加價值產品布局持續推進——絕緣體上矽(SOI)、氮化鎵(GaN)、12吋碳化矽(SiC)及方形晶片
(square wafer)等高附加價值產品需求能見度良好。公司多數新建廠區均規劃生產高技術門檻晶圓產品,將
有助於掌握未來高附加價值市場的成長機會。
15
© Sino-American Silicon Products Inc. All rights reserved.
02
公司概況
16
© Sino-American Silicon Products Inc. All rights reserved.
發揮集團綜效,驅動多元成長
◼
中美矽晶為橫跨半導體、汽車元件與再生能源的多元化集團。憑藉積極的投資策略及長期累積的產業洞察力,公司持續發掘具高成
長潛力的事業,逐步建立結構更為均衡且多元的業務組合。
◼
同時,中美矽晶透過與集團核心關聯企業的綜效協作,促進營運規模的相互擴展,並驅動中美矽晶及其關聯企業的長期成長動能。
(環球晶圓,6488:TT)
No.3
半導體晶圓廠
(朋程, 8255:TT)
50%+
車用高效率二極體
市佔率
(台特化, 4772:TT)
全球唯二
全球所認可的矽丙烷
生產技術
車用元件領域
(宏捷科, 8086:TT)
半導體領域
再生能源領域
(續升1, 7931:TT)
再生能源銷售暨服務
No.2
砷化鎵晶圓廠
擁有20%+市佔率
(弘潔科技)
高階半導體設備清洗
與檢測服務供應商
(續日)
再生能源製造事業
(茂矽,2342:TT)
高效能電源元件提供者
備註:
- 續升綠能股份有限公司(簡稱續升) 之前身為旭仁能源股份有限公司
17
© Sino-American Silicon Products Inc. All rights reserved.
集團重要公司之近期表現 – (1)
◼
中美矽晶集團公司:環球晶圓、宏捷科、台特化營運穩健,持續展現成長動能。
環球晶圓
朋程
2026年第二季
營收季增8.8%
2026年第二季
營收季減0.3%
16,008
15,214
14,493
2,163
14,502
13,985
1,987
2,037
2,032
Q126
Q226
1,839
Q225
Q325
Q425
Q126
營收(新台幣百萬元)
Q226
上半年營收創歷年同期次高
宏捷科
Q325
Q425
營收(新台幣百萬元)
上半年營收創歷史新高
台特化1
2026年第二季
營收季增4.3%
2026年第二季
營收季增6.2%
974
Q225
1,117
1,253
1,222
1,298
870
857
893
Q425
Q126
Q226
640
263
Q225
Q325
Q425
Q126
營收(新台幣百萬元)
備註:1. 弘潔科技自2025年8月起併入台特化(TSC)合併營收。
Q226
Q225
Q325
營收(新台幣百萬元)
18
© Sino-American Silicon Products Inc. All rights reserved.
集團重要公司之近期表現 – (2)
◼
中美矽晶集團公司:環球晶圓、宏捷科、台特化每股盈餘取得亮眼成績。
環球晶圓
朋程
2026年第二季
每股盈餘季增99%
3.52
7.90
4.12
4.60
2026年第二季
每股盈餘季-0.3%
2,163
3.97
1,987
2,037
2,032
Q126
Q226
1,839
Q225
Q325
Q425
Q126
Q226
上半年每股盈餘創歷年同期次高
宏捷科
Q325
Q425
上半年每股盈餘創歷史新高
台特化2
2026年第二季
每股盈餘季增12.8%
2026年第二季
每股盈餘季減6%
1.11
1.33
1.51
1.42
Q325
1.21
1.50
1.33
1.50
Q425
Q126
Q226
0.79
0.50
Q225
Q225
Q425
備註:1. 弘潔科技自2025年8月起併入台特化(TSC)合併營收。
Q126
Q226
Q225
Q325
19
© Sino-American Silicon Products Inc. All rights reserved.
以雙軌策略強化再生能源價值鏈
◼
因應全球能源轉型趨勢及企業對綠電需求持續提升,中美矽晶於 2025 年完成組織重整,建立「製造+服務」雙軌發展架構。製造端
由續日聚焦高可靠度產品,布局高規格應用市場;服務端則由續升建構涵蓋創能、售能、儲能與節能之整合型服務平台,提供企業
一站式能源解決方案,協助優化能源配置並加速淨零轉型。
子公司
續升1 (7931:TT)
再生能源製造事業
再生能源銷售與服務
(中美矽晶100%持有子公司)
(中美矽晶84.9%持有子公司)
再生能源服務
維運服務
EPC
旭鑫
子公司
續日
續興
艾涅爾
儲能管理服務
節能服務
(ESCO)
續齊2
續翔3
(續升分公司,
續升100%持有)
(續升持股60%)
(續升持股100%)
(續升持股100%)
備註:1.公司更名:續升綠能股份有限公司(簡稱續升) 之前身為旭仁能源股份有限公司。
2. 續齊儲能股份有限公司(Relocate Energy Storage Co., Ltd.)。
3. 續翔節能股份有限公司(EcoSoar Energy Service Co., Ltd. )。
4. 持股狀況更新截至2026年6月30日。
(續升持股60%)
20
© Sino-American Silicon Products Inc. All rights reserved.
(製造) 續日:高價值客製化電池解決方案提供者
◼
中美矽晶位於宜蘭的全資子公司續日整合差異化技術、合規供應鏈與高價值應用三大核心優勢,並透過多元市場布局分散單一市場
風險,持續強化市場定位,驅動長期穩健成長。
建立技術護城河,鞏固市場領先地位
•
•
•
太陽能電池轉換效率達 26%,居業界領先水準
通過 VPC 高可靠度驗證標準
多次榮獲太陽能晶片金能獎
打造合規供應鏈,拓展全球市場
•
•
•
•
•
建立值得信賴、安全且可靠的供應鏈體系
完善的材料可追溯管理平台,強化供應鏈透明度
具備有利的關稅優勢
榮獲 RBA (責任商業聯盟) 銀級肯定1
客戶遍及美國、日本及台灣
拓展高階應用,提升產品價值
•
•
具備高階客製化太陽能電池與模組設計能力
產品應用涵蓋淨零建築、低軌衛星等高技術門檻市場
備註:1. 中美矽晶宜蘭廠通過RBA VAP稽核並取得銀級認可。
21
© Sino-American Silicon Products Inc. All rights reserved.
(服務) 續升 (7931:TT):整合創能、售能、儲能與節能
服務的一站式 RE100 解決方案提供商
◼
2026 年 6 月 29 日登錄興櫃市場,續升定位為一站式 RE100 解決方案提供商,受惠於全球淨零轉型、RE100 供應鏈要求,以及 AI 資
料中心帶動的能源需求成長。
◼
整合創能、售能、儲能及節能服務,打造完整的一站式能源解決方案平台。
◼
提供一站式能源轉型解決方案,協助客戶提升能源效率、強化供電韌性並達成減碳目標。
創能
1
3
開發、建置 (EPC) 及維運 (O&M)
太陽能電廠,提供穩定綠電供應
售能
透過 AI 驅動的 ZEUS 平台整合多
元綠電資源,提供綠電轉供、再
生能源憑證 (RECs) 及綠能顧問
服務
備註:1. 營運亮點-資料截至 2026 年 6 月 30 日。
儲能
提供智慧儲能解決方案,提
升供電韌性並優化能源成本
2
4
節能
運用 Aura-Sync AI 平台,提升設
備效率及優化能源管理
22
© Sino-American Silicon Products Inc. All rights reserved.
(服務) 續升 (7931:TT):掌握能源轉型結構性成長機會
憑藉差異化能力及成熟的營運實績,掌握產業長期成長趨勢所帶來的商機。
◼
企業 RE100 承諾及 AI 用電需求持續成長,帶動再生能源採購需求增加。
◼
台灣能源效率相關法規日趨嚴格,帶動節能服務 (ESCO) 及智慧能源管理服務需求持續擴大。
◼
科技企業對整合性能源解決方案需求日益增加,帶動再生能源採購以外的市場商機。
核心優勢
1
2
3
4
5
績效亮點1
整合能源平台
超過85%
整合創能、售能、儲能及節能服務
長期合約 (10年以上) 覆蓋率
一站式 RE100 解決方案
新台幣 1,000 億元
協助企業由綠電採購逐步邁向全面能源轉型
累計已簽署合約金額
AI能源管理能力
近 2,300 座
透過ZEUS與Aura-Sync AI 平台,優化電力媒合及能源效率
整合再生能源電廠
多元再生能源組合
逾 1GW 太陽能
提供風力、太陽能及水力等多元綠電來源
已整合綠電年發電量
值得信賴的長期合作夥伴
超過 80,000 張
透過與優質客戶簽訂長期購電協議 (PPA),提升經常性營收
能見度
再生能源憑證 (RECs)
備註:1. 績效亮點資料截至 2026年6月30日。
23
© Sino-American Silicon Products Inc. All rights reserved.
03
中美矽晶合併營運報告
24
© Sino-American Silicon Products Inc. All rights reserved.
中美矽晶財務摘要:
2026年第二季 vs. 2026年第一季vs. 2025年第二季
(新台幣百萬元,除每股盈餘)
2026年第二季
2026年第一季
2025年第二季
季成長
年成長
營收
21,119
19,382
20,231
9.0%
4.4%
營業毛利%
22.7%
23.2%
25.3%
-0.5p.p.
-2.6p.p.
營業淨利
2,248
2,302
2,828
-2.4%
-20.5%
營業淨利%
10.6%
11.9%
14.0%
-1.3p.p.
-3.4p.p.
本期淨利
4,453
2,610
1,728
70.6%
157.7%
本期淨利%
21.1%
13.5%
8.5%
7.6p.p.
12.6p.p.
每股盈餘1
NT$3.19
NT$1.83
NT$1.17
NT$1.36
NT$2.02
EBITDA2
8,446
5,707
5,101
48.0%
65.6%
EBITDA%
40.0%
29.4%
25.2%
10.6p.p.
14.8p.p.
EBIT3
5,445
2,919
2,139
86.5%
154.6%
股東權益報酬率 / ROE4 (按年度計算)
14.8%
8.8%
6.2%
6.0p.p.
8.6p.p.
資產報酬率 / ROA5 (按年度計算)
6.7%
4.5%
3.0%
2.2p.p.
3.7p.p.
備註:1. 每股盈餘 = 歸屬於本公司普通股權益持有人之淨利/ 普通股加權平均流通在外股數。
2. EBITDA = 均流通在外股數。
3. EBIT = 本期淨利+ 淨利息+ 所得稅。
4. ROE = 本期淨利/ 股東平均權益。
5. ROA = (( 本期淨利+ 利息費用* (1 - 有效稅率)) / 平均資產。
25
© Sino-American Silicon Products Inc. All rights reserved.
中美矽晶財務摘要:2026年上半年 vs. 2025年上半年
(新台幣百萬元,除每股盈餘)
2026年上半年
2025年上半年
年成長
營收
40,501
39,604
2.3%
營業毛利%
22.9%
25.7%
-2.8p.p.
營業淨利
4,550
5,757
-21.0%
營業淨利%
11.2%
14.5%
-3.3p.p.
本期淨利
7,063
3,526
100.3%
本期淨利%
17.4%
8.9%
8.5p.p.
每股盈餘1
NT$5.02
NT$2.37
NT$2.65
EBITDA2
14,153
10,071
40.5%
EBITDA %
34.9%
25.4%
9.5p.p.
EBIT3
8,365
4,329
93.2%
股東權益報酬率 / ROE4 (按年度計算)
11.7%
6.3%
5.4p.p.
資產報酬率 / ROA5 (按年度計算)
6.0%
3.0%
3.0p.p.
備註:1. 每股盈餘 = 歸屬於本公司普通股權益持有人之淨利/ 普通股加權平均流通在外股數。
2. EBITDA = 均流通在外股數。
3. EBIT = 本期淨利+ 淨利息+ 所得稅。
4. ROE = 本期淨利/ 股東平均權益。
5. ROA = (( 本期淨利+ 利息費用* (1 - 有效稅率)) / 平均資產。
26
© Sino-American Silicon Products Inc. All rights reserved.
中美矽晶損益表
2026年上半年
(新台幣百萬元)
2025
2026年第一季
2026年第二季
2026年上半年
營收
78,171
19,382
21,1193
40,501
38,804
-1.9%
-0.5%
9.0%
2.3%
19,571
4,504
4,7845
9,288
12,152
25.0%
23.2%3
22.7%
22.9%
31.3%
21,819
5,707
8,446
14,153
13,527
27.9%
29.4%
40.0%
34.9%
34.86%
10,792
2,302
2,2485
4,550
7,869
13.8%
11.9%
10.6%
11.2%
20.3%
11,841
3,238
5,4644
8,701
8,599
15.1%
16.7%
25.9%
21.5%
22.2%
9,282
2,6104
4,453
7,063
6,775
稅後淨利率(%)
11.9%
13.5%
21.1%
17.4%
17.5%
每股盈餘 (新台幣元 )
9.24
6.71
3.19
5.02
4.70
成長率 (%)2
營業毛利
營業毛利率(%)
EBITDA
EBITDA率 (%)
營業淨利
營業淨利率(%)
稅前淨利
稅前淨利率(%)
稅後淨利
備註: 1. 模擬數係排除子公司環球晶圓於美國、義大利及日本的重大擴產計畫,以及持有 Siltronic 股份的市值變動影響。
2. 成長率係指與去年同期相比之變動。
3. 2026 年第二季營收較前一季成長,主要受惠於核心業務穩健成長,以及集團多元事業營收貢獻持續提升。
4. 2026 年第二季稅前淨利較前一季增加,主要因子公司環球晶圓持有 Siltronic 股權認列公允價值評價利益所致。
5. 2026 年第二季毛利率及營業利益率較前一季下降,主要反映子公司環球晶圓新擴產廠區折舊費用及產能爬坡成本增加。
模擬
1
27
© Sino-American Silicon Products Inc. All rights reserved.
中美矽晶資產負債表
(新台幣百萬元)
2024
2025
2026年第一季
2026年第二季
現金及約當現金
54,137
34,746
36,670
36,737
應收帳款
12,592
13,089
13,389
存貨
13,976
13,905
不動產、廠房、設備
137,362
其他資產
資產
現金資產細項包含以下子公司
環球晶圓的項目:
(新台幣百萬元)
2026年
第二季
13,770
三個月以上定存
4,768
14,263
15,354
受限制現金
18,019
125,716
127,127
126,751
債券
6,338
53,265
81,505
69,633
77,885
271,331
268,962
261,082
270,496
短期借款1
31,277
36,390
40,739
44,893
應付帳款
6,069
6,194
5,536
6,883
長期借款2
42,917
48,402
34,432
38,495
其他負債
75,513
59,158
61,772
57,497
負債總計
155,777
150,144
142,479
147,768
權益總計
115,555
118,818
118,603
122,729
資產總計
負債
28
© Sino-American Silicon Products Inc. All rights reserved.
06
ESG亮點
29
© Sino-American Silicon Products Inc. All rights reserved.
環境面向:CDP水安全問卷評比榮獲A級
◼
中美矽晶於 2025 年 CDP 評選中,「水安全」榮獲 A 級最高領導評等,於11項構面中有9項獲A級
肯定,彰顯公司對水資源管理的高度重視與長期承諾。
◼
中美矽晶將水議題納入董事會監督與公司治理架構,秉持著「源頭減量、廢液分流、分類處理、回
收再利用」之管理原則,持續推動節水與污染防制與應變措施。各廠區亦建立完善之生物處理系統,
有效提升有機污染物去除效率與整體處理穩定性。
源頭減量
廢液分流
分類處理
改善製程用水效率,
減少廢水產生
依廢水特性分流收集處理
避免混流影響處理效能
採物化與生物處理,
降低污染物濃度及水環境風險
回收再利用
提升廢水回收效率,
落實企業永續承諾
2025年重點成果
竹南分公司
廢水污染物去除率
80%
續日分公司
廢水生物污泥量減少
90%
30
© Sino-American Silicon Products Inc. All rights reserved.
社會面向:社會參與與公益行動
◼
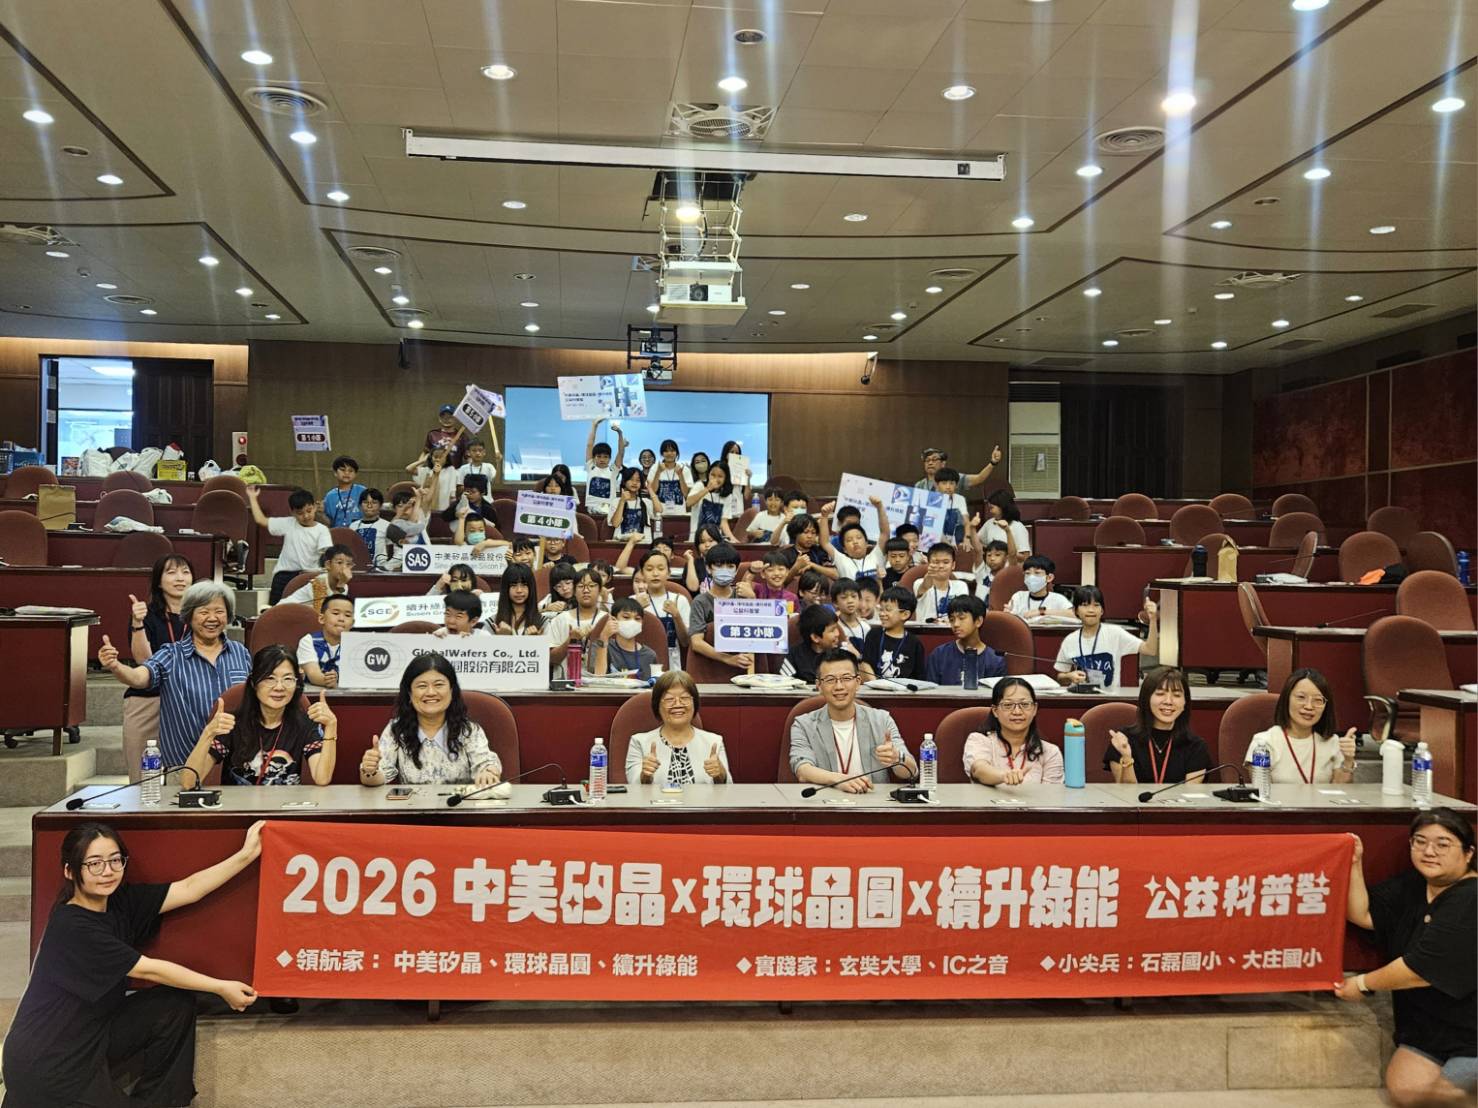
中美矽晶集團秉持「關懷社會、永續發展」理念,除了持續投入科技創新與產業發展,也善用企業專業與資源推動科學教育、再生
能源教育及人才培育。
◼
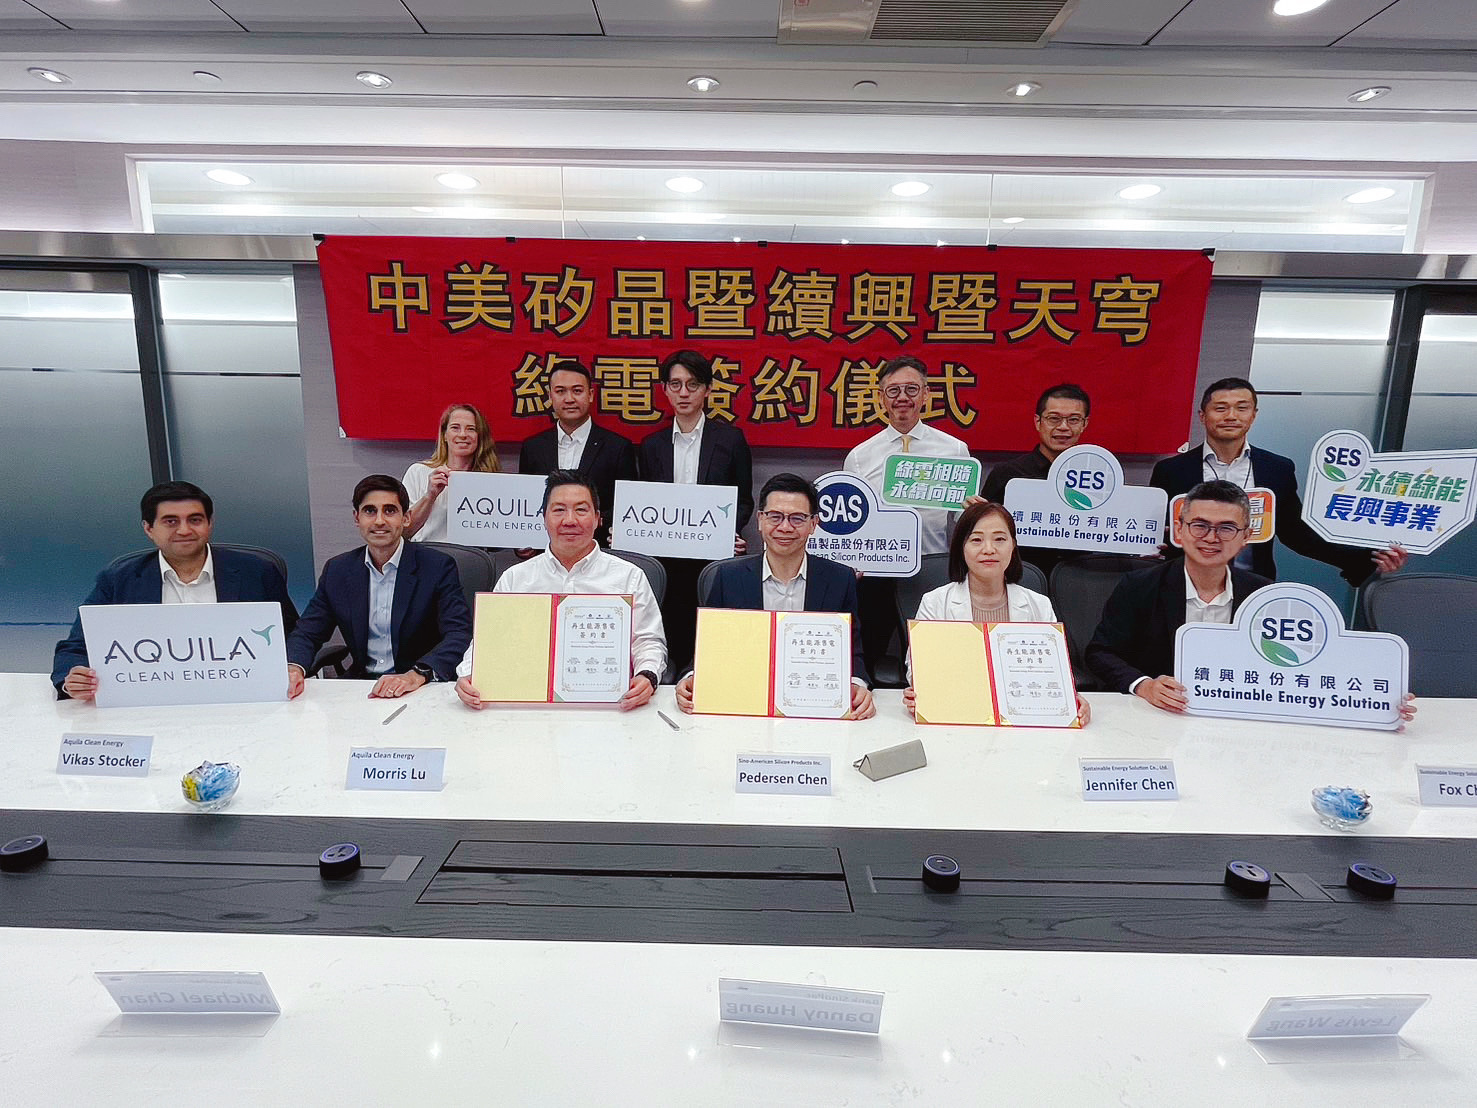
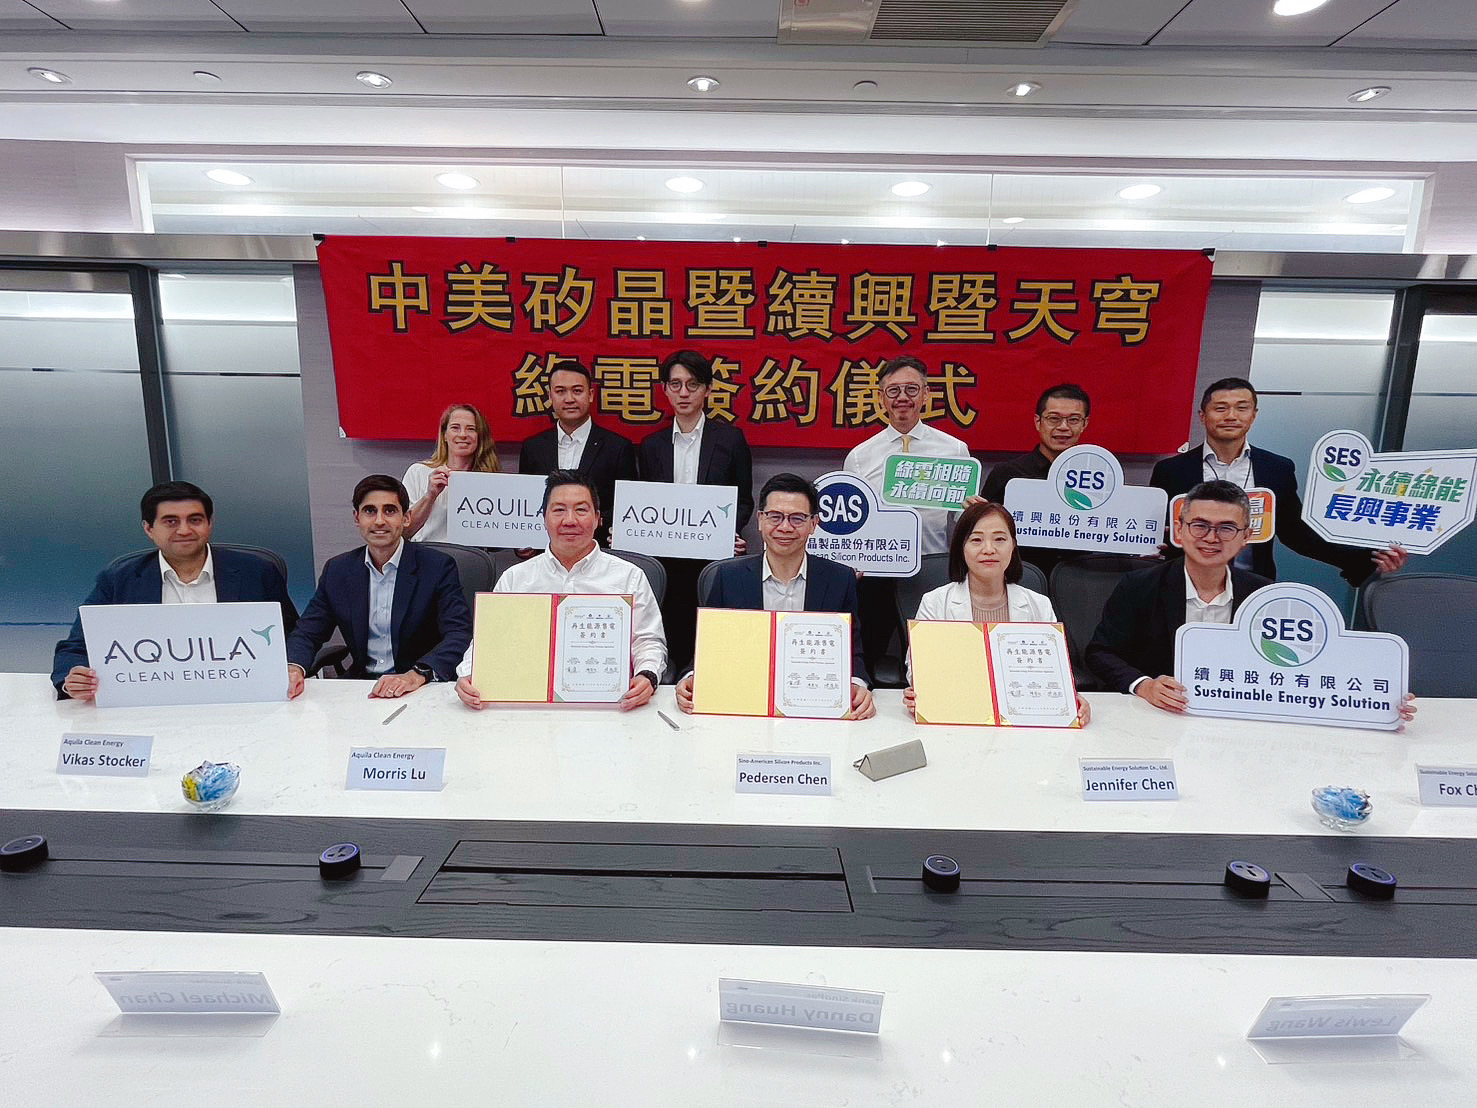
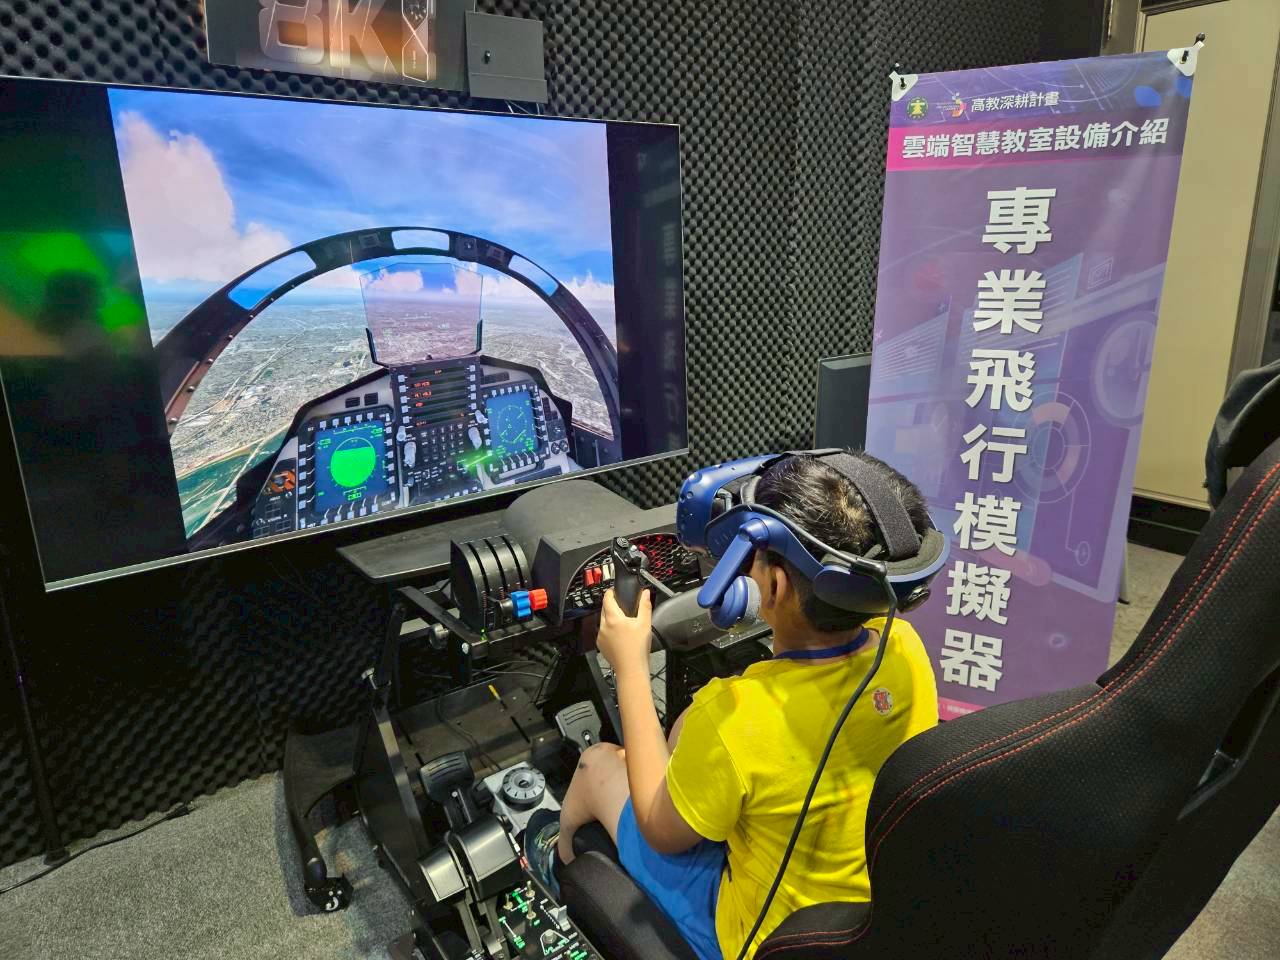
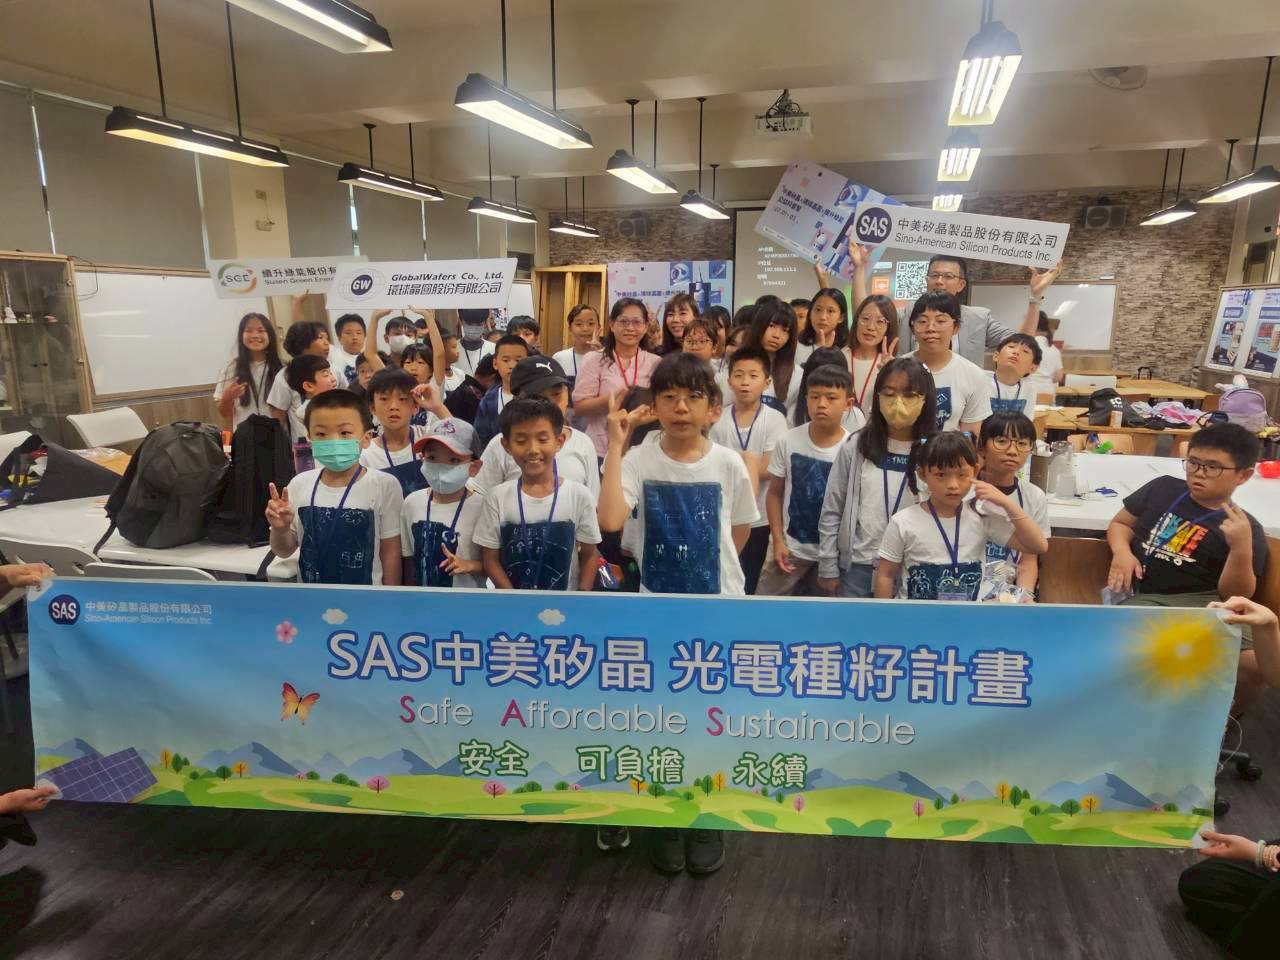
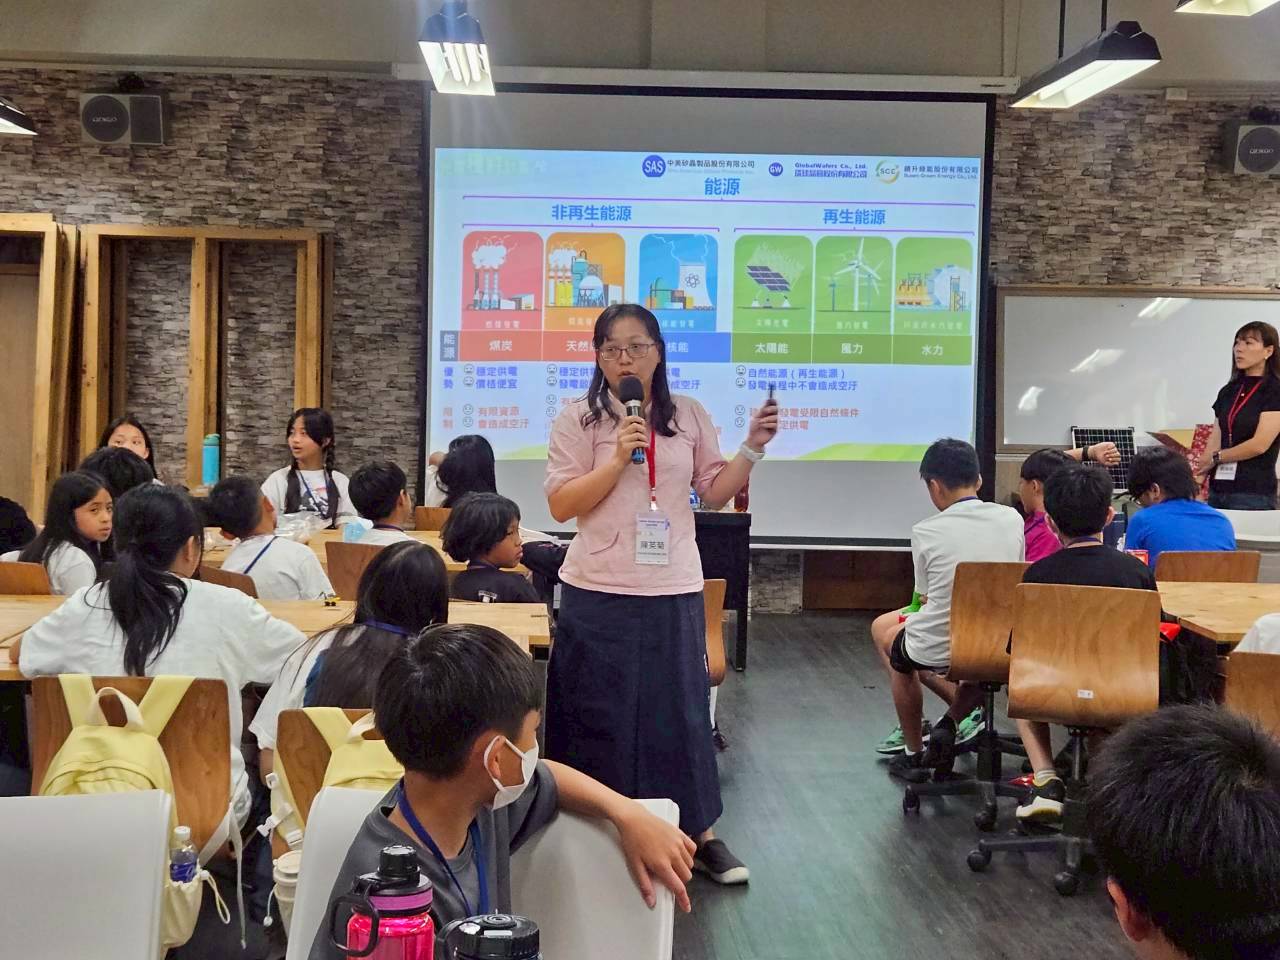
2026 年,中美矽晶與環球晶圓連續三年攜手 IC 之音及玄奘大學共同舉辦「派歐尼(Pioneer)秧苗計畫-公益科普營」,今年更邀
請再生能源服務子公司續升綠能共同參與,透過能源知識、科學實作與互動體驗,提升偏鄉學童對科學與再生能源的認識,讓永續
理念向下扎根,持續為下一代創造更多學習與探索的機會。
31
© Sino-American Silicon Products Inc. All rights reserved.
治理面向:負責任的成長
◼
中美矽晶連續十二年榮獲公司治理評鑑上櫃公司前 5%,並首次躋身市值新台幣 100 億元以上電子類企業前 10%。本屆評鑑共有
1,810 家公司參與,僅有 40 家上櫃公司名列前 5%,展現中美矽晶長期深耕公司治理、資訊透明及永續發展的卓越成果。
◼
子公司環球晶圓連續八年榮獲公司治理評鑑上櫃公司前 5%,並名列市值新台幣 100 億元以上電子類企業前 10%;關聯企業朋程及
宏捷科亦名列本屆評鑑上櫃公司前 5%;台特化首次參與評鑑即進入 6% 至 20% 級距,展現集團企業持續精進公司治理與永續發展
的成果。
全球信賴企業
Newsweek 2025 全球最受信賴企業
永續評比提升
2025 年CDP 水安全 A 級、氣候變遷 B 級
友善健康職場
連續三年榮獲「推動職場工作平權優等獎」、子公司續日榮獲「健康職場標竿獎銀獎」
智慧財產管理
2025年通過TIPS A 級驗證
董事會組成
董事會女性董事由 1 位增至 2 位
32
© Sino-American Silicon Products Inc. All rights reserved.
05
環球晶圓
33
© Sino-American Silicon Products Inc. All rights reserved.
環球晶圓損益表
2025
Q126
Q226
1H26
1H26
(模擬)1
營業收入
60,598
13,985
15,214
29,199
27,502
成長率 (%)
-3.2%
-3.6%
8.8%2
-7.6%
營業毛利
14,624
2,914
3,140
6,054
8,918
營業毛利率 (%)
24.1%
20.8%
20.6%3
20.7%4
32.4%
EBITDA
17,340
4,060
6,969
11,029
10,433
EBITDA率 (%)
28.6%
29.0%
45.8%
37.8%
37.9%
營業淨利
8,636
1,475
1,423
2,898
6,214
營業淨利率 (%)
14.3%
10.5%
9.4%
9.9%
22.6%
稅前淨利
9,516
2,347
4,5855
6,932
6,825
稅前淨利率 (%)
15.7%
16.8%
30.1%
23.7%
24.8%
稅後淨利
7,312
1,896
3,7795
5,675
5,384
稅後淨利率 (%)
12.1%
13.6%
24.8%
19.4%
19.6%
每股盈餘(NT$)
15.29
3.97
7.905
11.87
11.26
新台幣百萬元
備註: 1. 模擬數係排除美國、義大利和日本的重大擴產計畫與持有 Siltronic 股份的市值變動影響
2. 2026 年第二季營收季增率(QoQ)
3. 2026年第二季毛利率儘管營收成長,仍較前一季大致持平,主要反映折舊增加、獎酬提列,以及運費與能源費用上升影響。
4. 2026年上半年營業毛利率較去年同期下降,主要反映折舊費用增加及其他擴產相關成本
5. 2026年第二季稅前淨利、稅後淨利及每股盈餘較前一季增加,主要受 Siltronic 持股按市價評價利益挹注
34
© Sino-American Silicon Products Inc. All rights reserved.
環球晶圓資產負債表
新台幣百萬元
2024
2025
Q126
現金資產細項包含:
Q226
資產
(新台幣百萬元)
Q226
現金及約當現金
38,929
19,484
24,128
23,776
三個月以上定存
4,768
應收帳款
10,265
10,113
10,138
10,548
受限制現金
18,019
債券
6,338
存貨
11,238
10,399
11,000
12,0153
不動產、廠房及設備
119,074
107,241
108,861
107,864
其他資產
45,074
71,105
56,910
65,017
資產總計
224,581
218,343
211,037
219,220
短期借款1
28,797
31,010
33,887
38,2824
應付帳款
5,371
4,161
3,867
4,697
長期借款2
37,678
43,244
29,221
33,1884
其他負債
61,706
46,632
50,683
46,333
負債總計
133,553
125,048
117,657
122,500
權益總計
91,028
93,295
93,379
96,720
負債
備註: 1. 短期借款包括短期借款、應付短期票券,以及一年內或一營業週期內到期的長期借款、應付公司債與應付可轉換公司債
2. 長期借款包括長期借款、應付公司債及應付海外附認股權公司債
3. 2026年第二季存貨較前季增加,主要因應預期下半年需求而提前備貨
4. 2026年第二季短期及長期借款較前季增加,主要反映全球資金管理,以及營運與擴產的資金需求
35
© Sino-American Silicon Products Inc. All rights reserved.
06
Q&A
36
© Sino-American Silicon Products Inc. All rights reserved.
謝謝!
Learn More on
Our Website
© Sino-American Silicon Products Inc. All rights reserved.
簡報下載
上一頁上一篇本公司受邀參加「參加高盛證券舉辦之Goldman Sachs Taiwan Computex & Corporate Day 2026」
新聞與活動
關於中美矽晶
產品與製程
客戶服務
投資人專區
企業社會責任
人才招募
中美矽晶製品股份有限公司
© 2026 Sino-American Silicon Products Inc. All rights reserved.