本公司受邀參加Morgan Stanley舉辦之「Twenty-Fifth Annual Asia Pacific Summit」
Bull 0
Bear 0
Routine
5274.TWO
|
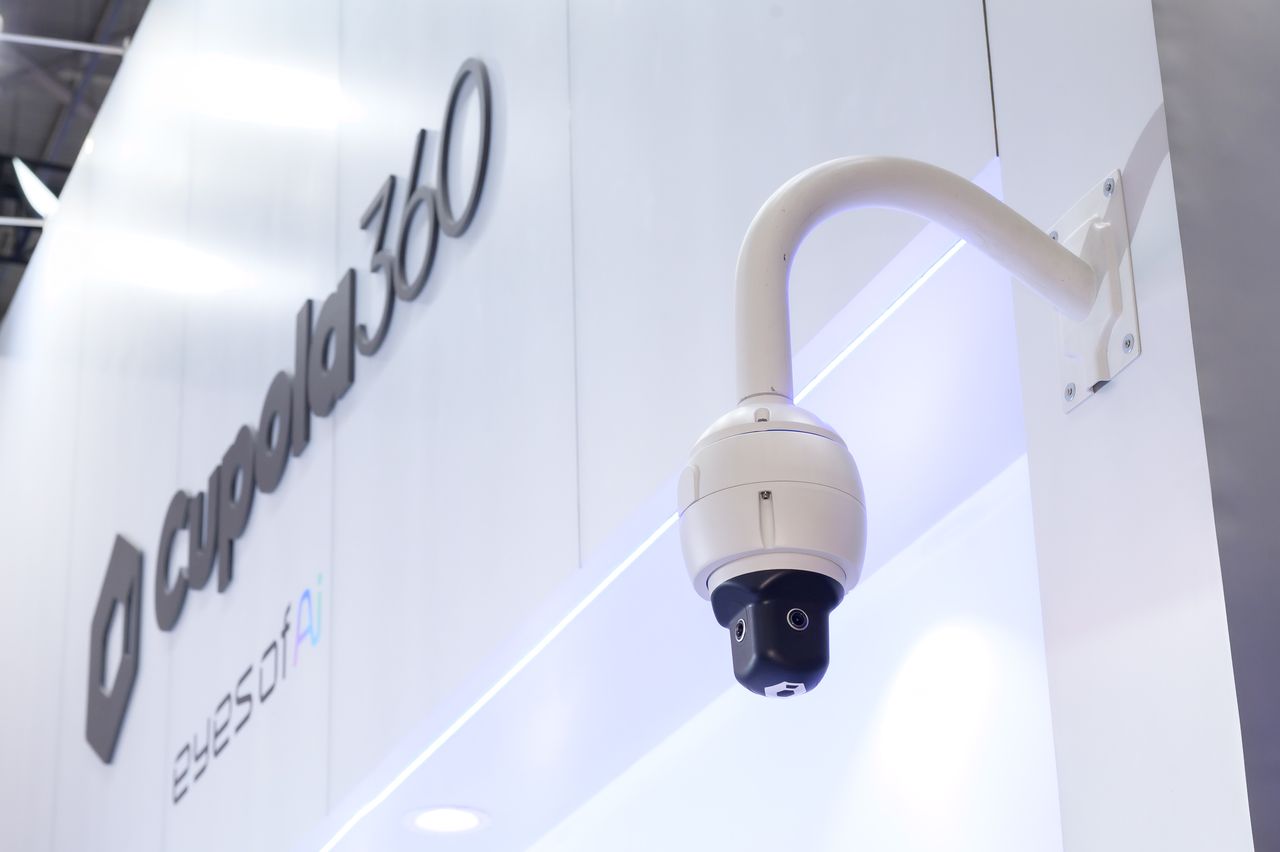
ASPEED Technology Inc. is a fabless integrated circuit design company founded in 2004. The company specializes in System-on-Chip (SoC) solutions for cloud and enterprise infrastructure, offering Baseboard Management Controller (BMC) SoCs, Bridge ICs, I/O Expanders, and Platform Firmware Resilience (PFR) security ICs. Its product portfolio also includes Smart AV solutions, specifically the Cupola360 spherical image stitching processor and associated software kits. In 2016, ASPEED acquired Broadcom’s Emulex Pilot server management business to expand its server management capabilities. In January 2026, the company completed a strategic spin-off, transferring the manufacturing and operations of its Cupola360 panoramic image processing and AVoIP video extension business to its wholly-owned subsidiary, Cupola360 Inc. ASPEED serves niche markets with a focus on remote server management and imaging technologies. Summarised from the company's own disclosures, fiscal year ended Oct 2026 |
Industry Semiconductors | Homepage aspeedtech.com |
| Sector Technology | IR page aspeedtech.com/investor_faq | |
|
Tags
fabless ic design, system-on-chip, baseboard management controller, bridge ic, io expander, security ic, image processing, server management, av over ip, panoramic imaging, BMC SoC, I/O Expander, PFR SoC, Cupola360, Cupola360+, Emulex Pilot, Cupola360 Inc.
|
Press page — |
Metrics
| Valuation | |
|---|---|
| Market cap | NT$ 363.016B |
| Market cap (USD) | $ 11.018B |
| P/E | 55.22 |
| PEG | 2.39 |
| P/BV | 36.69 |
| P/S | 25.48 |
| P/OCF | 115.44 |
| P/FCF | — |
| Dividend yield | — |
| Turnover / mcap | — |
| Returns | |
|---|---|
| ROE | 59.5% |
| ROI | 51.9% |
| ROIC | 49.8% |
| Profit margin | 43.2% |
| Growth | |
|---|---|
| Revenue growing | Yes |
| Profits growing | Yes |
| Revenue up 3y | No |
| Revenue up 5y | No |
| Earnings growth 3y (net profit CAGR) | 23.1% |
| Quality | |
|---|---|
| Profitable | Yes |
| Margin expanding | Yes |
| Buying back stock | No |
| Diluting (TTM) | Yes |
| Debt/Equity | — |
| Podcast bulls (TTM) | Sign up |
| Podcast bears (TTM) | Sign up |
| Podcast sentiment (TTM) | Sign up |
| Podcast sentiment % (TTM) | Sign up |
| News sentiment (TTM) | 0 |
| Quality score | 12.5% |
| Insiders | |
|---|---|
| Buys, 1w | Sign up |
| Buys, 1m | Sign up |
| Buys, 1y | Sign up |
| Sells, 1w | Sign up |
| Sells, 1m | Sign up |
| Sells, 1y | Sign up |
Sign up to see this company's insider trades
| Figure | FY 2025 | FY 2024 | FY 2023 | FY 2022 | FY 2021 | FY 2020 | FY 2019 | FY 2018 | FY 2017 | FY 2016 | FY 2015 | FY 2014 | FY 2013 |
|---|---|---|---|---|---|---|---|---|---|---|---|---|---|
| Revenue | 9.085B | 6.46B | 3.13B | 5.21B | 3.638B | 3.064B | 2.484B | 2.154B | 1.894B | 1.346B | 992.56M | 855.912M | 590.802M |
| Net profit | 3.928B | 2.571B | 1.007B | 2.106B | 1.313B | 1.005B | 831.185M | 685.922M | 531.366M | 445.919M | 339.908M | 280.701M | 171M |
| Figure | FY 2025 | FY 2024 | FY 2023 | FY 2022 | FY 2021 | FY 2020 | FY 2019 | FY 2018 | FY 2017 | FY 2016 | FY 2015 | FY 2014 | FY 2013 |
|---|---|---|---|---|---|---|---|---|---|---|---|---|---|
| Share price | 7.26K | — | — | — | — | — | — | — | — | — | — | — | — |
| P/S | 30.21 | — | — | — | — | — | — | — | — | — | — | — | — |
Sign up to see institutional holdings
Sign UpPodcast Mentions
Sign up to see podcast mentions and sentiment
Sign UpMaterial information published on MOPS, newest first, subjects as filed in Chinese, guarantee and loan balance notices and routine equipment purchases included. The link opens the company's material information on MOPS. Press releases from the company's own website, newest first.
本公司受邀參加J.P. Morgan舉辦之「APAC Technology, Innovation and Growth Conference」
Bull 0
Bear 0
Routine
本公司民國115年第3季合併財務報告業經董事會決議通過
Bull 0
Bear 0
Routine


Prompts
Click prompts to add them under the company line, click again to take one out, then copy the result into your AI chat. Shared by Asian Century Stocks and Uncovered Thai Stocks. Thank you.
ASPEED Technology Inc. (ticker 5274.TWO), listed in Taiwan.
Copied
ETFs Holding ASPEED Technology Inc.
Exchange-traded funds whose newest published daily portfolio holds one of the company's listings, largest weight first.
| ETF | Weight in ETF | Shares | Market value | As of |
|---|---|---|---|---|
| MEMS | 2.29% | 1,000 | $ 517.791K | Jun 30, 2026 |
| EMM | 0.96% | 1,100 | $ 557.074K | Aug 31, 2026 |
| EMC | 0.96% | 1,100 | $ 557.074K | Aug 31, 2026 |
| REMG | 0.49% | 1,000 | $ 517.791K | Jun 30, 2026 |
| FEMR | 0.47% | 1,446 | $ 749.867K | Jun 30, 2026 |
| FWD | 0.47% | 29,500 | $ 14.94M | Aug 31, 2026 |
| DEHP | 0.39% | 4,400 | $ 1.595M | Nov 12, 2026 |
| DFSE | 0.34% | 5,400 | $ 1.958M | Nov 12, 2026 |
| SEEM | 0.33% | 3,803 | $ 1.969M | Jun 30, 2026 |
| MINV | 0.28% | 1,000 | $ 517.791K | Jun 30, 2026 |
| DEXC | 0.15% | 1,100 | $ 398.869K | Nov 12, 2026 |
| DFAE | 0.09% | 23,000 | $ 8.34M | Nov 12, 2026 |
| AVXC | 0.09% | 1,100 | $ 357.543K | Nov 16, 2026 |
| DFEM | 0.07% | 17,600 | $ 6.382M | Nov 12, 2026 |
| JSTC | 0.05% | 413 | $ 135.402K | Nov 17, 2026 |
| DFAX | 0.04% | 12,760 | $ 4.627M | Nov 12, 2026 |
| AVEM | 0.01% | 9,240 | $ 3.003M | Nov 16, 2026 |