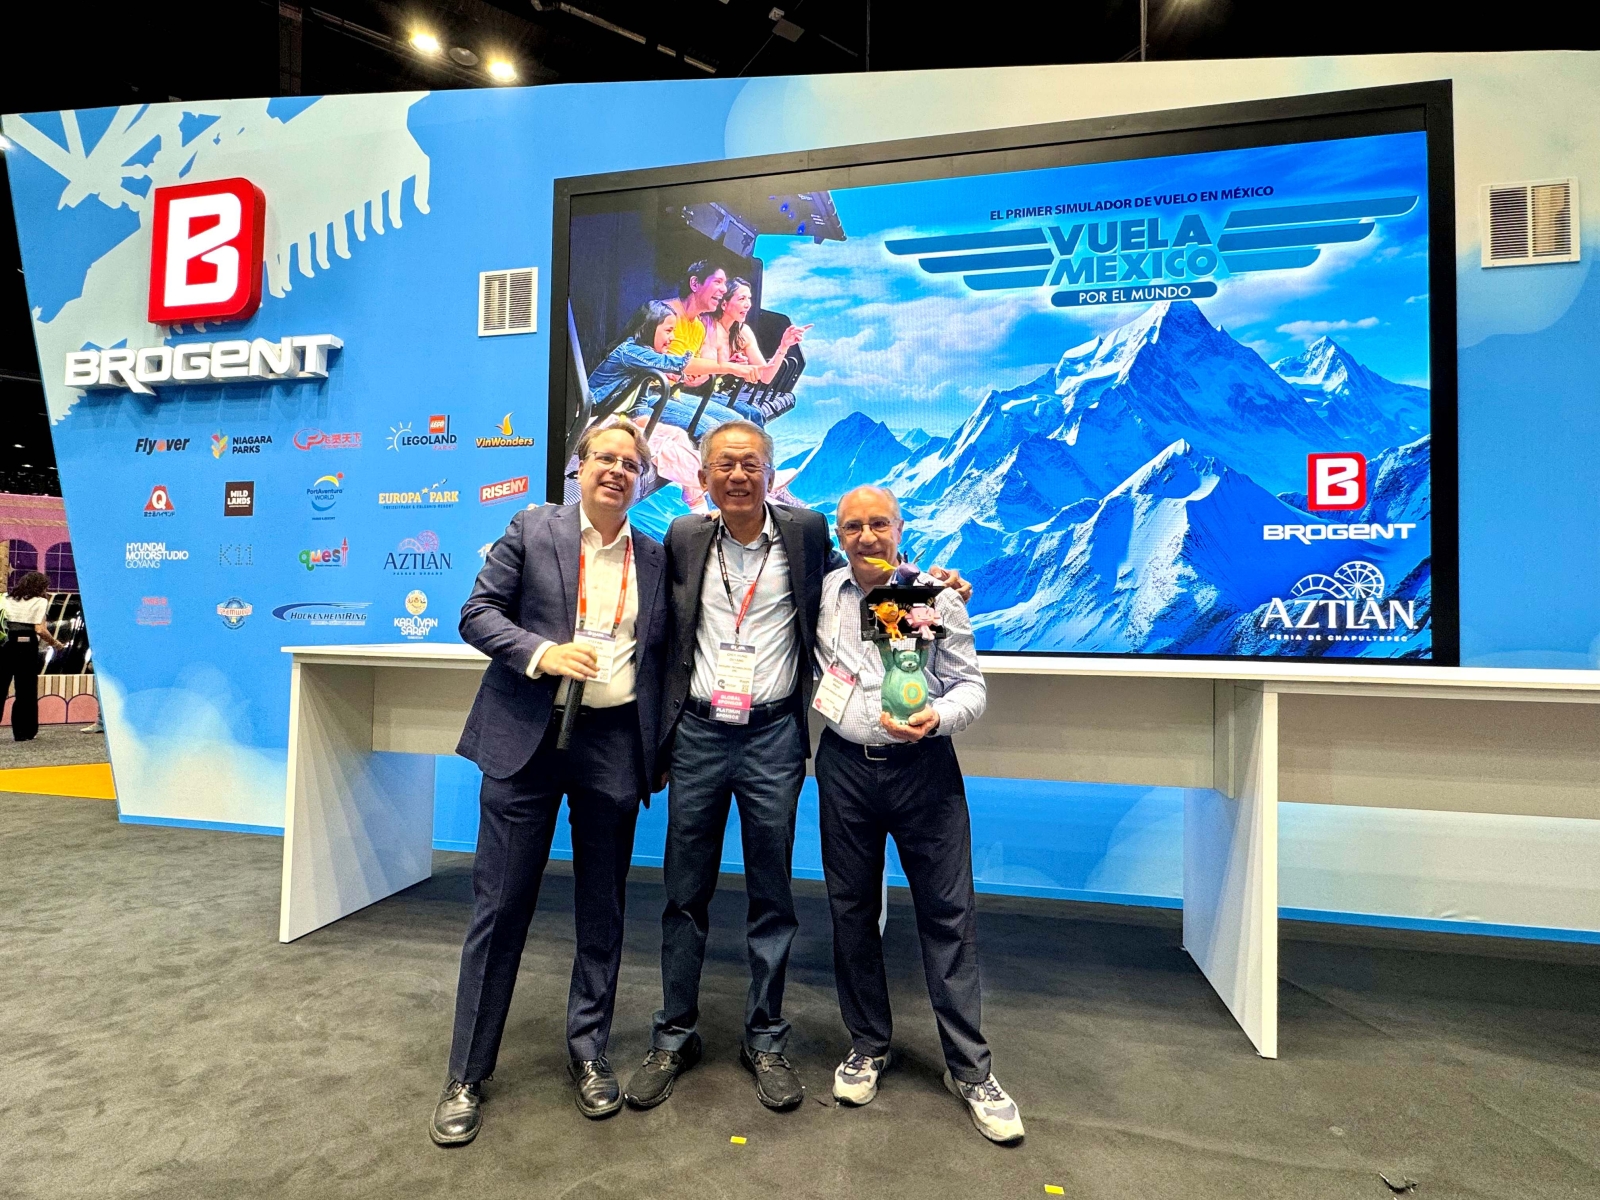
本公司受邀參加黑石財經主辦「戰略台灣投資論壇」之法人說明會
Bull 0
Bear 0
Routine
5263.TWO
|
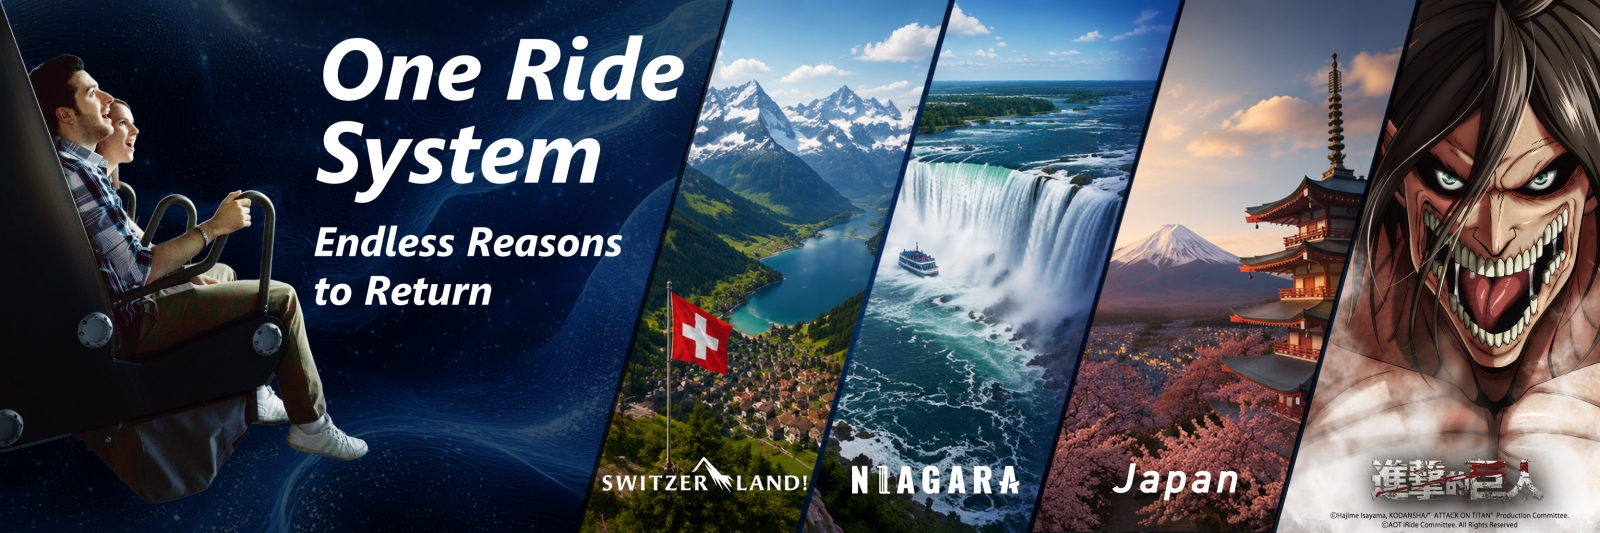
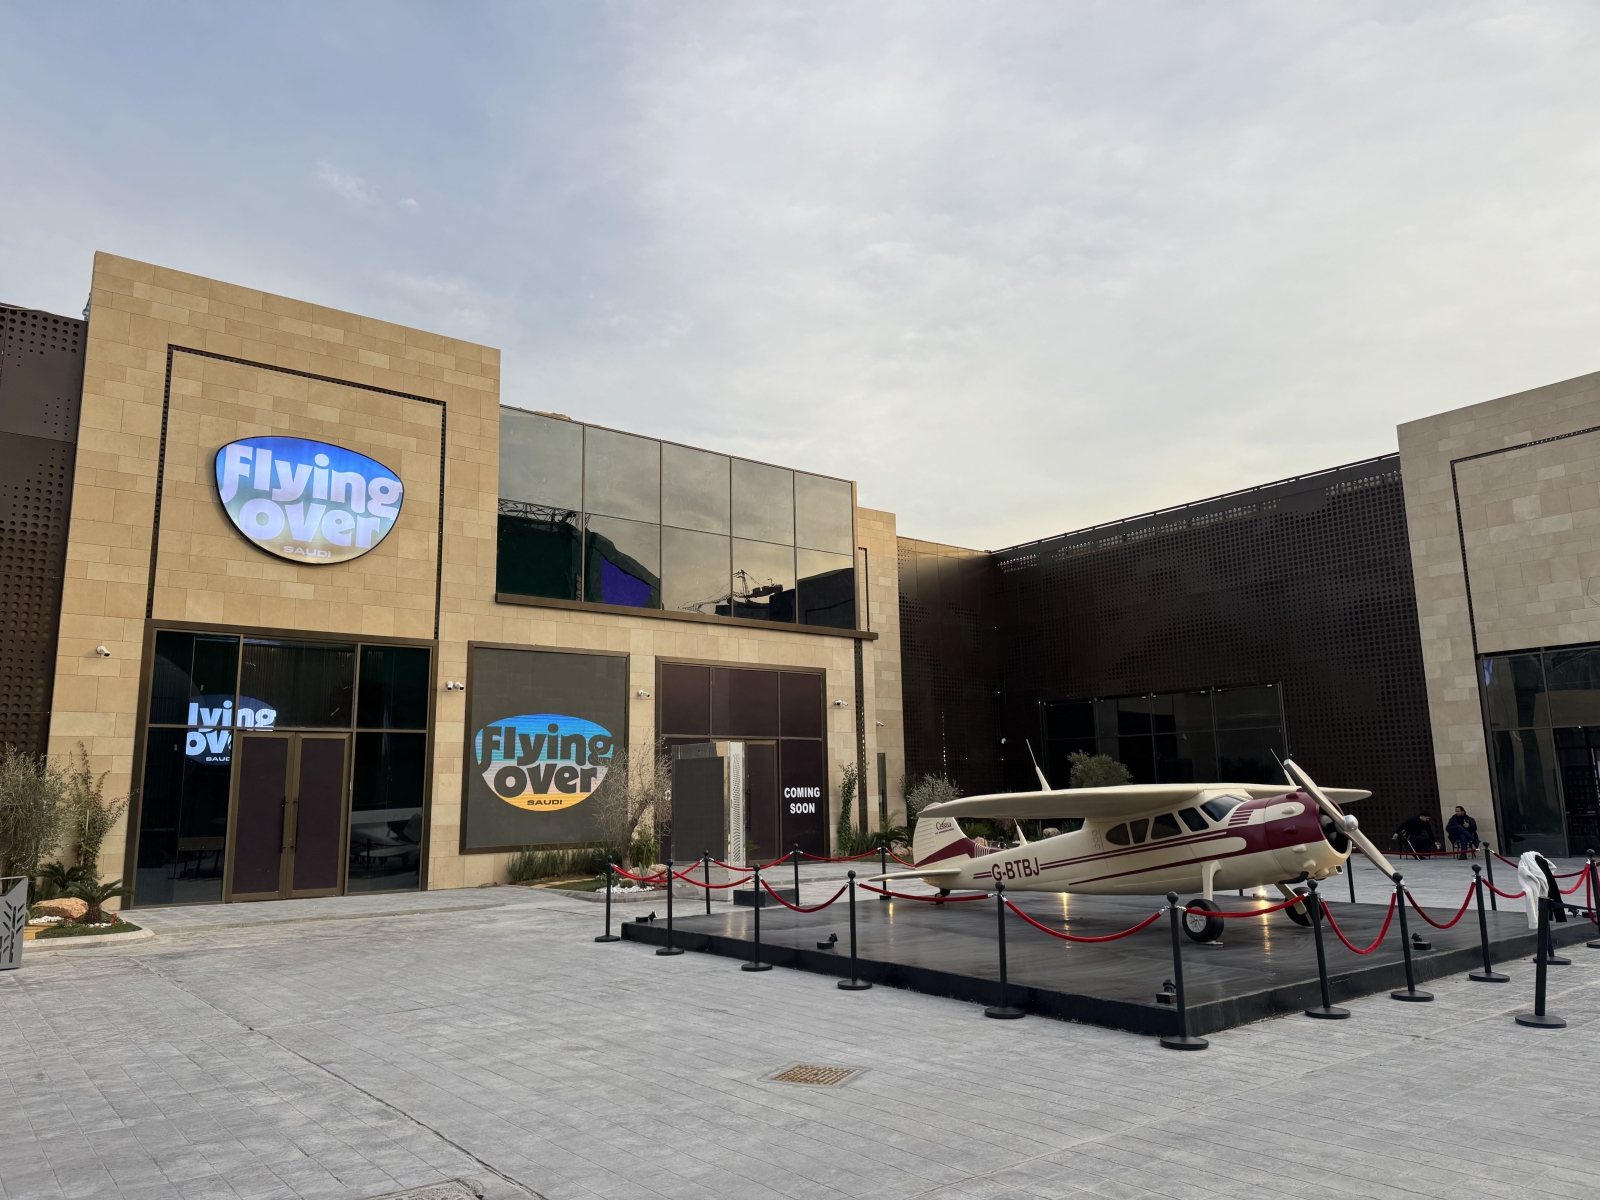
Brogent Technologies Inc. is a technology company specializing in simulation technology and digital content creation for the entertainment industry. The company provides software and hardware research and development, manufacturing, system integration, and theater design, planning, and construction services. Its core business involves producing simulation systems and game applications that utilize 3D dynamic simulation technology to create immersive experiences for theme parks and large-scale amusement venues. Brogent Technologies develops ride systems that are media-driven, combining storytelling with technical engineering to deliver realistic sensations such as flight. The company's products include interactive attractions where guests can simulate activities like flying, jumping, or co-piloting aircraft. Brogent Technologies serves clients in the leisure and entertainment sector, including theme parks and adventure zoos, with partners including Wildlands Adventure Zoo Emmen and Hyundai Motor Studio Goyang. Summarised from the company's own disclosures, fiscal year ended Oct 2026 |
Industry Leisure | Homepage brogent.com |
| Sector Consumer Cyclical | IR page brogent.com/en/investor-1.html | |
|
Tags
simulation technology, theme park attractions, digital content creation, system integration, theater design, ride engineering, virtual reality, amusement venues, Wildlands Adventure Zoo Emmen, Hyundai Motor Studio Goyang
|
Press page — |
Metrics
| Valuation | |
|---|---|
| Market cap | NT$ 6.185B |
| Market cap (USD) | $ 187.731M |
| P/E | 15.29 |
| PEG | — |
| P/BV | 1.35 |
| P/S | 2.91 |
| P/OCF | 29.36 |
| P/FCF | — |
| Dividend yield | — |
| Turnover / mcap | — |
| Returns | |
|---|---|
| ROE | -5.1% |
| ROI | -5.3% |
| ROIC | -2.7% |
| Profit margin | -14.7% |
| Growth | |
|---|---|
| Revenue growing | No |
| Profits growing | No |
| Revenue up 3y | No |
| Revenue up 5y | No |
| Earnings growth 3y (net profit CAGR) | — |
| Quality | |
|---|---|
| Profitable | No |
| Margin expanding | No |
| Buying back stock | No |
| Diluting (TTM) | Yes |
| Debt/Equity | — |
| Podcast bulls (TTM) | Sign up |
| Podcast bears (TTM) | Sign up |
| Podcast sentiment (TTM) | Sign up |
| Podcast sentiment % (TTM) | Sign up |
| News sentiment (TTM) | 0 |
| Quality score | -75.0% |
| Insiders | |
|---|---|
| Buys, 1w | Sign up |
| Buys, 1m | Sign up |
| Buys, 1y | Sign up |
| Sells, 1w | Sign up |
| Sells, 1m | Sign up |
| Sells, 1y | Sign up |
Sign up to see this company's insider trades
| Figure | FY 2025 | FY 2024 | FY 2023 | FY 2022 | FY 2021 | FY 2020 | FY 2019 | FY 2018 | FY 2017 | FY 2016 | FY 2015 | FY 2014 | FY 2013 |
|---|---|---|---|---|---|---|---|---|---|---|---|---|---|
| Revenue | 1.339B | 1.392B | 862.703M | 803.766M | 787.749M | 1.063B | 2.08B | 1.637B | 1.514B | 881.67M | 705.424M | 829.511M | 333.559M |
| Net profit | -197.186M | 73.402M | -179.764M | -60.726M | -131.956M | -49.184M | 366.525M | 257.168M | 265.67M | 101.354M | 112.384M | 224.432M | -5.982M |
| Figure | FY 2025 | FY 2024 | FY 2023 | FY 2022 | FY 2021 | FY 2020 | FY 2019 | FY 2018 | FY 2017 | FY 2016 | FY 2015 | FY 2014 | FY 2013 |
|---|---|---|---|---|---|---|---|---|---|---|---|---|---|
| Share price | 103.5 | — | — | — | — | — | — | — | — | — | — | — | — |
| P/S | 5.48 | — | — | — | — | — | — | — | — | — | — | — | — |
Sign up to see institutional holdings
Sign UpPodcast Mentions
Sign up to see podcast mentions and sentiment
Sign UpMaterial information published on MOPS, newest first, subjects as filed in Chinese, guarantee and loan balance notices and routine equipment purchases included. The link opens the company's material information on MOPS. Press releases from the company's own website, newest first.



 Family Membership Program












Prompts
Click prompts to add them under the company line, click again to take one out, then copy the result into your AI chat. Shared by Asian Century Stocks and Uncovered Thai Stocks. Thank you.
Brogent Technologies Inc. (ticker 5263.TWO), listed in Taiwan.
Copied
ETFs Holding Brogent Technologies Inc.
Exchange-traded funds whose newest published daily portfolio holds one of the company's listings, largest weight first.