公告本公司董事會決議買回庫藏股事宜
Bull 3
Bear 0
Capital return
5009.TWO
|
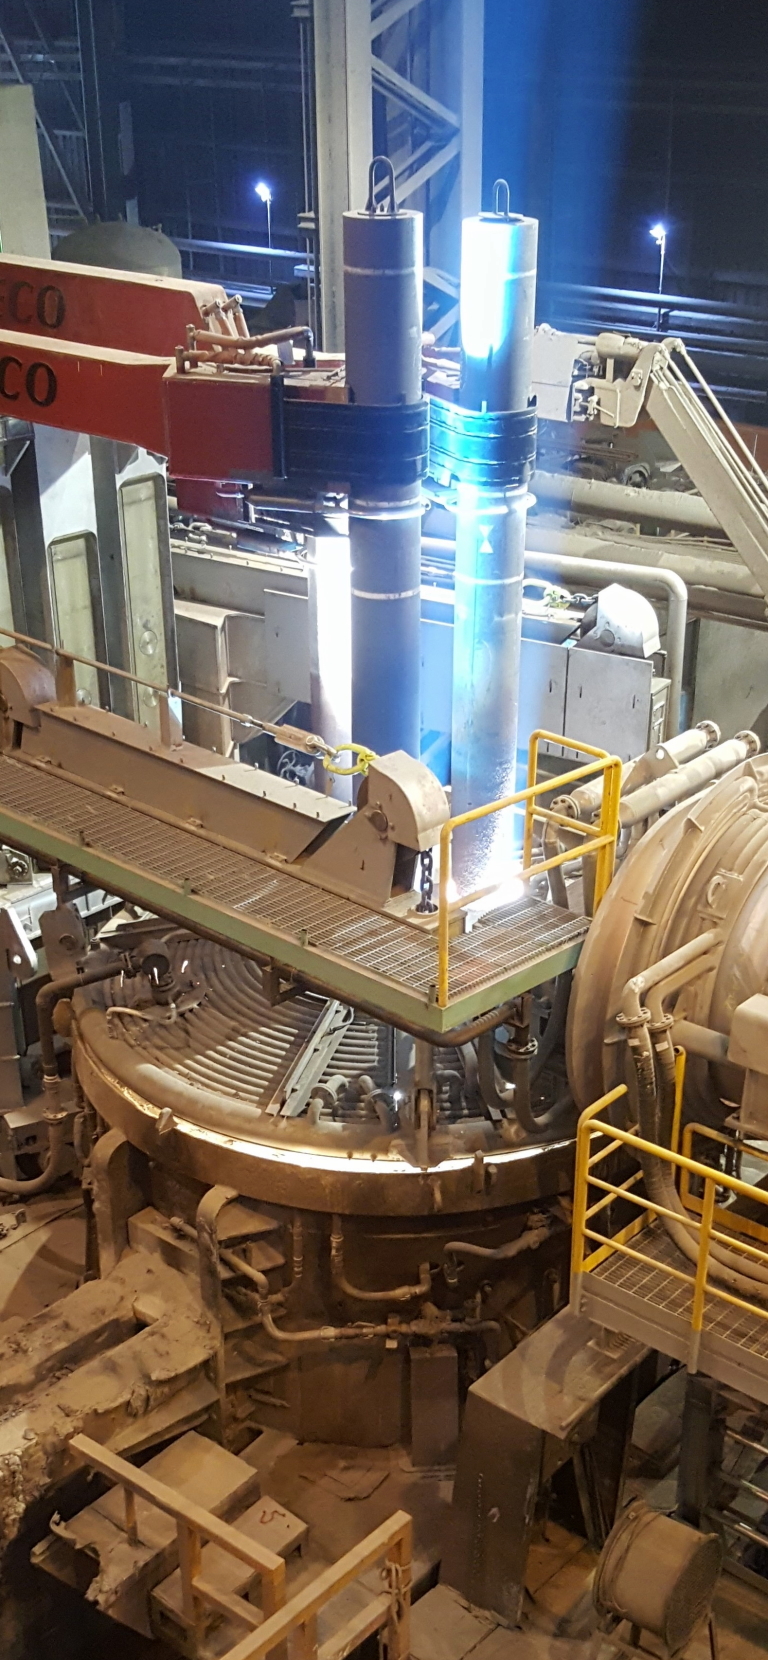
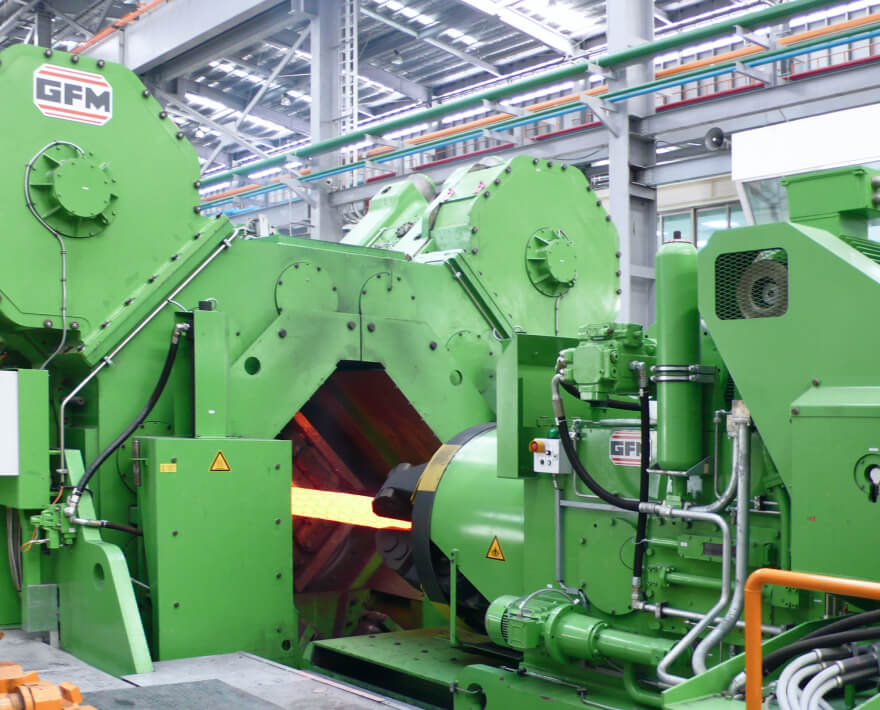
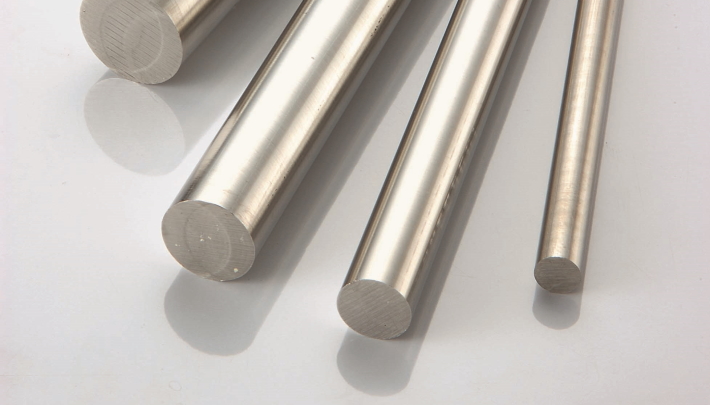
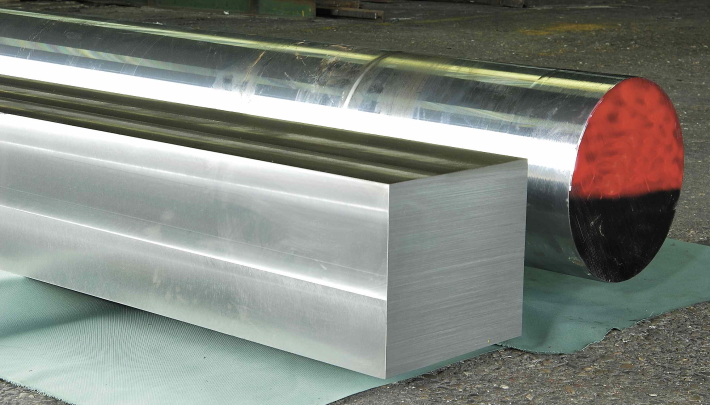
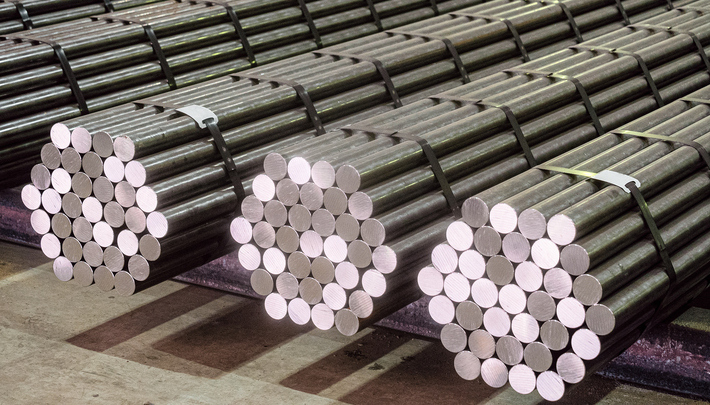
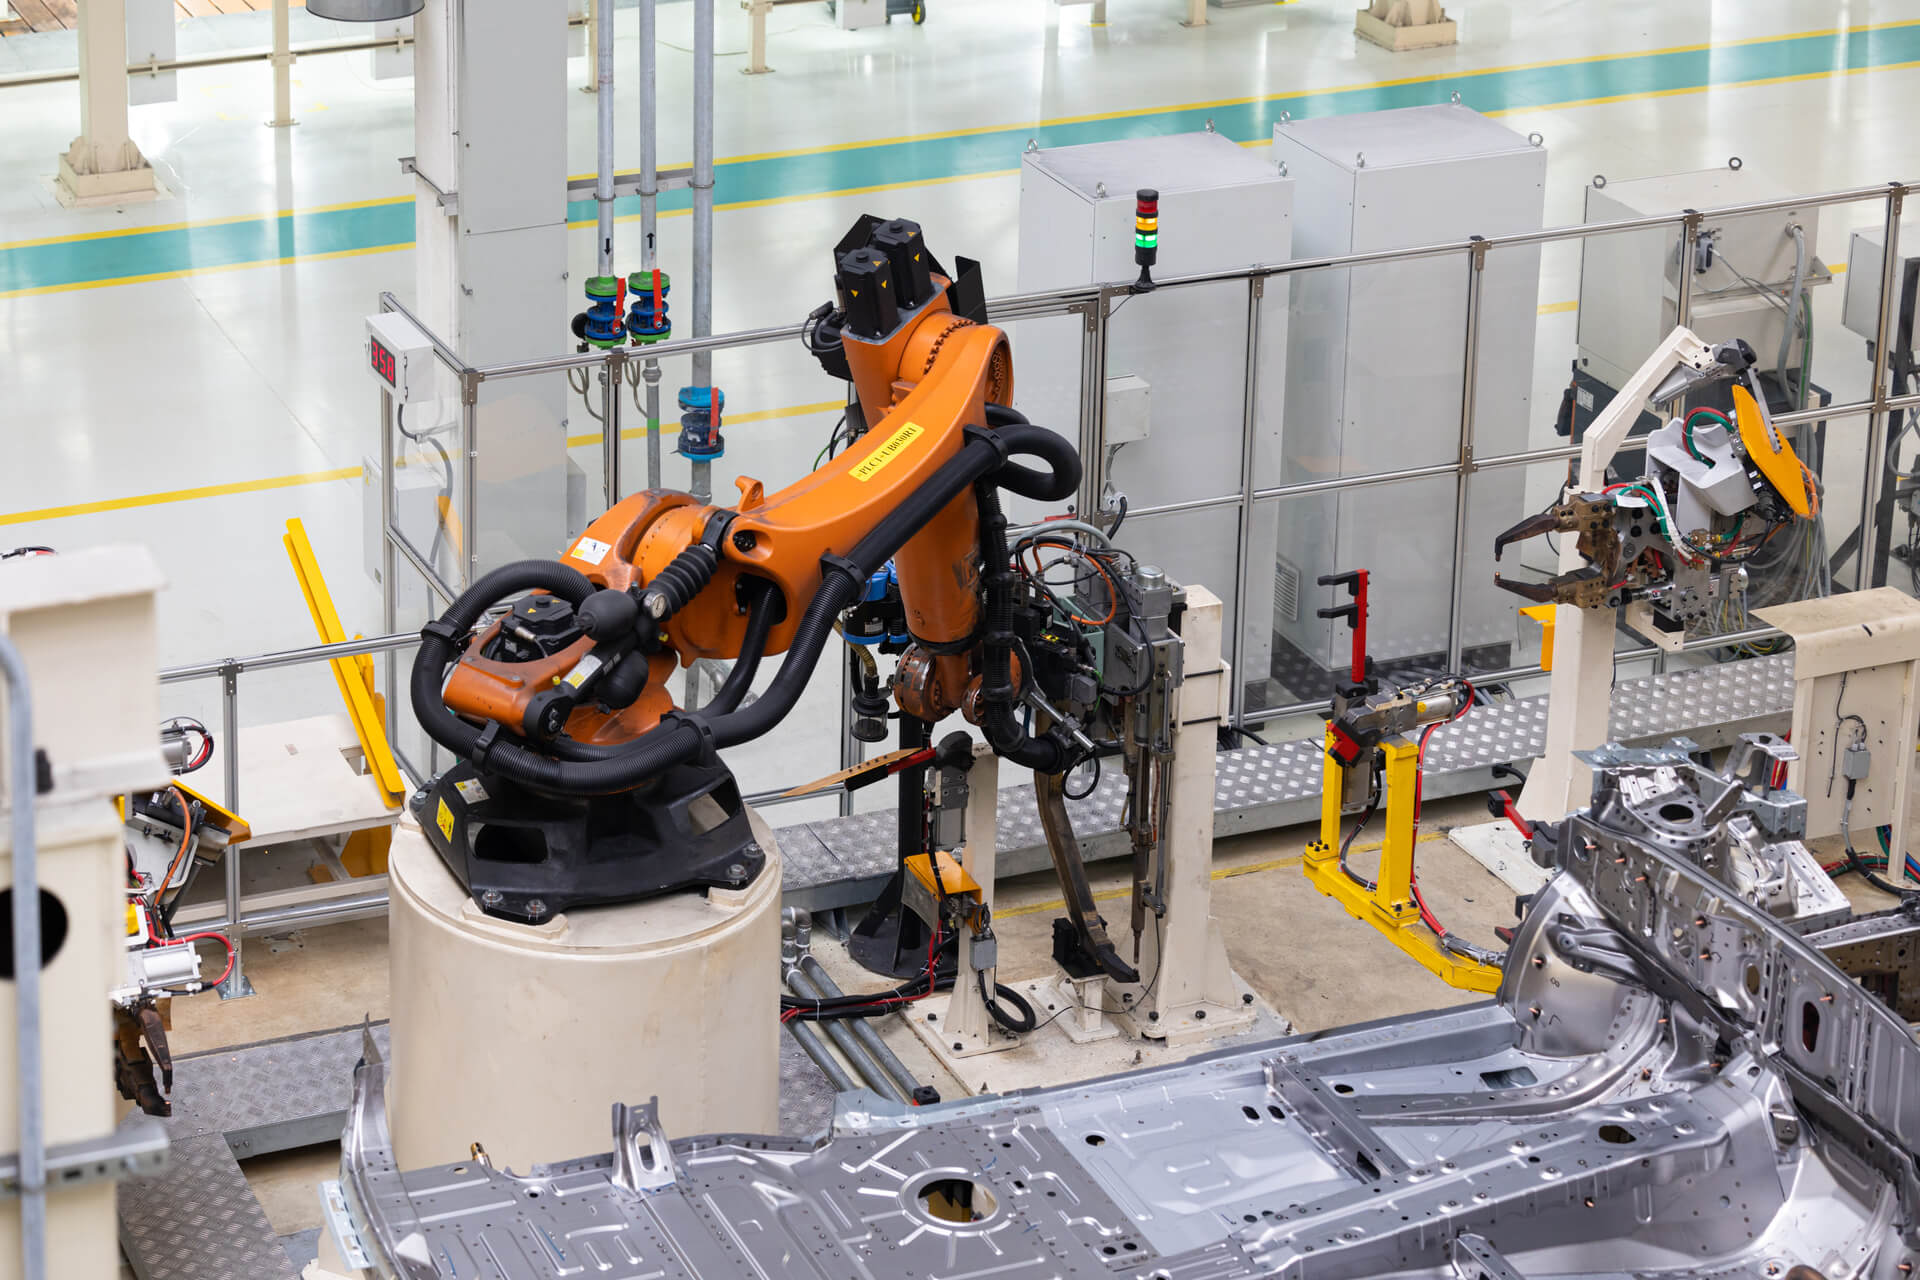
Gloria Material Technology Corp. is a manufacturer of special steel bar products, producing austenitic, martensitic, and precipitation-hardening stainless steels, cold and hot work tool steels, high-speed steels, and low-alloy steels. The company supplies high-cleanliness materials through ESR and VAR processes, serving customers in the aerospace, energy, oil and gas, medical, tooling, and machinery industries. Products are distributed through tool steel channels and system integrators, with operations in the United States, Japan, China, and Vietnam. The company is part of the Taigang Group and operates a subsidiary in Japan, Gloria Material Technology Japan K.K. Summarised from the company's own disclosures, fiscal year ended Oct 2026 |
Industry Steel | Homepage gmtc.com.tw |
| Sector Basic Materials | IR page — | |
|
Tags
specialty steel, stainless steel, tool steel, aerospace materials, medical devices, oil and gas, energy sector, esr steel, var steel, high-speed steel, TS-GPA1, TS-GCA1, TS-GPX1, TS-GHA1, Gloria Material Technology Japan K.K.
|
Press page — |
Metrics
| Valuation | |
|---|---|
| Market cap | NT$ 15.69B |
| Market cap (USD) | $ 476.209M |
| P/E | 11.66 |
| PEG | — |
| P/BV | 0.89 |
| P/S | 1.29 |
| P/OCF | 17.91 |
| P/FCF | — |
| Dividend yield | — |
| Turnover / mcap | — |
| Returns | |
|---|---|
| ROE | 7.1% |
| ROI | 7.4% |
| ROIC | 4.8% |
| Profit margin | 11.2% |
| Growth | |
|---|---|
| Revenue growing | No |
| Profits growing | No |
| Revenue up 3y | No |
| Revenue up 5y | No |
| Earnings growth 3y (net profit CAGR) | -13.7% |
| Quality | |
|---|---|
| Profitable | Yes |
| Margin expanding | No |
| Buying back stock | No |
| Diluting (TTM) | No |
| Debt/Equity | — |
| Podcast bulls (TTM) | Sign up |
| Podcast bears (TTM) | Sign up |
| Podcast sentiment (TTM) | Sign up |
| Podcast sentiment % (TTM) | Sign up |
| News sentiment (TTM) | 0 |
| Quality score | -6.3% |
| Insiders | |
|---|---|
| Buys, 1w | Sign up |
| Buys, 1m | Sign up |
| Buys, 1y | Sign up |
| Sells, 1w | Sign up |
| Sells, 1m | Sign up |
| Sells, 1y | Sign up |
Sign up to see this company's insider trades
| Figure | FY 2025 | FY 2024 | FY 2023 | FY 2022 | FY 2021 | FY 2020 | FY 2019 | FY 2018 | FY 2017 | FY 2016 | FY 2015 | FY 2014 | FY 2013 | FY 2012 | FY 2011 | FY 2010 |
|---|---|---|---|---|---|---|---|---|---|---|---|---|---|---|---|---|
| Revenue | 11.56B | 12.864B | 13.525B | 12.365B | 8.771B | 7.64B | 10.562B | 10.276B | 9.167B | 8.742B | 10.863B | 12.183B | 10.725B | 11.402B | 12.827B | 8.483B |
| Net profit | 1.296B | 2.592B | 2.34B | 2.019B | 751.575M | 217.695M | 279.759M | 243.213M | 147.744M | 322.701M | 697.473M | 637.122M | 273.827M | 651.563M | 949.215M | 246.985M |
| Figure | FY 2025 | FY 2024 | FY 2023 | FY 2022 | FY 2021 | FY 2020 | FY 2019 | FY 2018 | FY 2017 | FY 2016 | FY 2015 | FY 2014 | FY 2013 | FY 2012 | FY 2011 | FY 2010 |
|---|---|---|---|---|---|---|---|---|---|---|---|---|---|---|---|---|
| Share price | 32.1 | — | — | — | — | — | — | — | — | — | — | — | — | — | — | — |
| P/S | 1.57 | — | — | — | — | — | — | — | — | — | — | — | — | — | — | — |
Sign up to see institutional holdings
Sign UpPodcast Mentions
Sign up to see podcast mentions and sentiment
Sign UpMaterial information published on MOPS, newest first, subjects as filed in Chinese, guarantee and loan balance notices and routine equipment purchases included. The link opens the company's material information on MOPS. Press releases from the company's own website, newest first.
公告透過體育署專戶捐贈台鋼雄鷹棒球隊股份有限公司 台鋼雄鷹棒球隊及台鋼運動行銷股份有限公司台鋼獵鷹籃球隊
Bull 0
Bear 0
Routine
公告本公司因會計師事務所內部輪調更換會計師
Bull 0
Bear 0
Routine
















Prompts
Click prompts to add them under the company line, click again to take one out, then copy the result into your AI chat. Shared by Asian Century Stocks and Uncovered Thai Stocks. Thank you.
Gloria Material Technology Corp. (ticker 5009.TWO), listed in Taiwan.
Copied
ETFs Holding Gloria Material Technology Corp.
Exchange-traded funds whose newest published daily portfolio holds one of the company's listings, largest weight first.
| ETF | Weight in ETF | Shares | Market value | As of |
|---|---|---|---|---|
| AVEE | 0.03% | 47,000 | $ 41.879K | Nov 16, 2026 |
| DFEM | 0.01% | 1,445,000 | $ 1.337M | Nov 12, 2026 |
| DFEV | 0.01% | 287,000 | $ 265.503K | Nov 12, 2026 |
| AVSE | 0.01% | 13,000 | $ 11.583K | Nov 16, 2026 |
| DEXC | 0.01% | 22,000 | $ 20.352K | Nov 12, 2026 |
| DFSE | 0.01% | 37,000 | $ 34.229K | Nov 12, 2026 |
| DFAE | 0.01% | 497,000 | $ 459.773K | Nov 12, 2026 |
| DFAX | 0.00% | 363,636 | $ 336.399K | Nov 12, 2026 |
| AVEM | 0.00% | 675,000 | $ 601.447K | Nov 16, 2026 |
| AVXC | 0.00% | 4,000 | $ 3,564.13 | Nov 16, 2026 |