中裕新藥長效愛滋新藥TMB-365/TMB-380臨床研究成果榮登 國際頂尖醫學期刊《The Lancet HIV》
Bull 5
Bear 0
Clinical/regulatory
4147.TWO
|
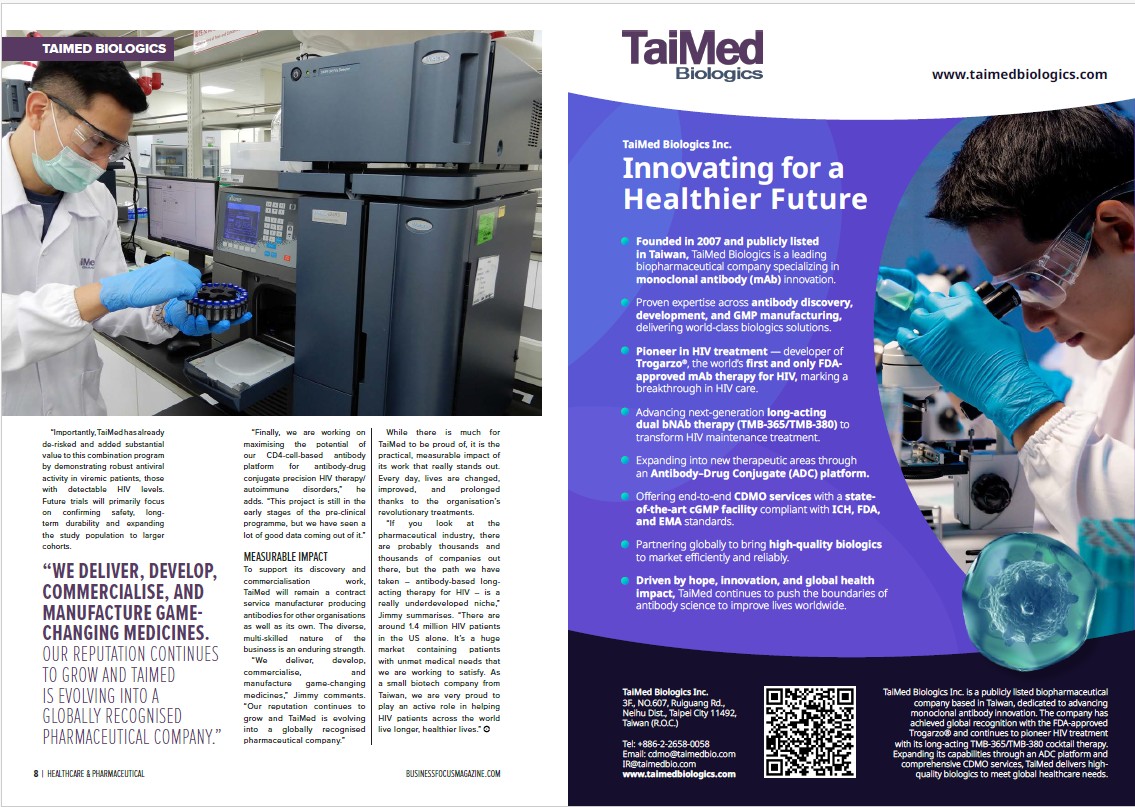
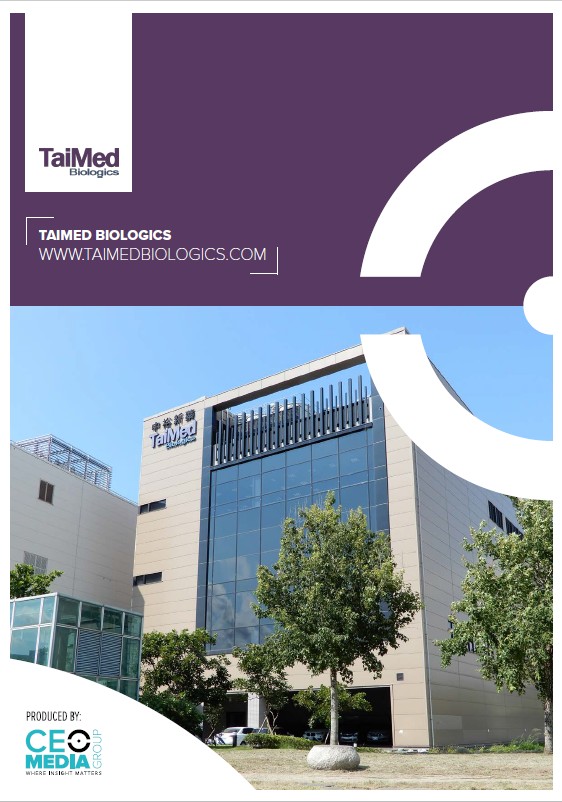
TaiMed Biologics Inc. is a commercial-stage biologics company focused on developing CD4-targeted antibody therapies for long-acting HIV treatment and broader immune-directed applications. The company’s portfolio includes Trogarzo, the first FDA-approved monoclonal antibody for HIV treatment, and its lead clinical program, TMB-365/380, a dual-antibody regimen in Phase 2b for HIV maintenance therapy. TaiMed also operates a contract development and manufacturing organization (CDMO) division that provides integrated services including process development, analytical development, formulation, cGMP manufacturing, and regulatory support to external partners. The company collaborates with research institutions such as the Aaron Diamond AIDS Research Center, The Rockefeller University, and the National Institutes of Health. Summarised from the company's own disclosures, fiscal year ended Oct 2026 |
Industry Biotechnology | Homepage taimedbiologics.com |
| Sector Healthcare | IR page taimedbiologics.com | |
|
Tags
hiv treatment, monoclonal antibodies, cdmo services, long-acting therapy, antibody-drug conjugates, biologics manufacturing, clinical development, Trogarzo, TMB-365/380, CD4-ADC
|
Press page — |
Metrics
| Valuation | |
|---|---|
| Market cap | NT$ 15.402B |
| Market cap (USD) | $ 467.491M |
| P/E | -94.83 |
| PEG | — |
| P/BV | 4.23 |
| P/S | 23.70 |
| P/OCF | -40.58 |
| P/FCF | — |
| Dividend yield | — |
| Turnover / mcap | — |
| Returns | |
|---|---|
| ROE | -4.3% |
| ROI | -4.3% |
| ROIC | -3.8% |
| Profit margin | -27.4% |
| Growth | |
|---|---|
| Revenue growing | Yes |
| Profits growing | Yes |
| Revenue up 3y | No |
| Revenue up 5y | No |
| Earnings growth 3y (net profit CAGR) | — |
| Quality | |
|---|---|
| Profitable | No |
| Margin expanding | Yes |
| Buying back stock | No |
| Diluting (TTM) | No |
| Debt/Equity | — |
| Podcast bulls (TTM) | Sign up |
| Podcast bears (TTM) | Sign up |
| Podcast sentiment (TTM) | Sign up |
| Podcast sentiment % (TTM) | Sign up |
| News sentiment (TTM) | 0 |
| Quality score | -43.8% |
| Insiders | |
|---|---|
| Buys, 1w | Sign up |
| Buys, 1m | Sign up |
| Buys, 1y | Sign up |
| Sells, 1w | Sign up |
| Sells, 1m | Sign up |
| Sells, 1y | Sign up |
Sign up to see this company's insider trades
| Figure | FY 2025 | FY 2024 | FY 2023 | FY 2022 | FY 2021 | FY 2020 | FY 2019 | FY 2018 | FY 2017 | FY 2016 | FY 2015 | FY 2014 | FY 2013 | FY 2012 | FY 2011 | FY 2010 |
|---|---|---|---|---|---|---|---|---|---|---|---|---|---|---|---|---|
| Revenue | 611.35M | 610.162M | 491.777M | 563.008M | 413.442M | 722.485M | 704.504M | 241.041M | 8.436M | 2.076M | — | — | — | 0 | 135K | 0 |
| Net profit | -167.776M | -201.832M | -194.81M | -269.289M | -470.933M | -183.304M | -578.654M | -321.71M | -524.554M | -281.962M | -471.68M | -281.735M | -251.677M | -207.298M | -204.52M | -238.207M |
| Figure | FY 2025 | FY 2024 | FY 2023 | FY 2022 | FY 2021 | FY 2020 | FY 2019 | FY 2018 | FY 2017 | FY 2016 | FY 2015 | FY 2014 | FY 2013 | FY 2012 | FY 2011 | FY 2010 |
|---|---|---|---|---|---|---|---|---|---|---|---|---|---|---|---|---|
| Share price | 61.2 | — | — | — | — | — | — | — | — | — | — | — | — | — | — | — |
| P/S | 27.35 | — | — | — | — | — | — | — | — | — | — | — | — | — | — | — |
Sign up to see institutional holdings
Sign UpPodcast Mentions
Sign up to see podcast mentions and sentiment
Sign UpMaterial information published on MOPS, newest first, subjects as filed in Chinese, guarantee and loan balance notices and routine equipment purchases included. The link opens the company's material information on MOPS. Press releases from the company's own website, newest first.


 Contact CDMO Service
Prompts
Click prompts to add them under the company line, click again to take one out, then copy the result into your AI chat. Shared by Asian Century Stocks and Uncovered Thai Stocks. Thank you.
TaiMed Biologics Inc. (ticker 4147.TWO), listed in Taiwan.
Copied