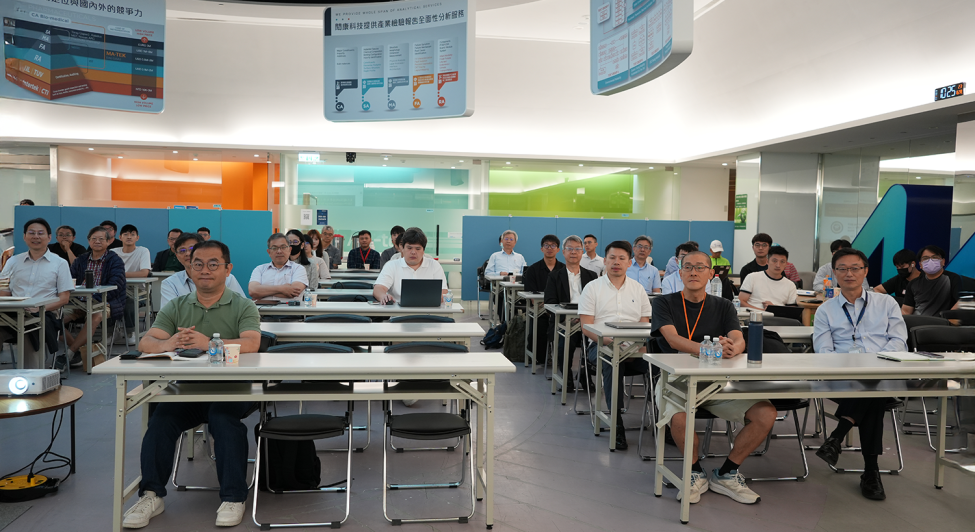
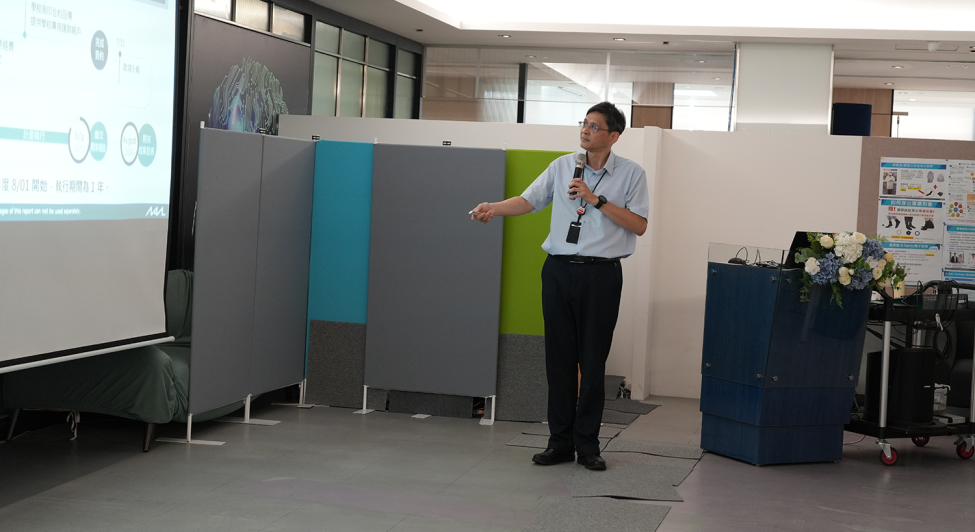
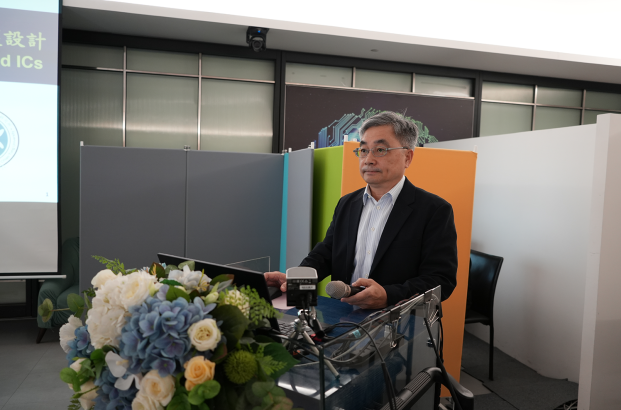
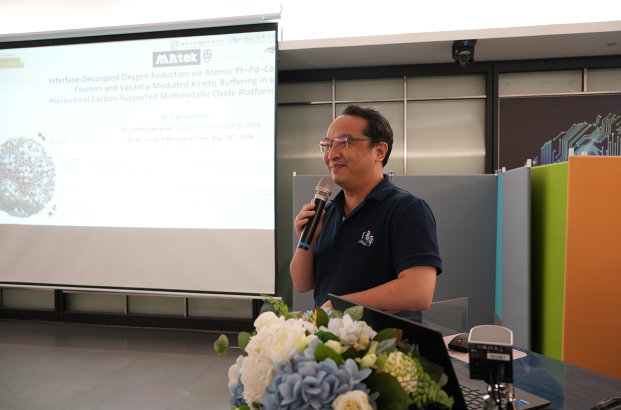
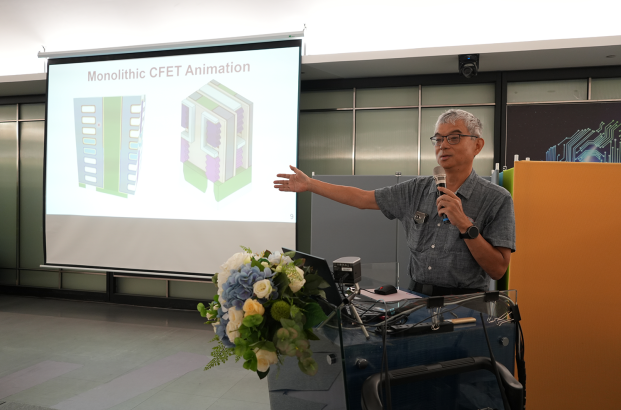
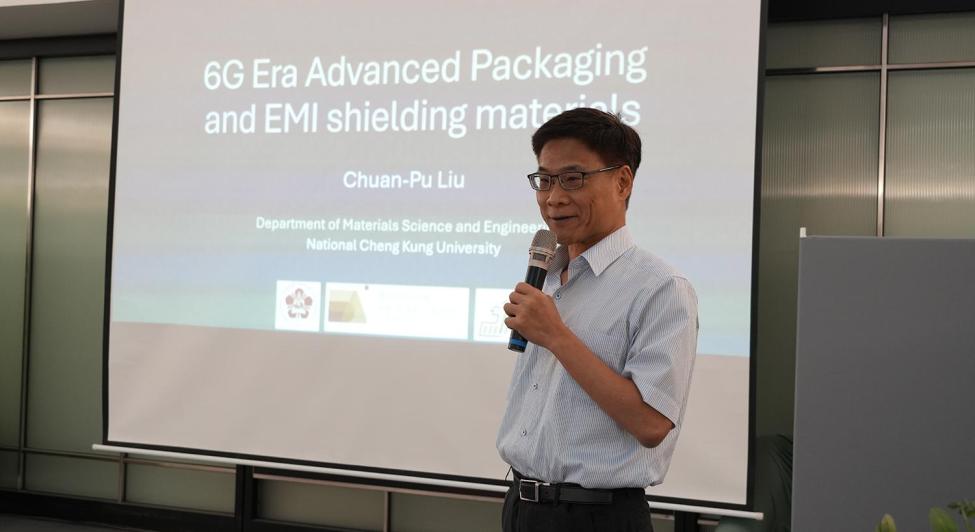
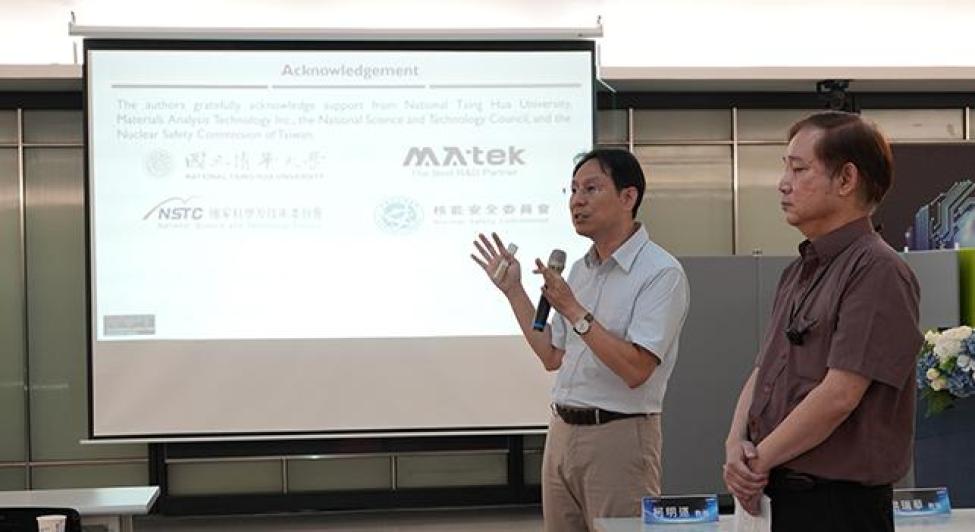
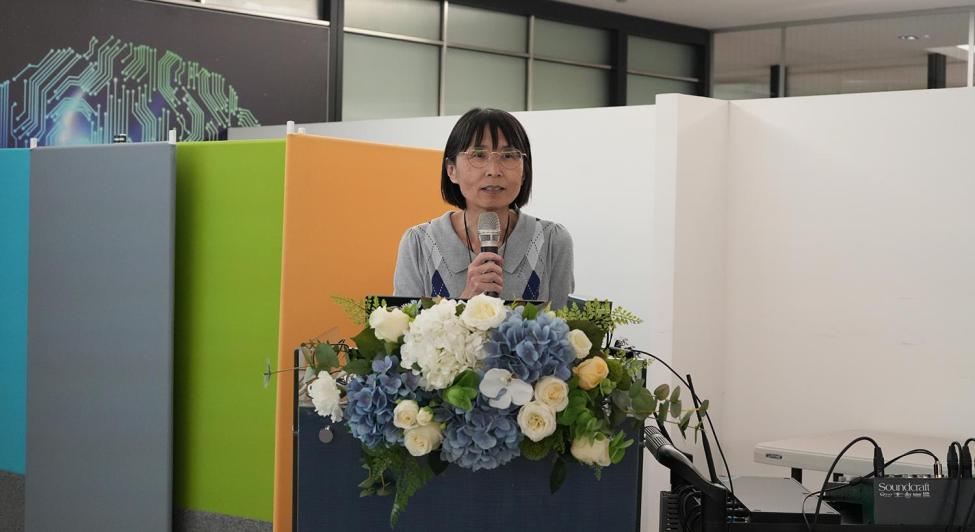
公告本公司受邀參加證券櫃檯買賣中心所舉辦之櫃買市場業績發表會
Bull 0
Bear 0
Routine
3587.TWO
|
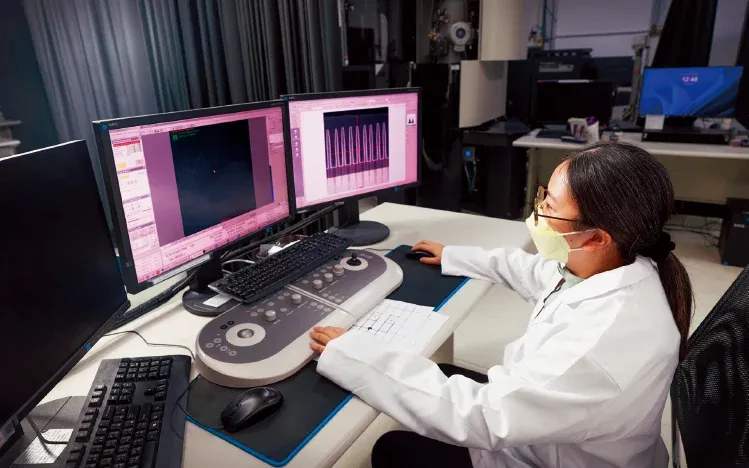
Materials Analysis Technology Inc. is a technical services company providing material analysis, failure analysis, and reliability testing for the electronics and semiconductor industries. The company operates as an independent third-party laboratory, offering services across the IC supply chain including design, manufacturing, packaging, and testing stages. Its service portfolio includes surface analysis, chemical analysis, and sample preparation, supported by advanced equipment such as TEM, SIMS, XPS, and DB-FIB. The company serves customers in the semiconductor, automotive, and academic research sectors in Taiwan, mainland China, Japan, and other international markets. It maintains laboratory facilities in locations including Hsinchu, Taichung, Tainan, Shanghai, Xiamen, Shenzhen, Suzhou, and various cities in Japan. Founded in 2002, the company established its Silicon Laboratory in 2008 to centralize high-end material analysis services. Summarised from the company's own disclosures, fiscal year ended Oct 2026 |
Industry Diagnostics & Research | Homepage matek.com |
| Sector Healthcare | IR page matek.com/investor | |
|
Tags
material analysis, failure analysis, reliability testing, semiconductor testing, surface analysis, chemical analysis, third-party laboratory, ic supply chain, Silicon Laboratory, SoC Lab
|
Press page — |
Metrics
| Valuation | |
|---|---|
| Market cap | NT$ 11.326B |
| Market cap (USD) | $ 343.763M |
| P/E | 18.54 |
| PEG | — |
| P/BV | 1.81 |
| P/S | 2.51 |
| P/OCF | 6.28 |
| P/FCF | — |
| Dividend yield | — |
| Turnover / mcap | — |
| Returns | |
|---|---|
| ROE | 8.4% |
| ROI | 8.4% |
| ROIC | 8.4% |
| Profit margin | 7.3% |
| Growth | |
|---|---|
| Revenue growing | Yes |
| Profits growing | No |
| Revenue up 3y | Yes |
| Revenue up 5y | Yes |
| Earnings growth 3y (net profit CAGR) | -13.4% |
| Quality | |
|---|---|
| Profitable | Yes |
| Margin expanding | No |
| Buying back stock | No |
| Diluting (TTM) | Yes |
| Debt/Equity | — |
| Podcast bulls (TTM) | Sign up |
| Podcast bears (TTM) | Sign up |
| Podcast sentiment (TTM) | Sign up |
| Podcast sentiment % (TTM) | Sign up |
| News sentiment (TTM) | 0 |
| Quality score | 12.5% |
| Insiders | |
|---|---|
| Buys, 1w | Sign up |
| Buys, 1m | Sign up |
| Buys, 1y | Sign up |
| Sells, 1w | Sign up |
| Sells, 1m | Sign up |
| Sells, 1y | Sign up |
Sign up to see this company's insider trades
| Figure | FY 2025 | FY 2024 | FY 2023 | FY 2022 | FY 2021 | FY 2020 | FY 2019 | FY 2018 | FY 2017 | FY 2016 | FY 2015 | FY 2014 | FY 2013 | FY 2012 | FY 2011 | FY 2010 |
|---|---|---|---|---|---|---|---|---|---|---|---|---|---|---|---|---|
| Revenue | 5.545B | 5.11B | 4.809B | 3.974B | 3.361B | 3.062B | 2.541B | 2.081B | 1.704B | 1.458B | 1.12B | 1.056B | 957.572M | 835.752M | 691.292M | 553.091M |
| Net profit | 407.095M | 688.123M | 686.211M | 627.49M | 586.54M | 385.077M | 245.943M | 256.507M | 214.807M | 230.43M | 177.577M | 209.572M | 220.526M | 193.404M | 133.535M | 84.893M |
| Figure | FY 2025 | FY 2024 | FY 2023 | FY 2022 | FY 2021 | FY 2020 | FY 2019 | FY 2018 | FY 2017 | FY 2016 | FY 2015 | FY 2014 | FY 2013 | FY 2012 | FY 2011 | FY 2010 |
|---|---|---|---|---|---|---|---|---|---|---|---|---|---|---|---|---|
| Share price | 185.5 | — | — | — | — | — | — | — | — | — | — | — | — | — | — | — |
| P/S | 2.24 | — | — | — | — | — | — | — | — | — | — | — | — | — | — | — |
Sign up to see institutional holdings
Sign UpPodcast Mentions
Sign up to see podcast mentions and sentiment
Sign UpMaterial information published on MOPS, newest first, subjects as filed in Chinese, guarantee and loan balance notices and routine equipment purchases included. The link opens the company's material information on MOPS. Press releases from the company's own website, newest first.
代重要子公司閎康技術檢測(上海)有限公司公告 本公司董事會決議資金貸與達第一項第一款公告。
Bull 0
Bear 0
Routine
公告本公司董事會決議買回庫藏股
Bull 2
Bear 0
Capital return

Prompts
Click prompts to add them under the company line, click again to take one out, then copy the result into your AI chat. Shared by Asian Century Stocks and Uncovered Thai Stocks. Thank you.
Materials Analysis Technology Inc. (ticker 3587.TWO), listed in Taiwan.
Copied
ETFs Holding Materials Analysis Technology Inc.
Exchange-traded funds whose newest published daily portfolio holds one of the company's listings, largest weight first.
| ETF | Weight in ETF | Shares | Market value | As of |
|---|---|---|---|---|
| AVES | 0.04% | 95,005 | $ 505.81K | Nov 16, 2026 |
| AVEE | 0.01% | 3,044 | $ 16.206K | Nov 16, 2026 |
| AVXC | 0.01% | 7,156 | $ 38.099K | Nov 16, 2026 |
| DFEM | 0.01% | 120,390 | $ 686.493K | Nov 12, 2026 |
| DFEV | 0.01% | 29,647 | $ 169.054K | Nov 12, 2026 |
| DEXC | 0.01% | 3,067 | $ 17.489K | Nov 12, 2026 |
| DFAE | 0.00% | 66,359 | $ 378.395K | Nov 12, 2026 |
| DFAX | 0.00% | 53,247 | $ 303.627K | Nov 12, 2026 |
| AVEM | 0.00% | 181,594 | $ 966.813K | Nov 16, 2026 |
| AVSE | 0.00% | 1,074 | $ 5,718.01 | Nov 16, 2026 |