公告本公司董事會通過115年第3季合併財務報告
Bull 0
Bear 0
Routine
3455.TWO
|
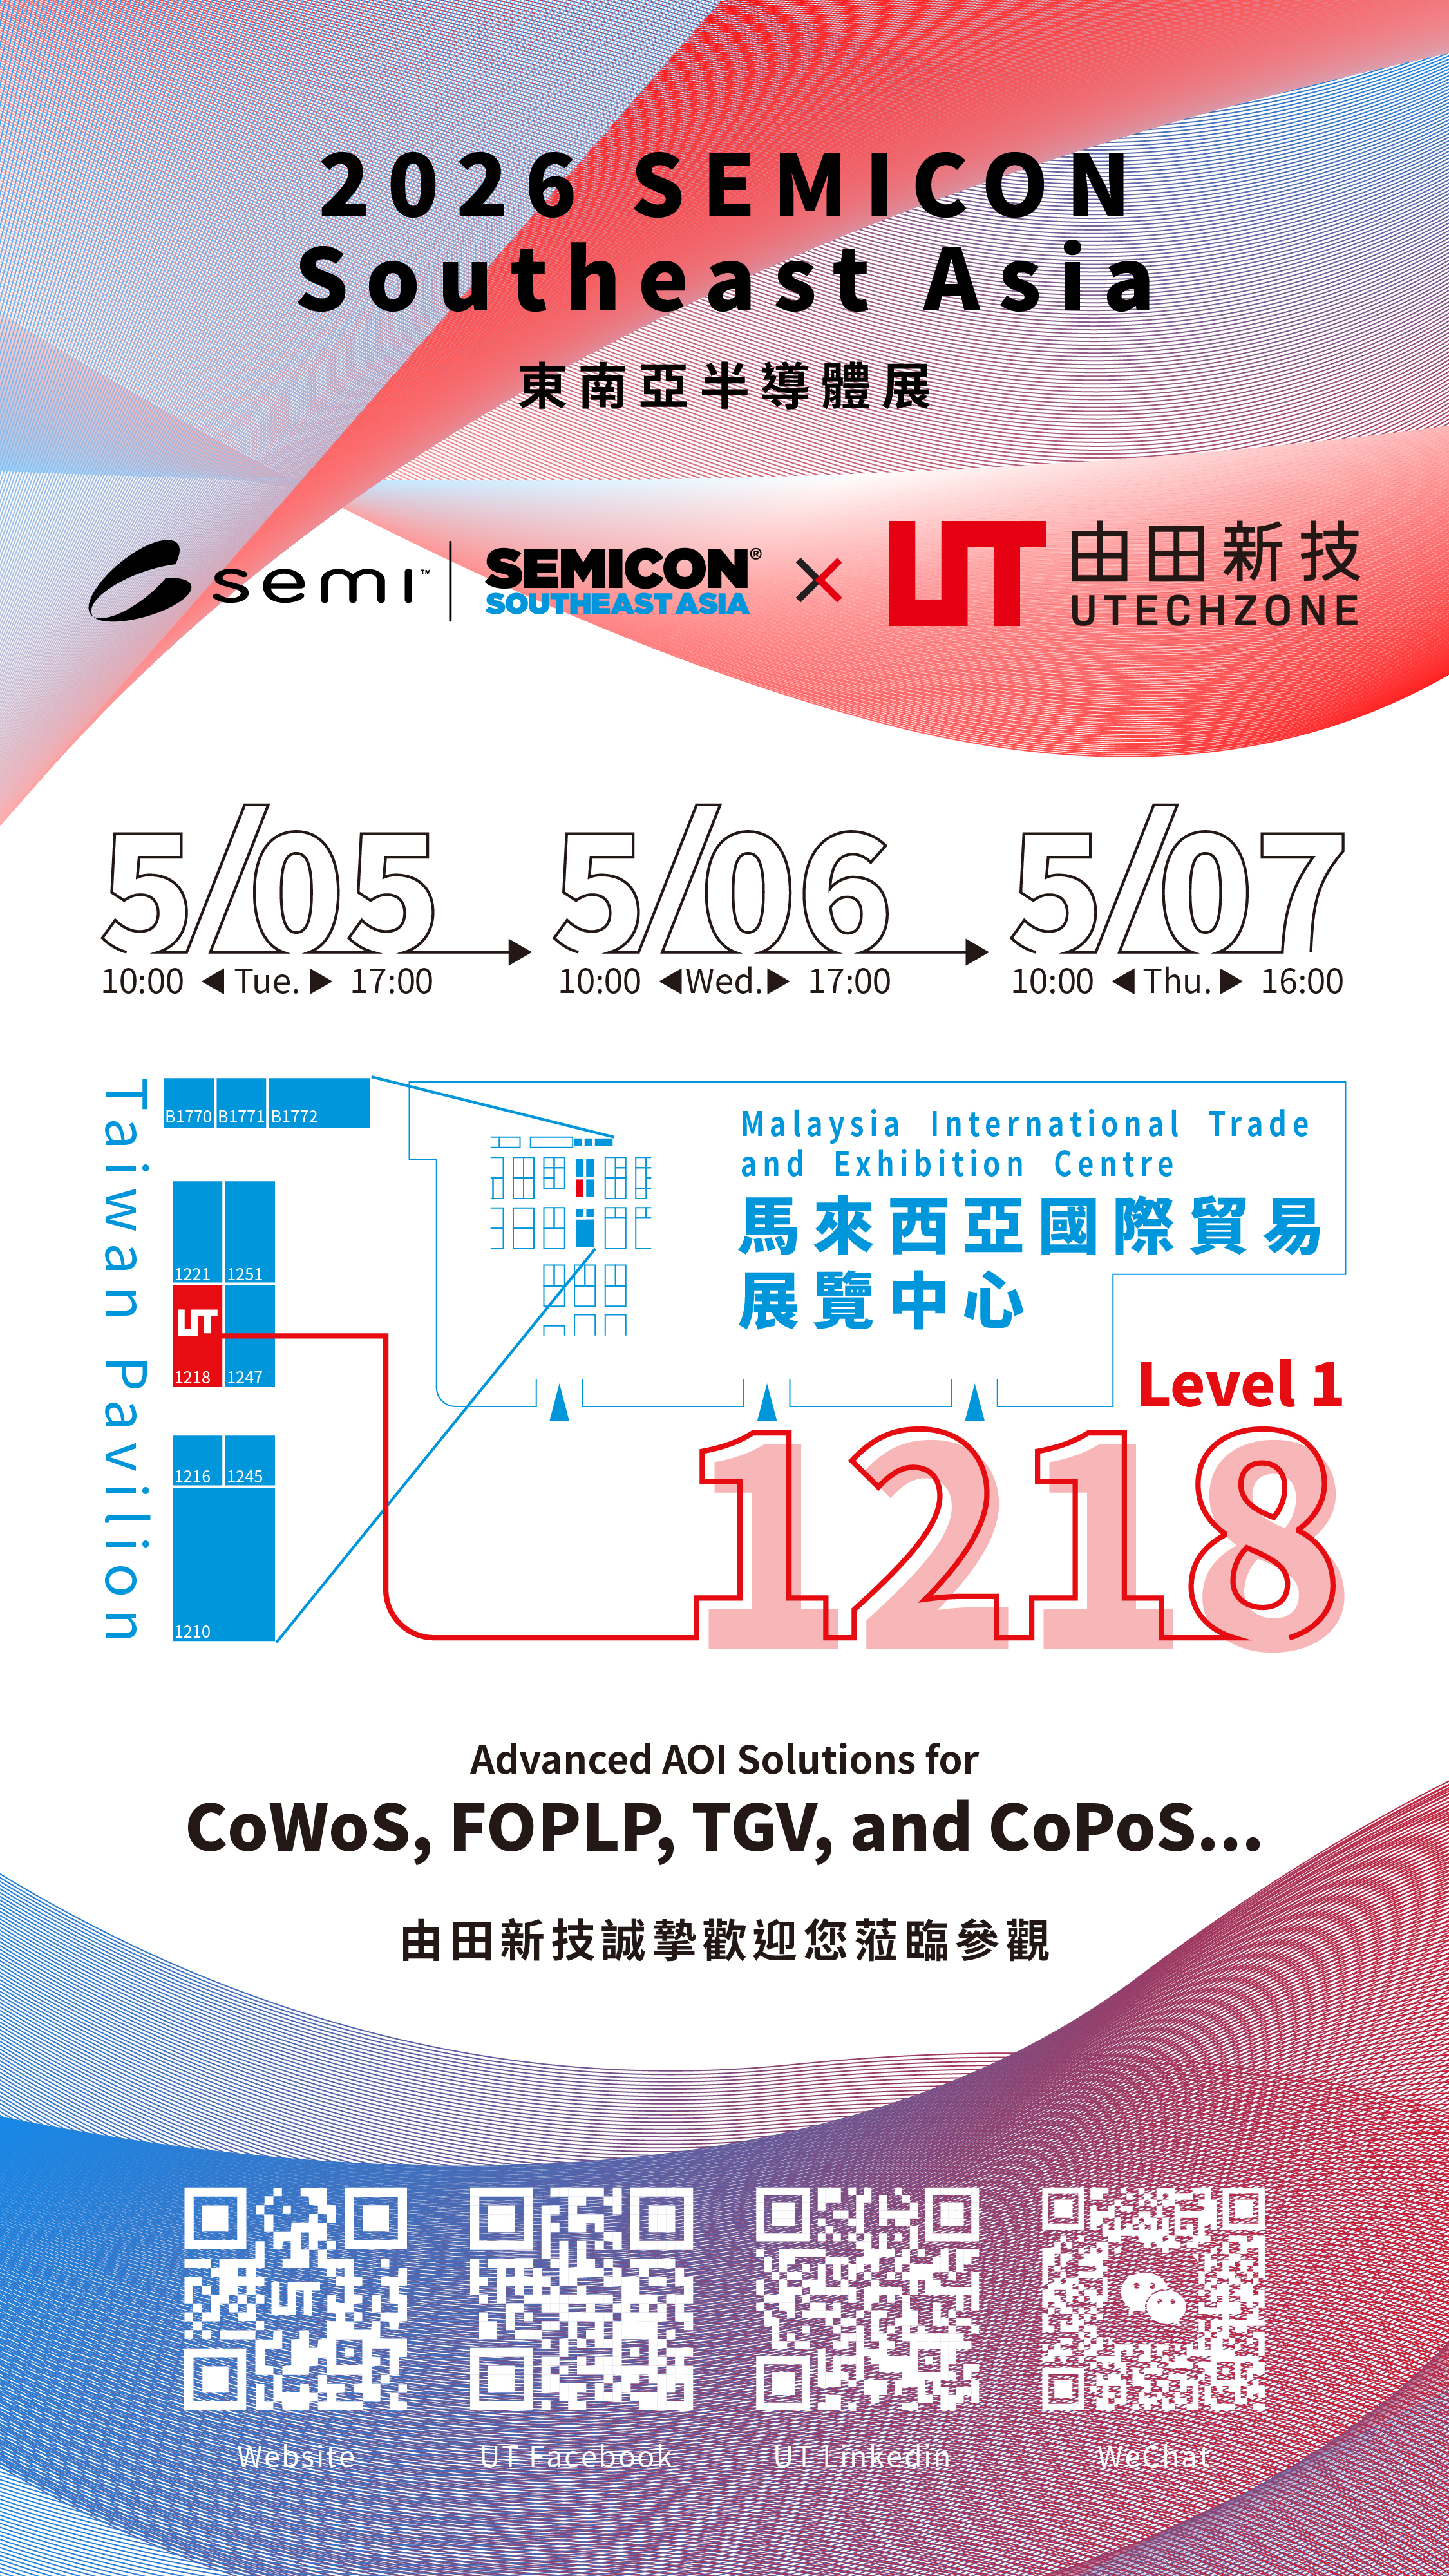
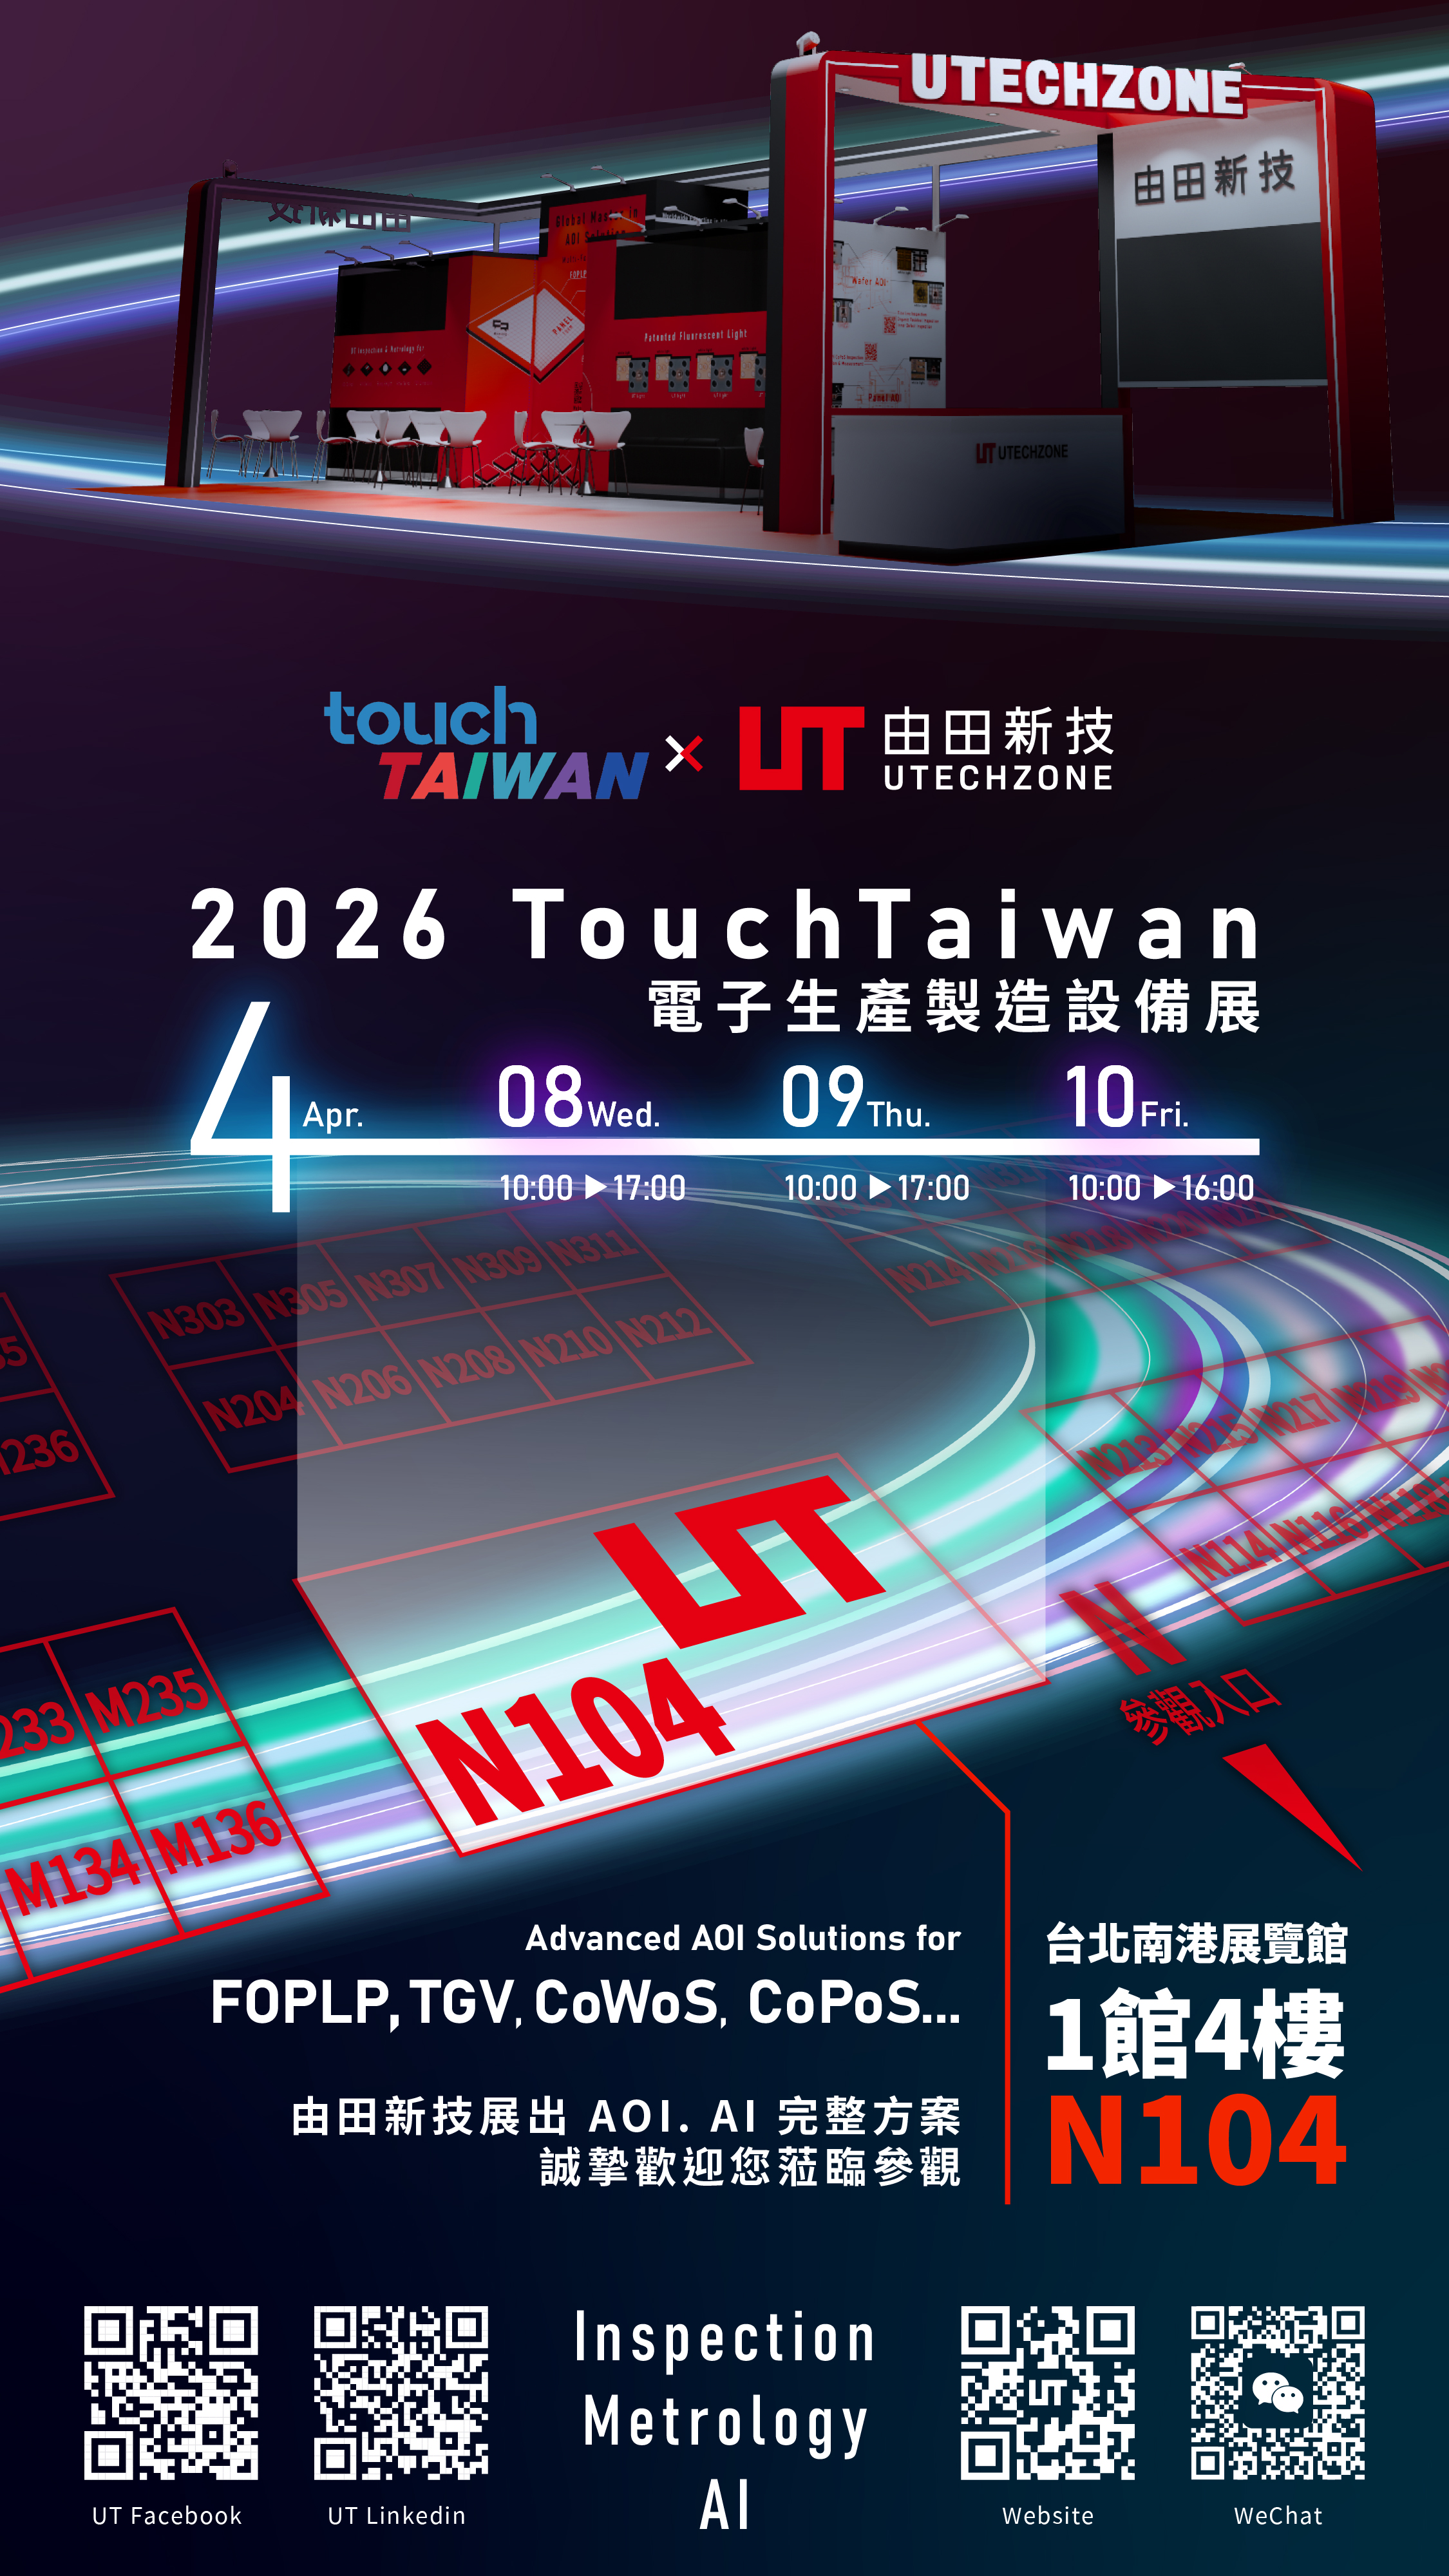
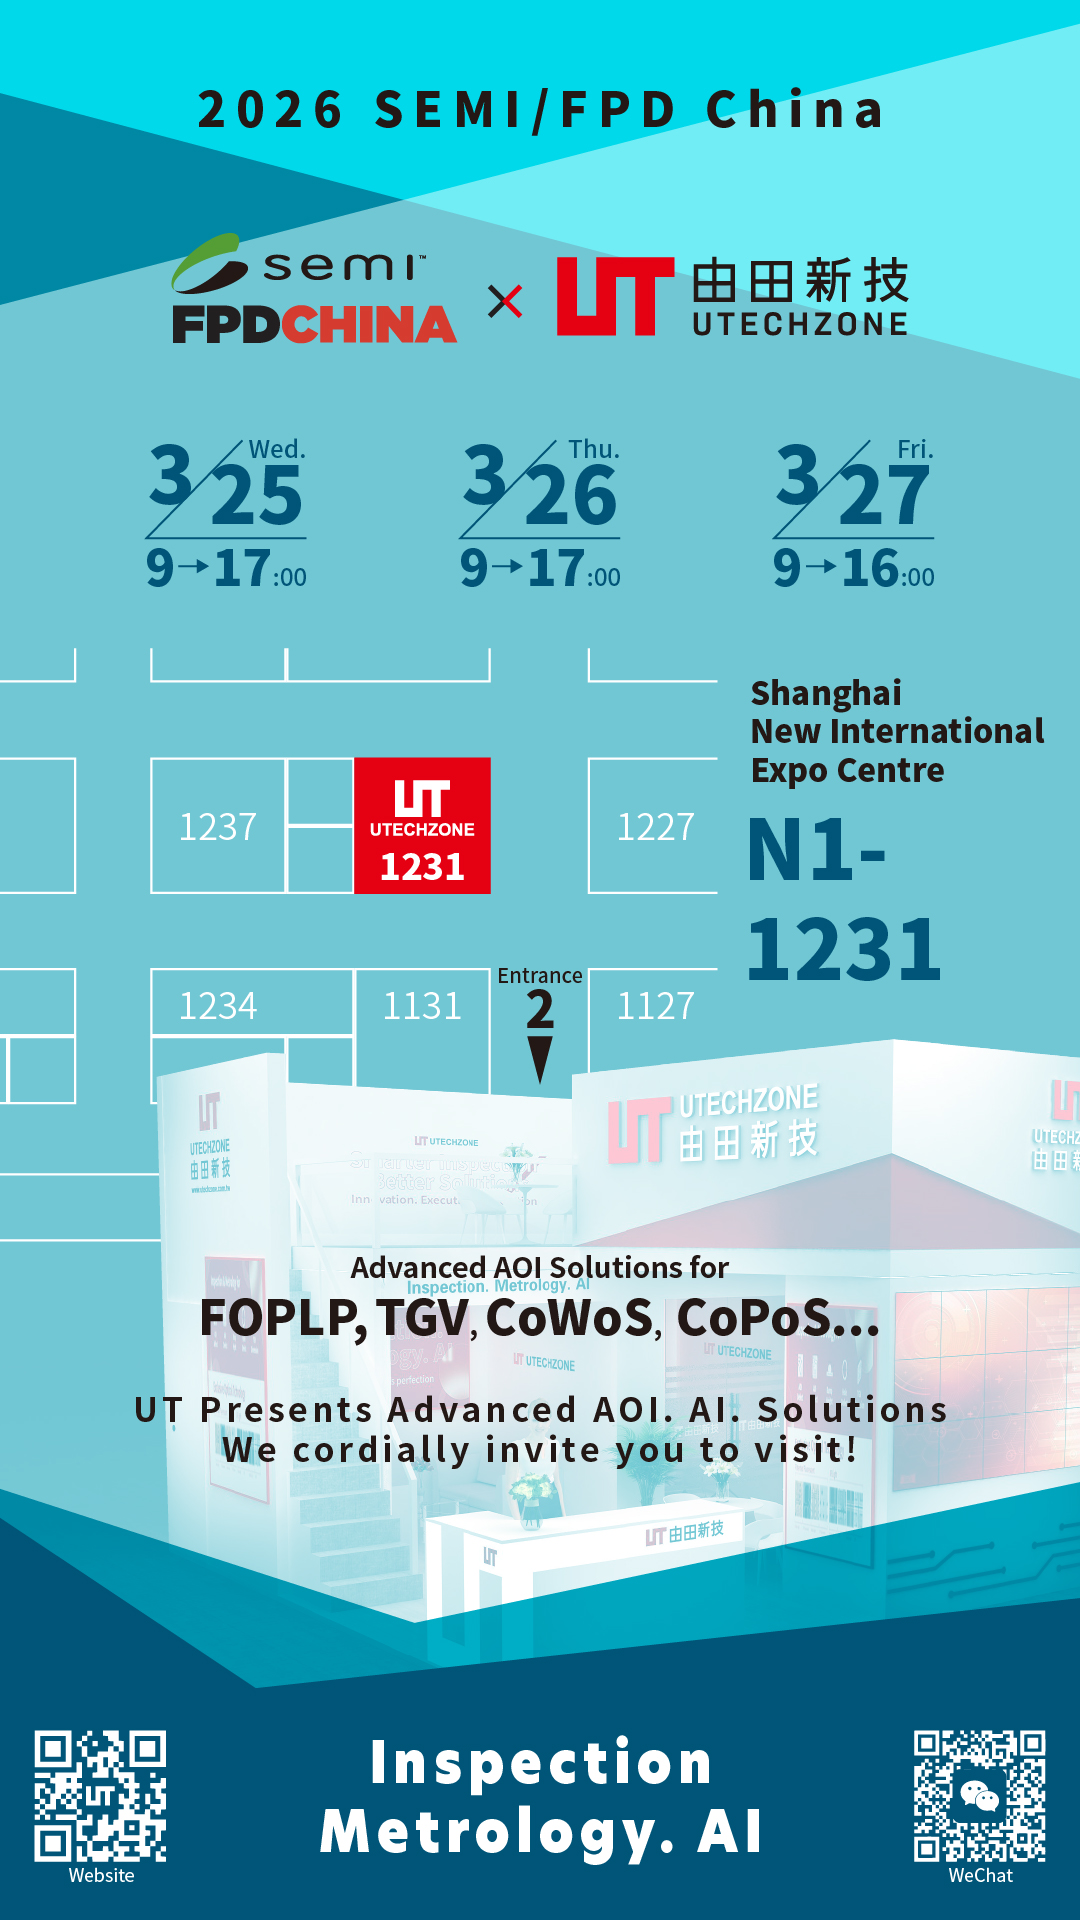
Utechzone Co., Ltd. is a provider of automated optical inspection (AOI) equipment and process knowledge platforms based on machine vision technology. Founded in 1992, the company develops and sells visual inspection solutions that integrate optical, software, intelligence, mechanical, and electrical components to ensure production yield and optimize unit production costs. Its business segments include the development of AOI systems and the provision of process knowledge services. The company serves customers in the electronics manufacturing and semiconductor industries, with operations in Taiwan, mainland China, and Japan. Utechzone participates in major industry exhibitions such as TPCA, Semicon Taiwan, and SEMI/FPD China, highlighting its focus on electronic production and manufacturing equipment. Summarised from the company's own disclosures |
Industry Specialty Industrial Machinery | Homepage utechzone.com.tw |
| Sector Industrials | IR page utechzone.com.tw | |
|
Tags
machine vision, automated optical inspection, process knowledge platform, electronics manufacturing, semiconductor inspection, visual inspection solutions, Vision Automation Service Technology
|
Press page — |
Metrics
| Valuation | |
|---|---|
| Market cap | NT$ 8.109B |
| Market cap (USD) | $ 246.133M |
| P/E | 57.91 |
| PEG | — |
| P/BV | 3.25 |
| P/S | 5.40 |
| P/OCF | 23.46 |
| P/FCF | — |
| Dividend yield | — |
| Turnover / mcap | — |
| Returns | |
|---|---|
| ROE | 6.1% |
| ROI | 6.2% |
| ROIC | 4.8% |
| Profit margin | 9.5% |
| Growth | |
|---|---|
| Revenue growing | No |
| Profits growing | No |
| Revenue up 3y | No |
| Revenue up 5y | No |
| Earnings growth 3y (net profit CAGR) | -40.3% |
| Quality | |
|---|---|
| Profitable | Yes |
| Margin expanding | No |
| Buying back stock | No |
| Diluting (TTM) | No |
| Debt/Equity | — |
| Podcast bulls (TTM) | Sign up |
| Podcast bears (TTM) | Sign up |
| Podcast sentiment (TTM) | Sign up |
| Podcast sentiment % (TTM) | Sign up |
| News sentiment (TTM) | 0 |
| Quality score | -43.8% |
| Insiders | |
|---|---|
| Buys, 1w | Sign up |
| Buys, 1m | Sign up |
| Buys, 1y | Sign up |
| Sells, 1w | Sign up |
| Sells, 1m | Sign up |
| Sells, 1y | Sign up |
Sign up to see this company's insider trades
| Figure | FY 2025 | FY 2024 | FY 2023 | FY 2022 | FY 2021 | FY 2020 | FY 2019 | FY 2018 | FY 2017 | FY 2016 | FY 2015 | FY 2014 | FY 2013 | FY 2012 | FY 2011 | FY 2010 |
|---|---|---|---|---|---|---|---|---|---|---|---|---|---|---|---|---|
| Revenue | 1.675B | 1.852B | 2.01B | 3.149B | 2.762B | 2.303B | 2.416B | 3.116B | 2.806B | 2.018B | 1.417B | 1.509B | 1.274B | 802.393M | 1.561B | 1.67B |
| Net profit | 159.912M | 316.558M | 314.229M | 750.849M | 448.978M | 241.299M | 364.465M | 291.33M | 169.217M | 248.237M | 187.062M | 122.596M | -60.222M | -211.487M | 99.119M | 279.543M |
| Figure | FY 2025 | FY 2024 | FY 2023 | FY 2022 | FY 2021 | FY 2020 | FY 2019 | FY 2018 | FY 2017 | FY 2016 | FY 2015 | FY 2014 | FY 2013 | FY 2012 | FY 2011 | FY 2010 |
|---|---|---|---|---|---|---|---|---|---|---|---|---|---|---|---|---|
| Share price | 112.5 | — | — | — | — | — | — | — | — | — | — | — | — | — | — | — |
| P/S | 4.02 | — | — | — | — | — | — | — | — | — | — | — | — | — | — | — |
Sign up to see institutional holdings
Sign UpPodcast Mentions
Sign up to see podcast mentions and sentiment
Sign UpMaterial information published on MOPS, newest first, subjects as filed in Chinese, guarantee and loan balance notices and routine equipment purchases included. The link opens the company's material information on MOPS. Press releases from the company's own website, newest first.
本公司有價證券近期多次達公布注意交易資訊標準, 故公告相關訊息,以利投資人區別暸解
Bull 0
Bear 0
Routine
本公司有價證券近期多次達公布注意交易資訊標準, 故公告相關訊息,以利投資人區別暸解
Bull 0
Bear 4
Routine



Prompts
Click prompts to add them under the company line, click again to take one out, then copy the result into your AI chat. Shared by Asian Century Stocks and Uncovered Thai Stocks. Thank you.
Utechzone Co., Ltd. (ticker 3455.TWO), listed in Taiwan.
Copied
ETFs Holding Utechzone Co., Ltd.
Exchange-traded funds whose newest published daily portfolio holds one of the company's listings, largest weight first.
| ETF | Weight in ETF | Shares | Market value | As of |
|---|---|---|---|---|
| EYLD | 1.15% | 1,968,676 | $ 9.899M | Jul 31, 2026 |
| AVEE | 0.01% | 2,000 | $ 10.175K | Nov 16, 2026 |
| AVXC | 0.01% | 6,000 | $ 30.524K | Nov 16, 2026 |
| DFEV | 0.01% | 23,000 | $ 128.361K | Nov 12, 2026 |
| AVEM | 0.00% | 85,000 | $ 432.427K | Nov 16, 2026 |
| AVES | 0.00% | 3,000 | $ 15.262K | Nov 16, 2026 |
| AVSE | 0.00% | 1,000 | $ 5,087.38 | Nov 16, 2026 |