本公司受邀參加康和證券投資論壇。
Bull 0
Bear 0
Routine
|
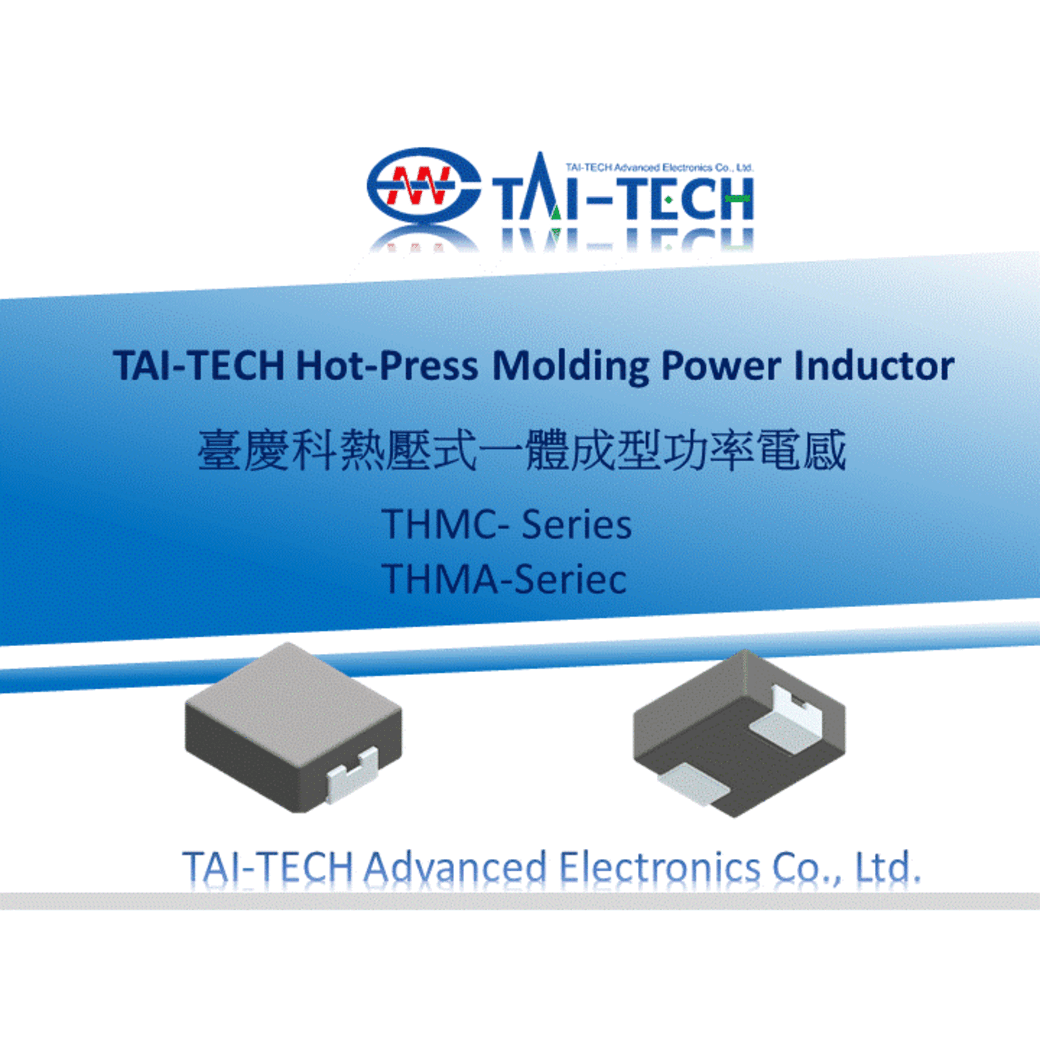
TAI-TECH Advanced Electronics Co., Ltd. is a manufacturer of passive electronic components, specializing in inductive components, magnetic materials, and related products. The company develops, manufactures, and sells wire-wound inductors, ferrite cores, network transformers, and common-mode filters. Its product portfolio includes wire-wound ceramic chip inductors, integrated power inductors, high-frequency chokes, and transient voltage suppressors. TAI-TECH serves the automotive, telecommunications, and consumer electronics industries, with applications ranging from RF signal matching in personal computers and routers to high-speed signal transmission in advanced driver-assistance systems and electric vehicles. The company operates manufacturing bases in the East China region and maintains sales and service networks in East China, South China, Singapore, South Korea, Europe, and the United States. Founded in 1975, TAI-TECH produces components that meet automotive-grade AEC-Q200 standards for temperature ranges of -40 to 125 degrees Celsius. Summarised from the company's own disclosures, fiscal year ended Oct 2026 |
Industry Electronic Components | Homepage tai-tech.com.tw |
| Sector Technology | IR page — | |
|
Tags
passive components, inductors, ferrite cores, transformers, common-mode filters, automotive electronics, telecommunications, consumer electronics, rf signal matching, power inductors, SWIU-SERIES, Wire Wound Common Mode Choke L type, Trans-Inductor Voltage Regulator, Transient Voltage Suppressor, High Current Bead
|
Press page — |
Metrics
| Valuation | |
|---|---|
| Market cap | NT$ 17.405B |
| Market cap (USD) | $ 528.271M |
| P/E | 10.96 |
| PEG | 19.94 |
| P/BV | 1.42 |
| P/S | 2.11 |
| P/OCF | 25.41 |
| P/FCF | — |
| Dividend yield | — |
| Turnover / mcap | — |
| Returns | |
|---|---|
| ROE | 12.7% |
| ROI | 11.6% |
| ROIC | 7.4% |
| Profit margin | 15.9% |
| Growth | |
|---|---|
| Revenue growing | Yes |
| Profits growing | Yes |
| Revenue up 3y | No |
| Revenue up 5y | No |
| Earnings growth 3y (net profit CAGR) | 0.55% |
| Quality | |
|---|---|
| Profitable | Yes |
| Margin expanding | Yes |
| Buying back stock | No |
| Diluting (TTM) | Yes |
| Debt/Equity | — |
| Podcast bulls (TTM) | Sign up |
| Podcast bears (TTM) | Sign up |
| Podcast sentiment (TTM) | Sign up |
| Podcast sentiment % (TTM) | Sign up |
| News sentiment (TTM) | 0 |
| Quality score | 25.0% |
| Insiders | |
|---|---|
| Buys, 1w | Sign up |
| Buys, 1m | Sign up |
| Buys, 1y | Sign up |
| Sells, 1w | Sign up |
| Sells, 1m | Sign up |
| Sells, 1y | Sign up |
Sign up to see this company's insider trades
| Figure | FY 2025 | FY 2024 | FY 2023 | FY 2022 | FY 2021 | FY 2020 | FY 2019 | FY 2018 | FY 2017 | FY 2016 | FY 2015 | FY 2014 | FY 2013 | FY 2012 | FY 2011 | FY 2010 |
|---|---|---|---|---|---|---|---|---|---|---|---|---|---|---|---|---|
| Revenue | 6.624B | 5.506B | 4.432B | 5.291B | 6.165B | 4.478B | 3.352B | 3.548B | 3.07B | 2.906B | 2.962B | 2.958B | 2.799B | 2.474B | 2.326B | 2.246B |
| Net profit | 1.056B | 748.155M | 593.383M | 1.039B | 1.197B | 734.671M | 439.416M | 500.27M | 303.292M | 279.939M | 303.451M | 257.051M | 177.217M | 31.18M | 57.496M | 129.888M |
| Figure | FY 2025 | FY 2024 | FY 2023 | FY 2022 | FY 2021 | FY 2020 | FY 2019 | FY 2018 | FY 2017 | FY 2016 | FY 2015 | FY 2014 | FY 2013 | FY 2012 | FY 2011 | FY 2010 |
|---|---|---|---|---|---|---|---|---|---|---|---|---|---|---|---|---|
| Share price | 146.5 | — | — | — | — | — | — | — | — | — | — | — | — | — | — | — |
| P/S | 2.45 | — | — | — | — | — | — | — | — | — | — | — | — | — | — | — |
Sign up to see institutional holdings
Sign UpPodcast Mentions
Sign up to see podcast mentions and sentiment
Sign UpMaterial information published on MOPS, newest first, subjects as filed in Chinese, guarantee and loan balance notices and routine equipment purchases included. The link opens the company's material information on MOPS. Press releases from the company's own website, newest first.
 |

 |
 |


 |
Prompts
Click prompts to add them under the company line, click again to take one out, then copy the result into your AI chat. Shared by Asian Century Stocks and Uncovered Thai Stocks. Thank you.
TAI-TECH Advanced Electronics Co., Ltd. (ticker 3357.TWO), listed in Taiwan.
Copied
ETFs Holding TAI-TECH Advanced Electronics Co., Ltd.
Exchange-traded funds whose newest published daily portfolio holds one of the company's listings, largest weight first.
| ETF | Weight in ETF | Shares | Market value | As of |
|---|---|---|---|---|
| AVEE | 0.03% | 7,000 | $ 34.259K | Nov 16, 2026 |
| DFEV | 0.01% | 54,578 | $ 280.592K | Nov 12, 2026 |
| DEXC | 0.01% | 6,000 | $ 30.847K | Nov 12, 2026 |
| DFEM | 0.01% | 202,000 | $ 1.039M | Nov 12, 2026 |
| AVSE | 0.01% | 3,000 | $ 14.682K | Nov 16, 2026 |
| DFAE | 0.00% | 68,000 | $ 349.596K | Nov 12, 2026 |
| DFAX | 0.00% | 58,000 | $ 298.185K | Nov 12, 2026 |
| AVEM | 0.00% | 15,000 | $ 73.412K | Nov 16, 2026 |
| AVES | 0.00% | 9,000 | $ 44.047K | Nov 16, 2026 |
| AVXC | 0.00% | 1,000 | $ 4,894.14 | Nov 16, 2026 |