公告本公司國內第六次無擔保轉換公司債收足應募價款
Bull 0
Bear 0
Financing
3289.TWO
|
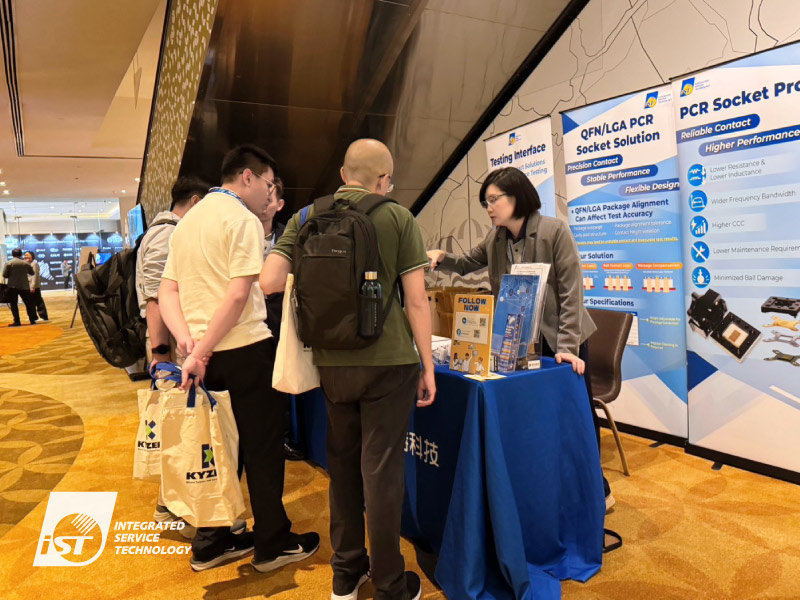
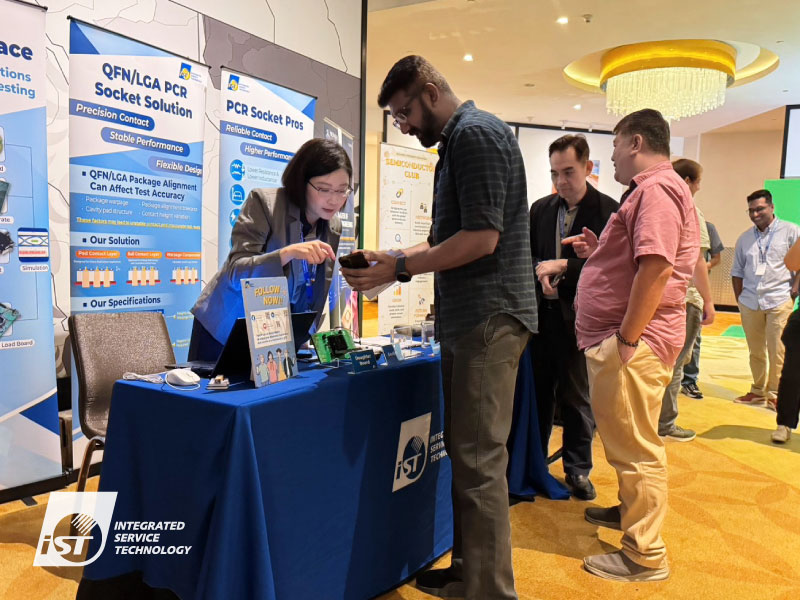
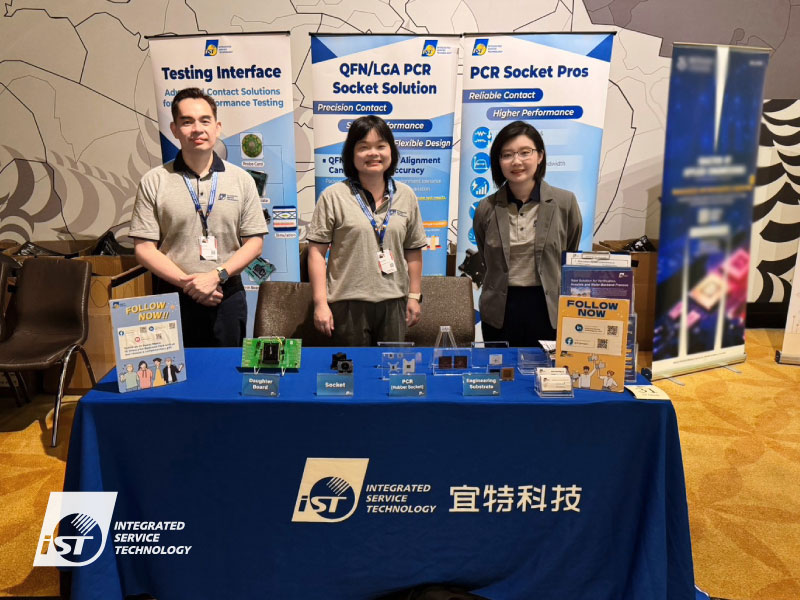
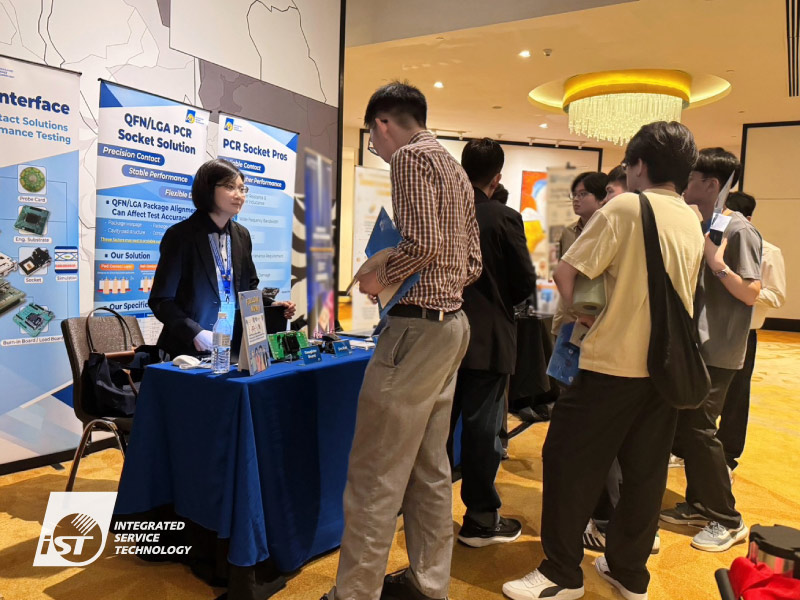
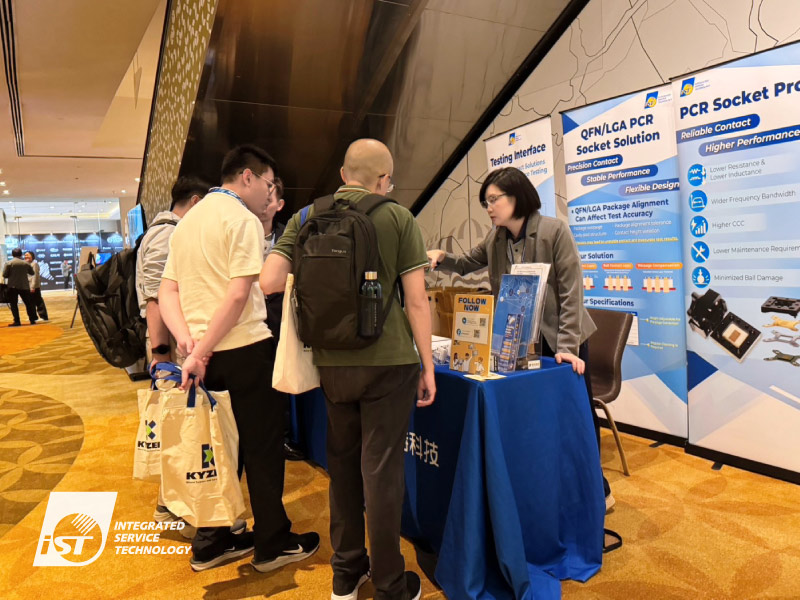
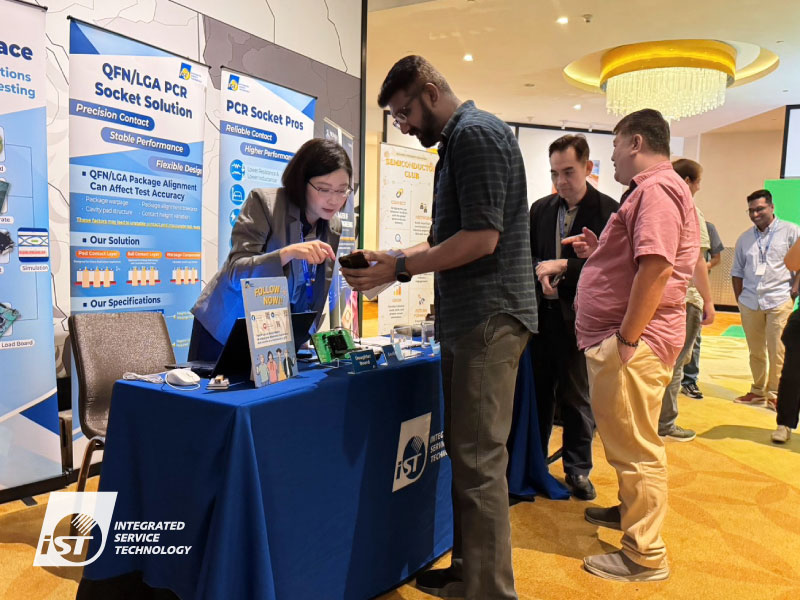
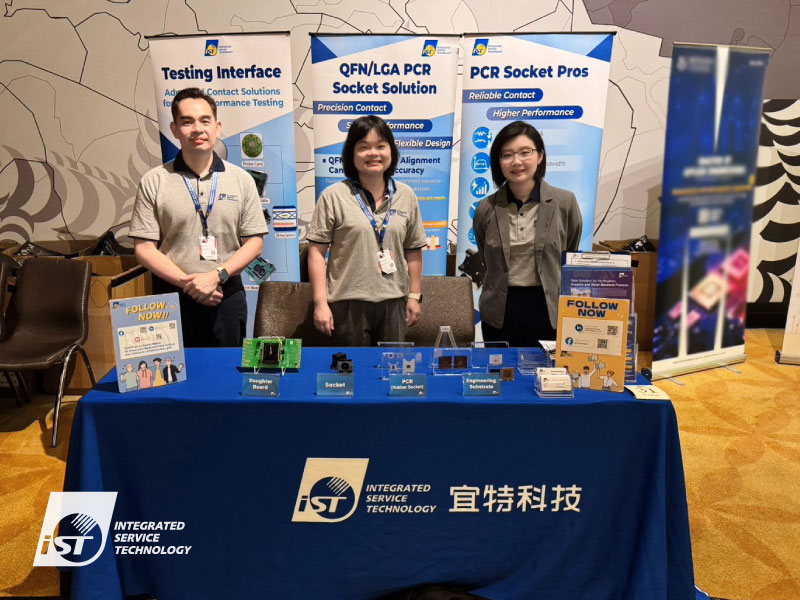
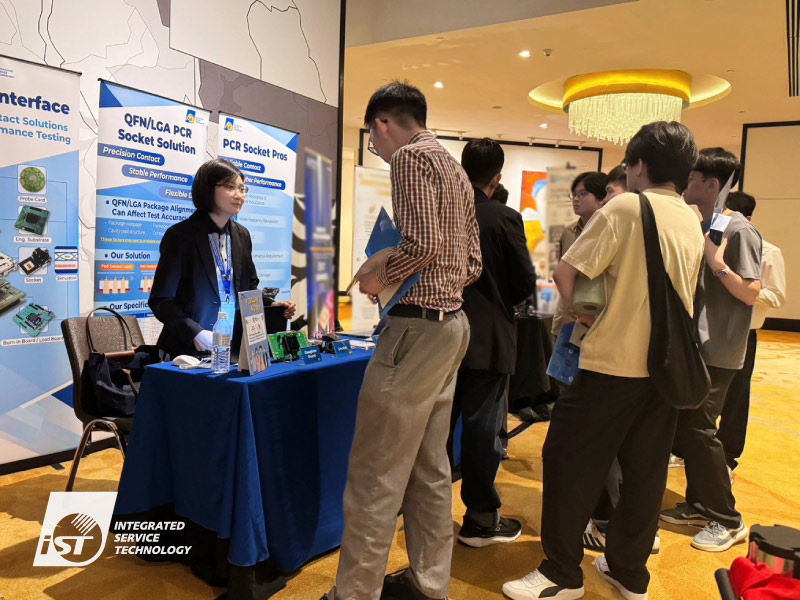
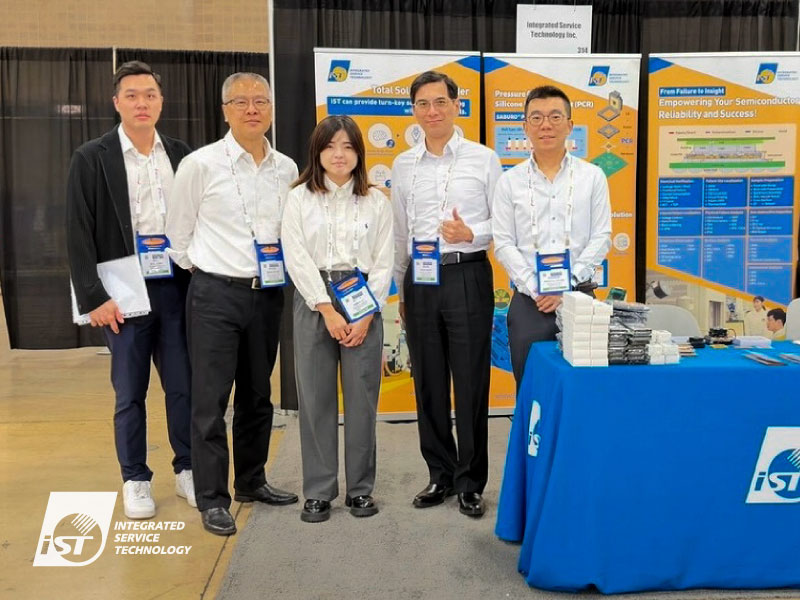
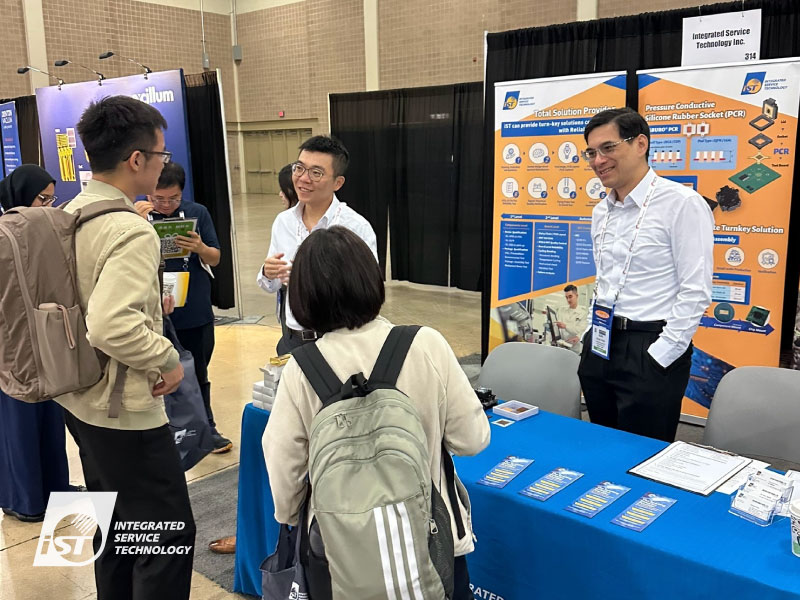
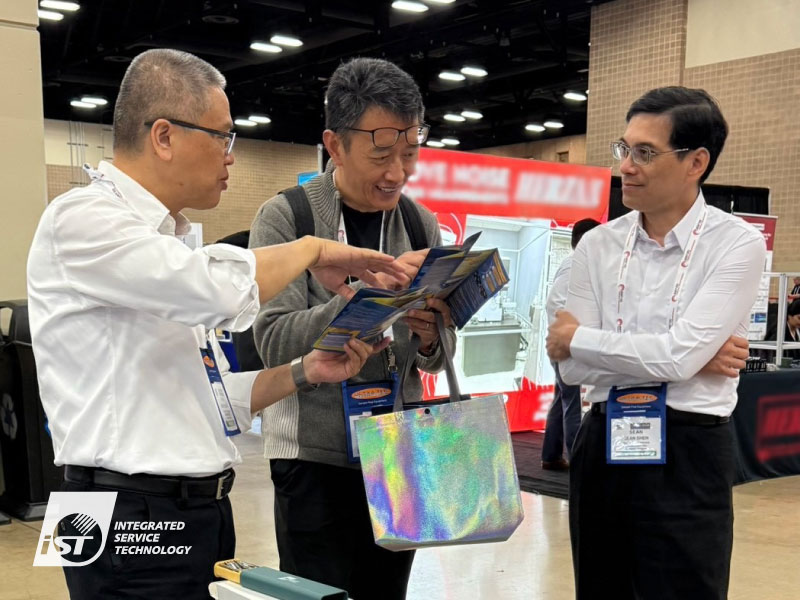
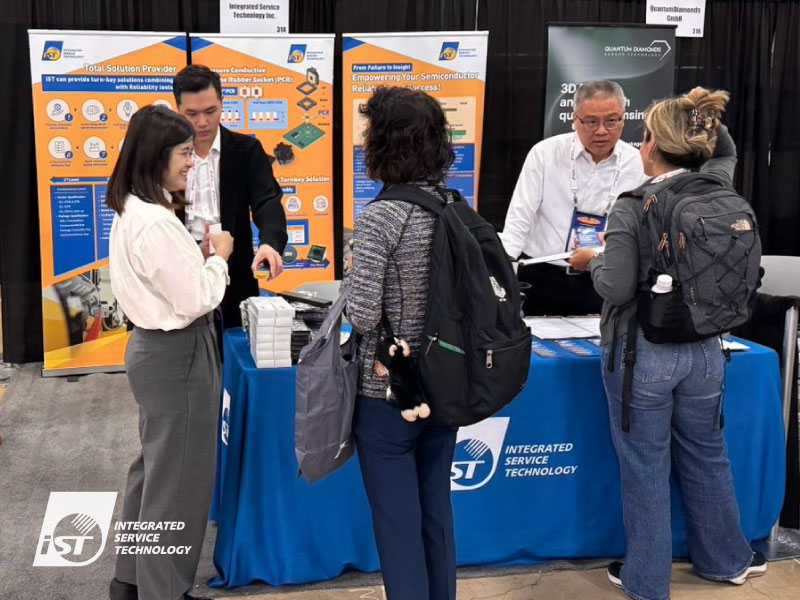
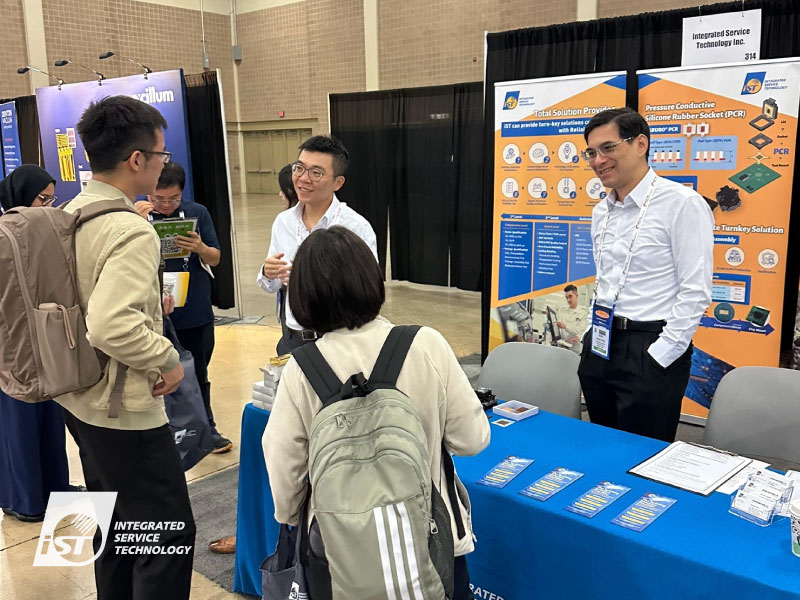
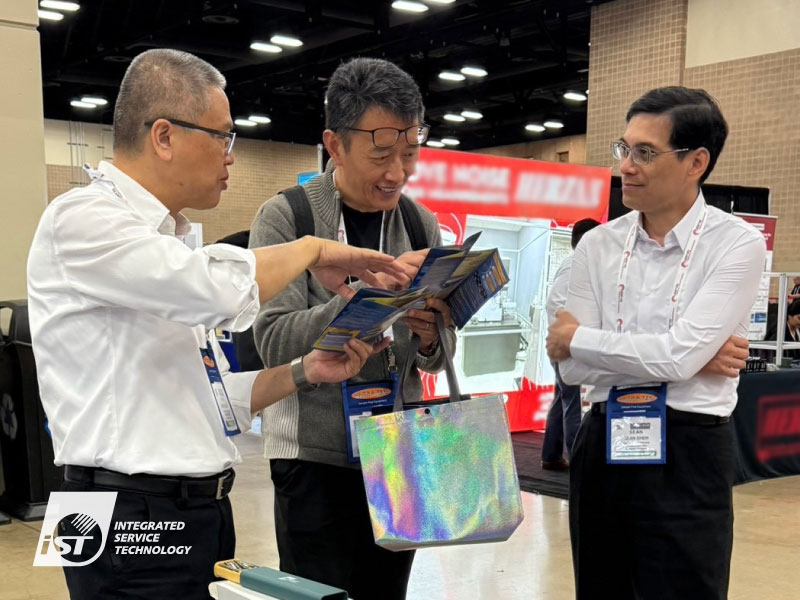
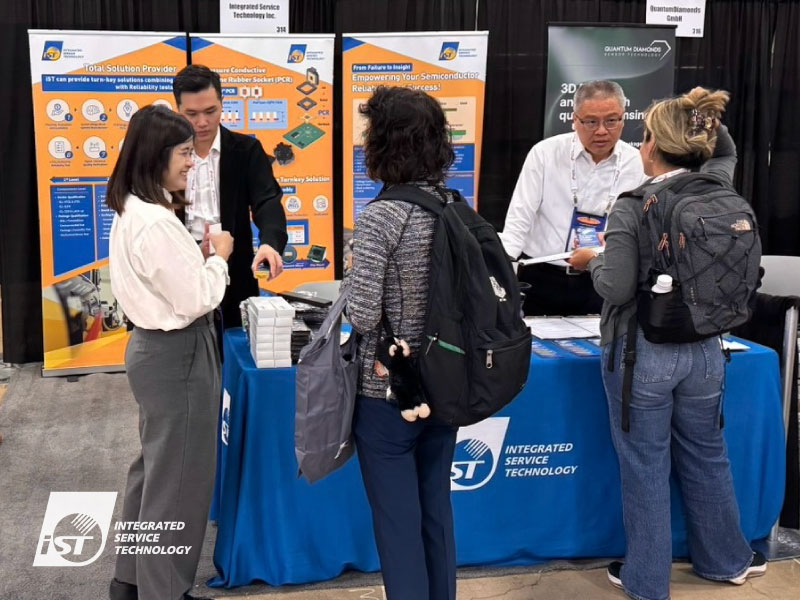
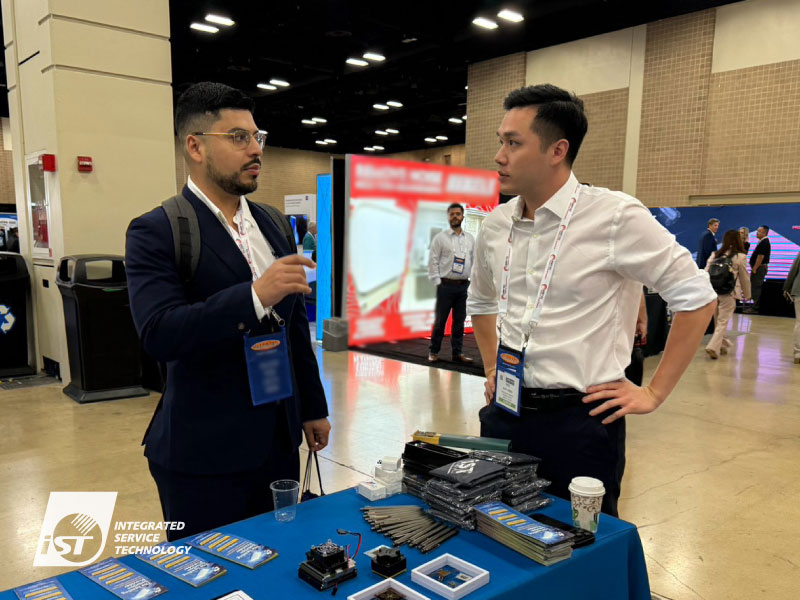
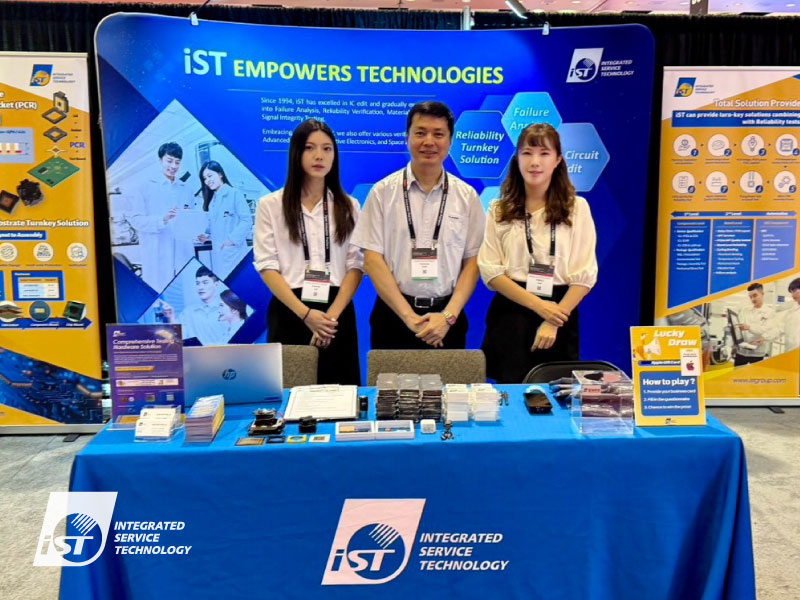
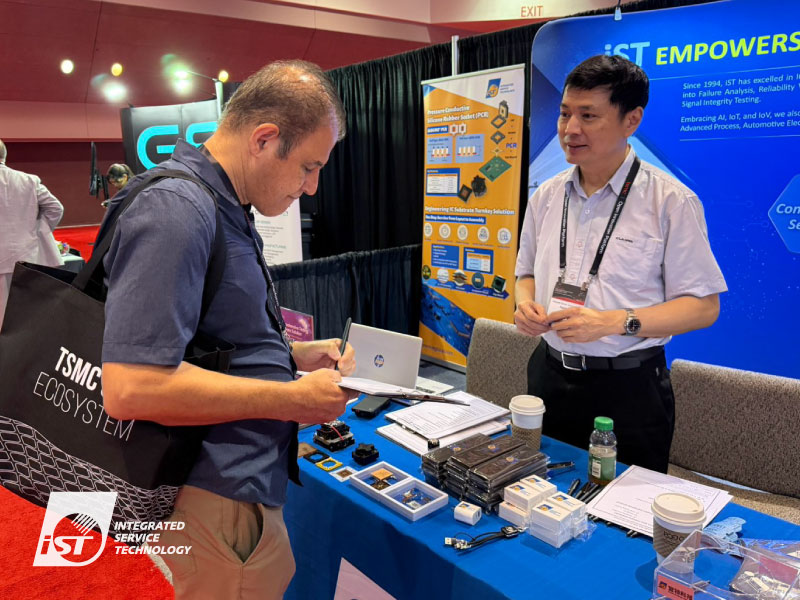
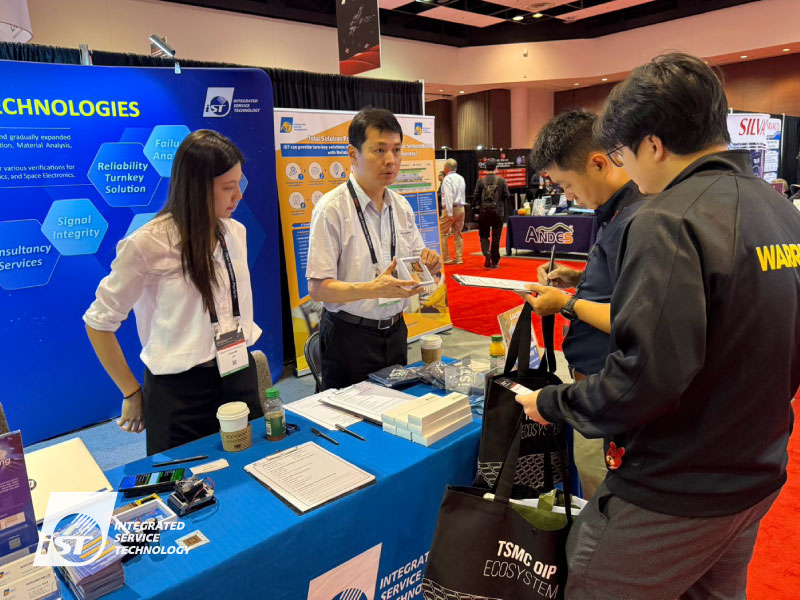
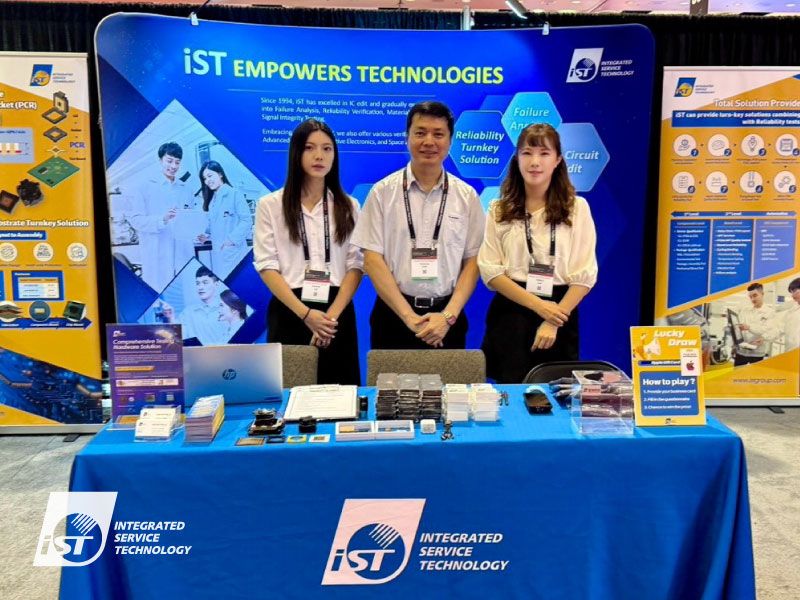
Integrated Service Technology Inc. is a third-party verification and analysis laboratory serving the electronics and semiconductor industries. Founded in 1994, the company provides IC circuit modification using focused ion beam (FIB) technology, failure analysis, reliability verification, material analysis, chemical and process micro-contamination analysis, and signal testing. Its services support IC debugging, quality assurance, and product development acceleration for clients in the semiconductor, automotive electronics, and AI technology sectors. The company operates through subsidiaries including iST Jinyi Technology, which focuses on power discrete component wafer back-end process integration, and Dekra iST, a joint venture with DEKRA providing reliability verification for automotive, LED, and medical electronics. It also offers engineering data analysis systems through Yifang Technology. Integrated Service Technology serves customers across Asia and maintains operations in the United States and China, with facilities in Hsinchu Science Park and other locations in Taiwan. Summarised from the company's own disclosures, fiscal year ended Oct 2026 |
Industry Diagnostics & Research | Homepage istgroup.com |
| Sector Healthcare | IR page istgroup.com/tw/investors | |
|
Tags
semiconductor testing, failure analysis, reliability verification, material analysis, focused ion beam, automotive electronics, signal testing, wafer back-end process, medical electronics, led verification, iST Jinyi Technology, Dekra iST, Yifang Technology, FIB, FA, RA, MA, InGaAs, OBIRCH, Thermal EMMI, QDm, CoWoS, EMIB, SoIC, HDMI, MHL, USB Type-C, USB PD, Dr. MOS, IGBT
|
Press page — |
Metrics
| Valuation | |
|---|---|
| Market cap | NT$ 8.457B |
| Market cap (USD) | $ 256.687M |
| P/E | 20.53 |
| PEG | — |
| P/BV | 1.80 |
| P/S | 1.83 |
| P/OCF | 6.18 |
| P/FCF | — |
| Dividend yield | — |
| Turnover / mcap | — |
| Returns | |
|---|---|
| ROE | 9.1% |
| ROI | 7.9% |
| ROIC | 6.0% |
| Profit margin | 7.6% |
| Growth | |
|---|---|
| Revenue growing | Yes |
| Profits growing | No |
| Revenue up 3y | Yes |
| Revenue up 5y | Yes |
| Earnings growth 3y (net profit CAGR) | -3.2% |
| Quality | |
|---|---|
| Profitable | Yes |
| Margin expanding | No |
| Buying back stock | No |
| Diluting (TTM) | Yes |
| Debt/Equity | — |
| Podcast bulls (TTM) | Sign up |
| Podcast bears (TTM) | Sign up |
| Podcast sentiment (TTM) | Sign up |
| Podcast sentiment % (TTM) | Sign up |
| News sentiment (TTM) | 0 |
| Quality score | 12.5% |
| Insiders | |
|---|---|
| Buys, 1w | Sign up |
| Buys, 1m | Sign up |
| Buys, 1y | Sign up |
| Sells, 1w | Sign up |
| Sells, 1m | Sign up |
| Sells, 1y | Sign up |
Sign up to see this company's insider trades
| Figure | FY 2025 | FY 2024 | FY 2023 | FY 2022 | FY 2021 | FY 2020 | FY 2019 | FY 2018 | FY 2017 | FY 2016 | FY 2015 | FY 2014 | FY 2013 | FY 2012 | FY 2011 | FY 2010 |
|---|---|---|---|---|---|---|---|---|---|---|---|---|---|---|---|---|
| Revenue | 4.843B | 4.346B | 3.812B | 3.743B | 3.214B | 3.043B | 2.52B | 3.023B | 2.824B | 2.344B | 2.02B | 1.843B | 1.634B | 1.51B | 1.427B | 1.389B |
| Net profit | 367.079M | 481.739M | 385.554M | 405.146M | 179.708M | 262.069M | 76.927M | -189.798M | 190.691M | 231.116M | 325.425M | 218.917M | 88.431M | 77.361M | 146.73M | 71.022M |
| Figure | FY 2025 | FY 2024 | FY 2023 | FY 2022 | FY 2021 | FY 2020 | FY 2019 | FY 2018 | FY 2017 | FY 2016 | FY 2015 | FY 2014 | FY 2013 | FY 2012 | FY 2011 | FY 2010 |
|---|---|---|---|---|---|---|---|---|---|---|---|---|---|---|---|---|
| Share price | 115 | — | — | — | — | — | — | — | — | — | — | — | — | — | — | — |
| P/S | 2.05 | — | — | — | — | — | — | — | — | — | — | — | — | — | — | — |
Sign up to see institutional holdings
Sign UpPodcast Mentions
Sign up to see podcast mentions and sentiment
Sign UpMaterial information published on MOPS, newest first, subjects as filed in Chinese, guarantee and loan balance notices and routine equipment purchases included. The link opens the company's material information on MOPS. Press releases from the company's own website, newest first.





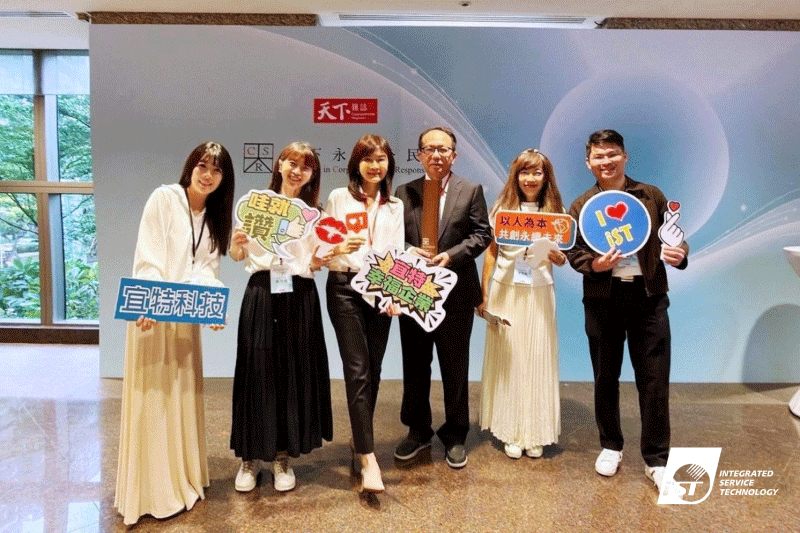
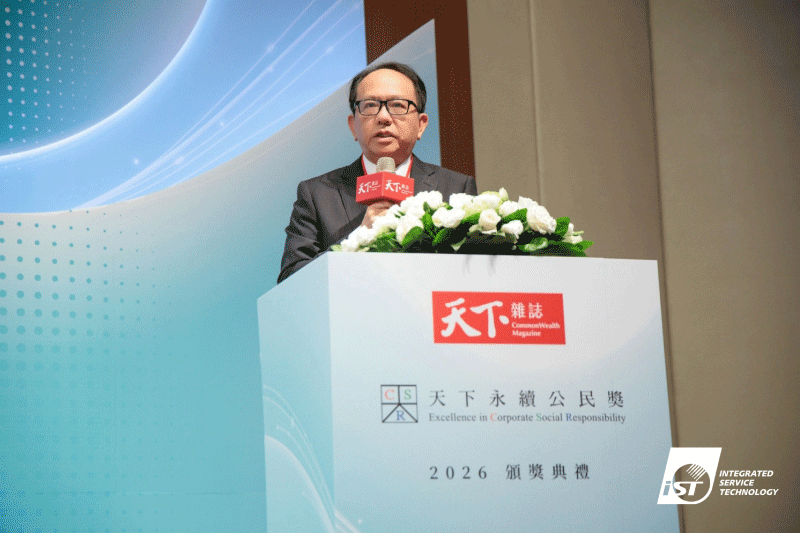
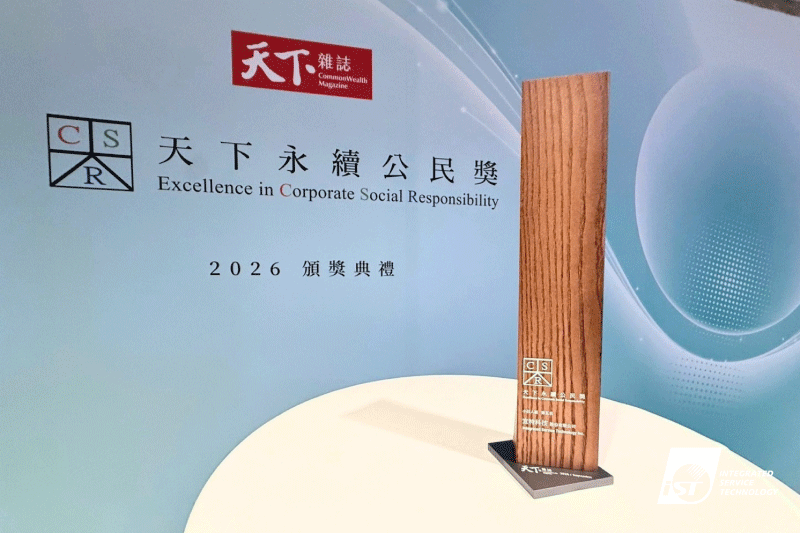
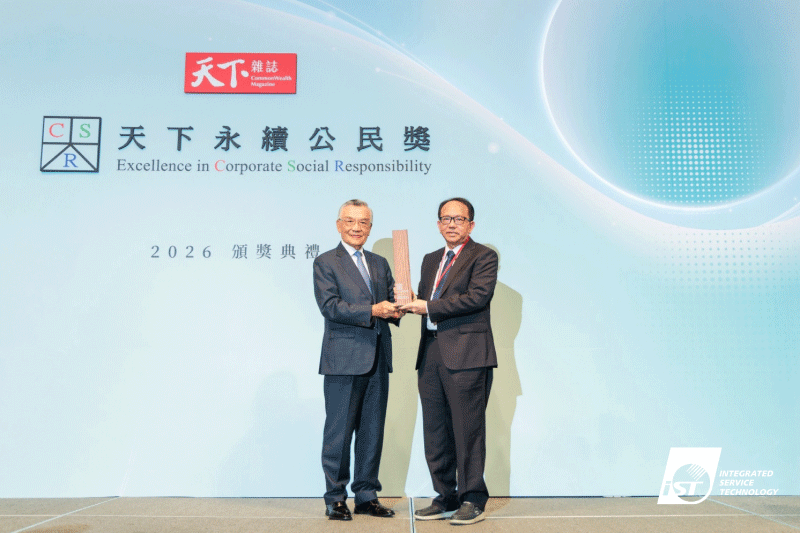
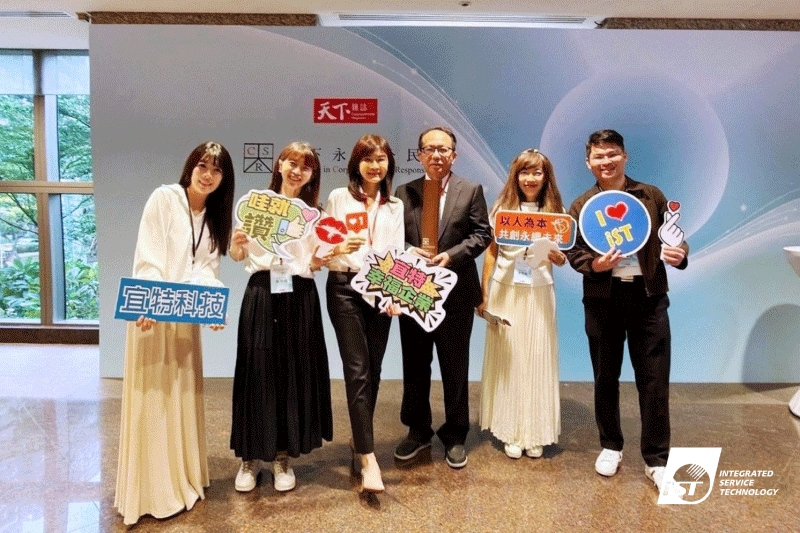
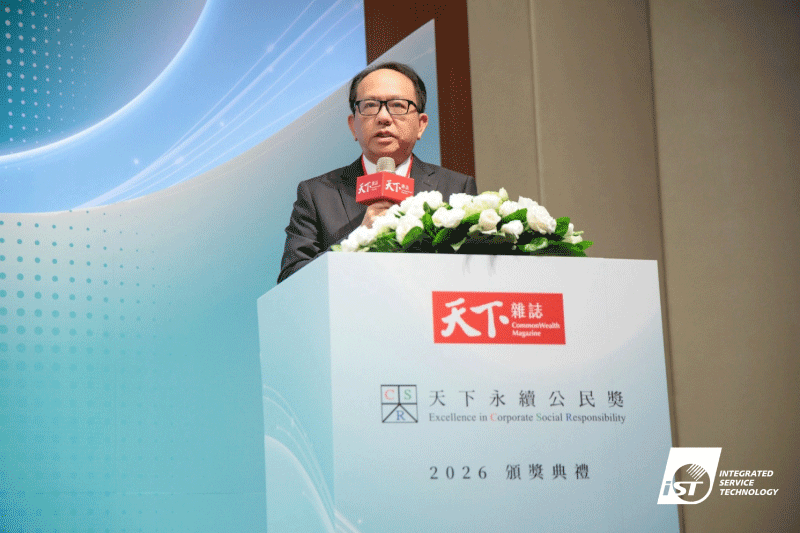
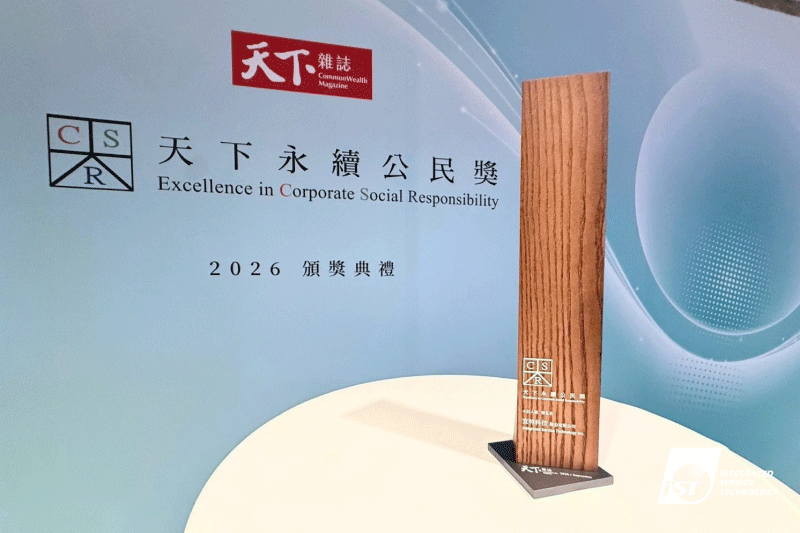
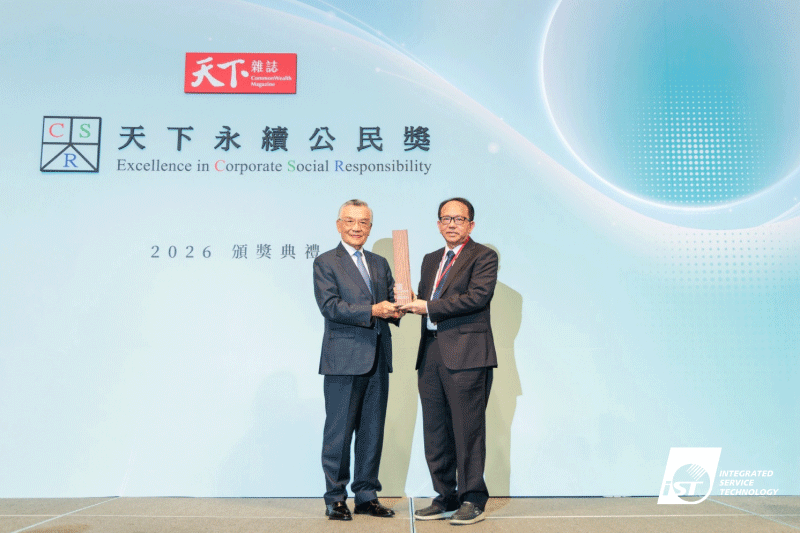



Prompts
Click prompts to add them under the company line, click again to take one out, then copy the result into your AI chat. Shared by Asian Century Stocks and Uncovered Thai Stocks. Thank you.
Integrated Service Technology Inc. (ticker 3289.TWO), listed in Taiwan.
Copied
ETFs Holding Integrated Service Technology Inc.
Exchange-traded funds whose newest published daily portfolio holds one of the company's listings, largest weight first.
| ETF | Weight in ETF | Shares | Market value | As of |
|---|---|---|---|---|
| AVEE | 0.02% | 6,644 | $ 21.343K | Nov 16, 2026 |
| AVES | 0.01% | 23,965 | $ 76.985K | Nov 16, 2026 |
| AVXC | 0.01% | 10,386 | $ 33.364K | Nov 16, 2026 |
| DFSE | 0.01% | 16,000 | $ 55.809K | Nov 12, 2026 |
| DEXC | 0.01% | 6,773 | $ 23.625K | Nov 12, 2026 |
| DFEV | 0.01% | 35,490 | $ 123.792K | Nov 12, 2026 |
| DFEM | 0.01% | 138,734 | $ 483.914K | Nov 12, 2026 |
| DFAE | 0.00% | 63,736 | $ 222.316K | Nov 12, 2026 |
| DFAX | 0.00% | 73,382 | $ 255.962K | Nov 12, 2026 |
| AVEM | 0.00% | 275,724 | $ 885.737K | Nov 16, 2026 |
| AVSE | 0.00% | 2,257 | $ 7,250.40 | Nov 16, 2026 |