2026 29 Oct 2026 5 mins read You are now reading: Artwork exploring grid structure and repetition wins the 2026 UOB Southeast Asian Painting of the Year Award Share this Download PDF Mr Wee Ee Cheong, Deputy Chairman and Chief Executive Officer,…
-
2026
-
29 Oct 2026
-
5 mins read

You are now reading:
Artwork exploring grid structure and repetition wins the 2026 UOB Southeast Asian Painting of the Year Award
Share this
Download PDF
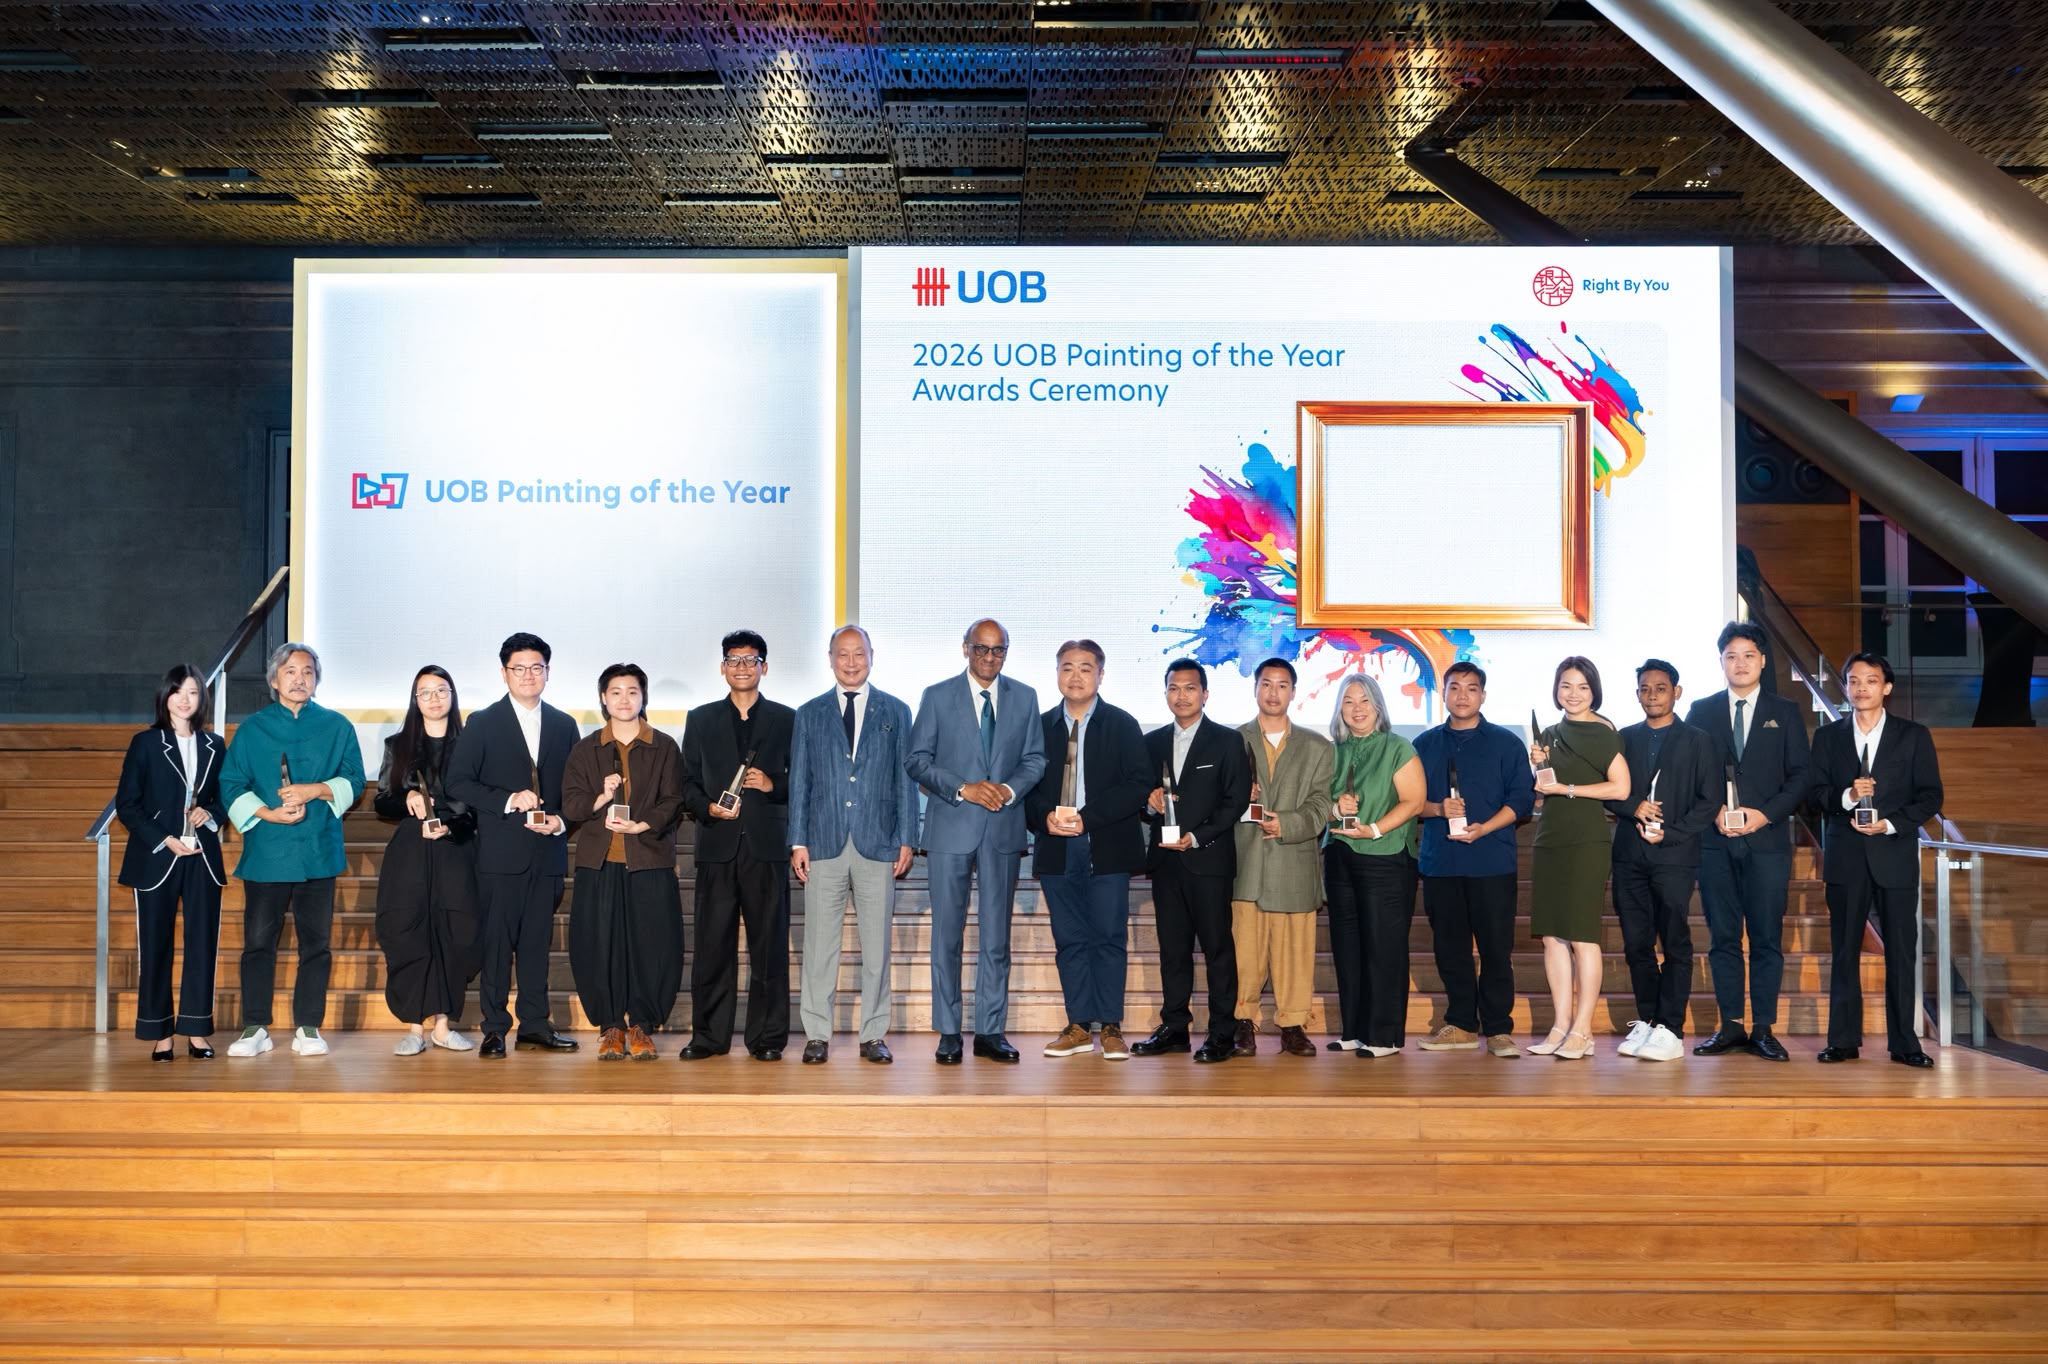
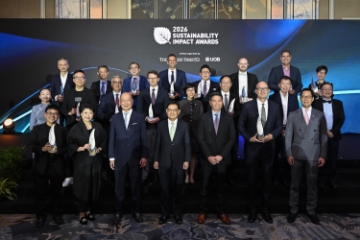
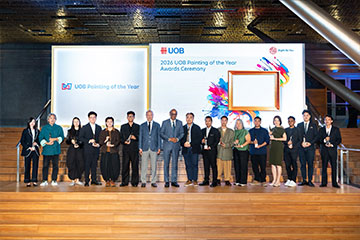
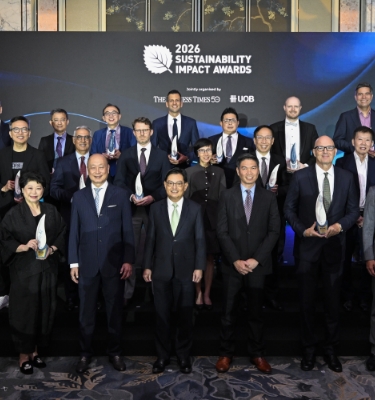
Mr Wee Ee Cheong, Deputy Chairman and Chief Executive Officer, UOB (centre left) and President Tharman Shanmugaratnam (centre right) with the Singapore and regional winners at the 2026 UOB Painting of the Year Awards Ceremony.
UOB and NAC deepen partnership to grow Southeast Asian artistic talent and strengthen Singapore as a regional arts hub
Singapore, 28 October 2026 – Mr Tang Kok Soo’s artwork, “A Big Flower”, which explores the relationship between centre and deviation, and reality and perception, has clinched both the prestigious UOB Southeast Asian Painting of the Year (SEA POY) award and the 2026 UOB Painting of the Year (Singapore) award. The 51-year-old artist from Singapore will compete with the four other UOB POY country winners for a UOB-sponsored overseas art residency programme at Cité Internationale des Arts in Paris.
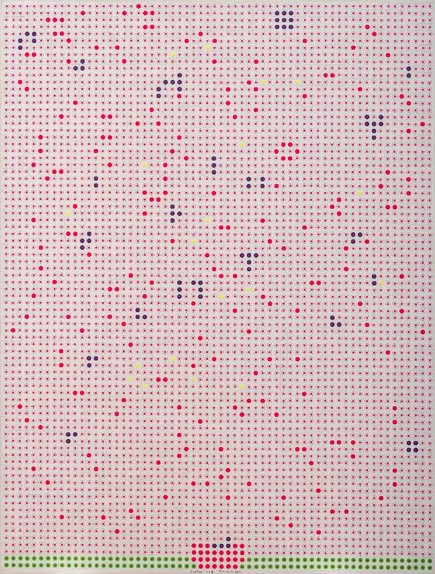
2026 UOB Southeast Asian Painting of the Year, “A Big Flower” by Mr Tang Kok Soo
Mr Tang had previously clinched the Gold Award in the 2016 UOB POY (Singapore) Established Artist category for his artwork, Elephants Crossing the Water. Inspired by geometric structures and the concept that the greatest forms transcend fixed definition, the mixed-media on paper (graphite ink and collage) artwork explores the relationship between centre and deviation, reality and perception. Composed of countless loving hearts, each radiating its own halo, the artwork depicts a monumental flower emerging from a single flowerpot, which becomes an endless field of light, energy, and unity.
The artist came to understand the creative process behind grid structures as a form of meditative painting, where repeatedly returning to a single point of attention generates a sense of energy, vitality and light. Built on grids and repetition, the artwork is a deeply personal reflection on the inner, spiritual and meditative dimensions of artistic practice.
The 2026 Southeast Asian and Singapore winners were announced this evening at the 2026 UOB POY Awards Ceremony and Exhibition, held at National Gallery Singapore. The Awards Ceremony was graced by President Tharman Shanmugaratnam. The winning artists from Singapore, Indonesia, Malaysia, Thailand and Vietnam attended the ceremony alongside past winners, distinguished guests and members from the arts community.
Now in its 45th year, the UOB Painting of the Year competition has uncovered more than 1,000 artists across Southeast Asia, many of whom have gone on to build successful artistic careers and become some of the region’s most respected artists. Seven UOB POY alumni artists such as Mr Goh Beng Kwan (1982 winner), the late Mr Anthony Poon (1983 winner) and the late Mr Chua Ek Kay (1991 winner) have gone on to receive the Singapore Cultural Medallion. Their achievements underscore the competition's lasting impact in nurturing artistic talent.
UOB and NAC deepen partnership to strengthen the arts ecosystem in Singapore and Southeast Asia
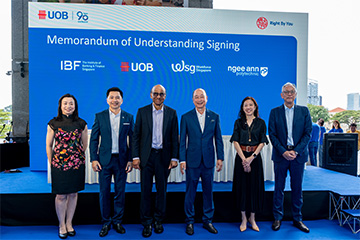
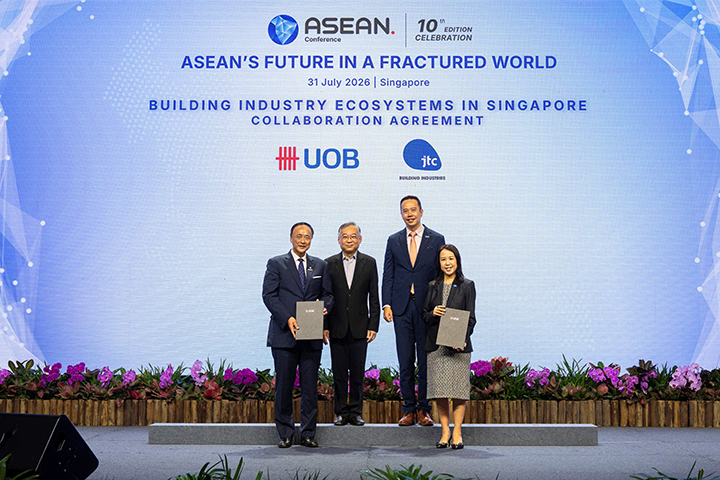
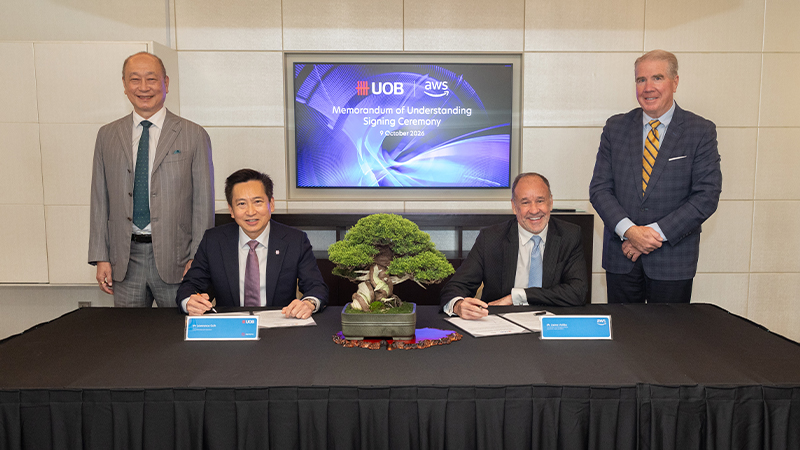
In conjunction with the Awards Ceremony and Exhibition, UOB and National Arts Council (NAC) also signed a three-year Memorandum of Understanding (MOU) prior to the Awards Ceremony, a continuation of the first MOU signed in 2022, to strengthen the arts ecosystem in Singapore and Southeast Asia. UOB will commit S$5 million to NAC’s Sustain the Arts (stART) Fund, reinforcing its long-term commitment to supporting the arts in Singapore and Southeast Asia. The partnership aims to support artistic development and regional exchange through professional development opportunities for artists and curators from Singapore and the region, and showcase Southeast Asian art. More details on the MOU can be found in Annex A.
Mr Wee Ee Cheong, Deputy Chairman and Chief Executive Officer, UOB, said, “We believe supporting the arts goes beyond recognising artistic excellence. It is also about creating opportunities for artists to grow and realise their potential. Many UOB Painting of the Year artists have gone on to make meaningful contributions to the arts and wider community through their work. Our renewed partnership with NAC will enable us to do more to support artists and strengthen cultural connections across ASEAN. UOB will continue to support artists and contribute to a vibrant arts ecosystem across Southeast Asia.”
“UOB has a longstanding commitment to championing the arts, nurturing talent, and bringing art to more people. We share a common belief in the power of the arts to inspire, connect, and enrich lives. We are excited to build on our partnership to help more Singapore artists to grow, showcase their works, and connect with audiences across the region. We hope this will inspire more businesses to step forward, support our artists, and play a part in growing a vibrant arts scene,” said Mrs Elaine Ng, Chief Executive Officer, NAC.
Artwork exploring memory, identity and belonging clinches 2026 Most Promising Artist of the Year (Singapore) award
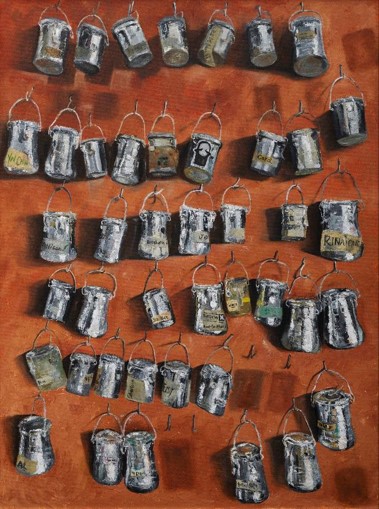
2026 Most Promising Artist of the Year (Singapore), Emerging Artist Category – “Echoes of Belongings” by Ms Wong Yik Knee
Ms Wong Yik Knee was awarded the 2026 Most Promising Artist of the Year (Singapore) under the Emerging Artist Category for her artwork, “Echoes of Belongings”. Composed using oil on canvas, the artwork by the 50-year-old artist transforms a collection of worn containers marked with individual names into quiet records of human presence and reflects on the stories, memories and traces embedded within everyday objects. Each container bears the marks of use and time, revealing a unique history while reflecting a wider community of shared experiences.
Through the artwork, the artist explores themes of memory, identity and belonging. The title refers both to the lingering traces of lives lived and relationships formed, and to the human desire for connection and a sense of place. The names inscribed on the containers serve as reminders that even the most ordinary objects can carry personal stories, inviting viewers to reflect on the lives and memories they embody.
The 2026 UOB POY Regional Winners’ Showcase will be held at National Gallery Singapore, Level B1, Supreme Court Wing, Concourse Gallery from 1 November 2026 to 31 January 2027, open from 10am to 7pm daily. The winning artworks can also be viewed on UOBandArt.com.
About UOB and Art
UOB’s involvement in art started in the 1970s with its collection of paintings by Singapore artists. Today, the UOB Art Collection comprises more than 3,000 artworks by established and emerging artists from Southeast Asia, Hong Kong SAR and Mainland China.
The Bank’s flagship art programme is the UOB Painting of the Year competition, established in Singapore in 1982 and extended to Indonesia, Malaysia, Thailand and in 2023, to Vietnam. Today, the art competition is the longest-running in Singapore and one of most prestigious in Southeast Asia.
Over the past four decades, the competition has helped launch and advance the careers of many artists , including Singapore Cultural Medallion recipients Mr Goh Beng Kwan (1982 winner) the late Mr Anthony Poon (1983 winner) and the late Mr Chua Ek Kay (1991 winner).
In Hong Kong SAR and Mainland China, UOB organises the UOB Art in Ink Awards concurrently to promote and support Chinese ink art as a distinct art form and representation of Chinese culture.
UOB also supports the UOB Art Academy, a Hong Kong-registered charity dedicated to advancing arts education, nurturing artistic talent and broadening community access to the arts. Its annual signature programme, the award-winning UOB Art in Ink Festival, promotes the appreciation of Chinese ink art through exhibitions, workshops and community initiatives. Through The Bridge+ UOB Art Academy, it also connects artists, businesses and community partners to foster cross-sector collaboration and deepen community engagement through the arts.
As a leading patron of the arts, UOB continues to make art accessible to a wider audience through a diverse range of visual art programmes, partnerships and community outreach across the region.
UOB supports artists by providing platforms for international exposure and market access. The Bank is a lead sponsor of major art fairs across the region, including Art Central Hong Kong, ART KL in Malaysia, Art Bangkok in Thailand and FutureLab in Mainland China. The bank also operates UOB Art Gallery at UOB Plaza Shanghai, a dedicated space that engages with local community though Southeast Asian and Chinese ink art.
The Bank also brings art into everyday spaces through initiatives such as Green Mosaic, where UOB Painting of the Year artists collaborate with residents and students to co-create murals inspired by community stories and sustainability themes in Singapore.
UOB has further extended the reach of art through UOB Artbeat, its inaugural arts festival that makes art accessible and engaging for all. Through exhibitions, workshops, talks and hands-on experiences, the festival creates opportunities for communities to discover, create and connect through art.
In recognition of its longstanding commitment to the arts, UOB received the Singapore National Arts Council's Distinguished Patron of the Arts Award for the 24th time in 2026.
About UOB
UOB is a leading bank in Asia. Operating through its head office in Singapore and banking subsidiaries in China, Indonesia, Malaysia, Thailand and Vietnam, UOB has a global network of more than 470 offices in 19 markets in Asia Pacific, Europe and North America. Since its incorporation in 1935, UOB has grown organically and through a series of strategic acquisitions. Today, UOB is rated among the world’s top banks: Aa1 by Moody’s Investors Service and AA- by both S&P Global Ratings and Fitch Ratings.
For nine decades, UOB has adopted a customer-centric approach to create long-term value by staying relevant through its enterprising spirit and doing right by its customers. UOB is focused on building the future of ASEAN – for the people and businesses within, and connecting with, ASEAN.
The Bank connects businesses to opportunities in the region with its unparalleled regional footprint and leverages data and insights to innovate and create personalised banking experiences and solutions catering to each customer’s unique needs and evolving preferences. UOB is also committed to help businesses forge a sustainable future, by fostering social inclusiveness, creating positive environmental impact and pursuing economic progress. UOB believes in being a responsible financial services provider and is steadfast in its support of art, social development of children and education, doing right by its communities and stakeholders.
Related articles

04 May 2026 • 5 MINS READ
12 Nov 2025 •
08 May 2025 •
Close 
Popular Searches
[
Annual and Sustainability Reports](https://www.uobgroup.com/investor-relations/financial/group-annual-reports.html)[
UOB Sustainability](https://www.uobgroup.com/sustainability/index.page)[
UOB Painting of the Year](https://www.uobgroup.com/uobandart/uncovering-talent/uob-painting-of-the-year.html)
[








 About Us