|
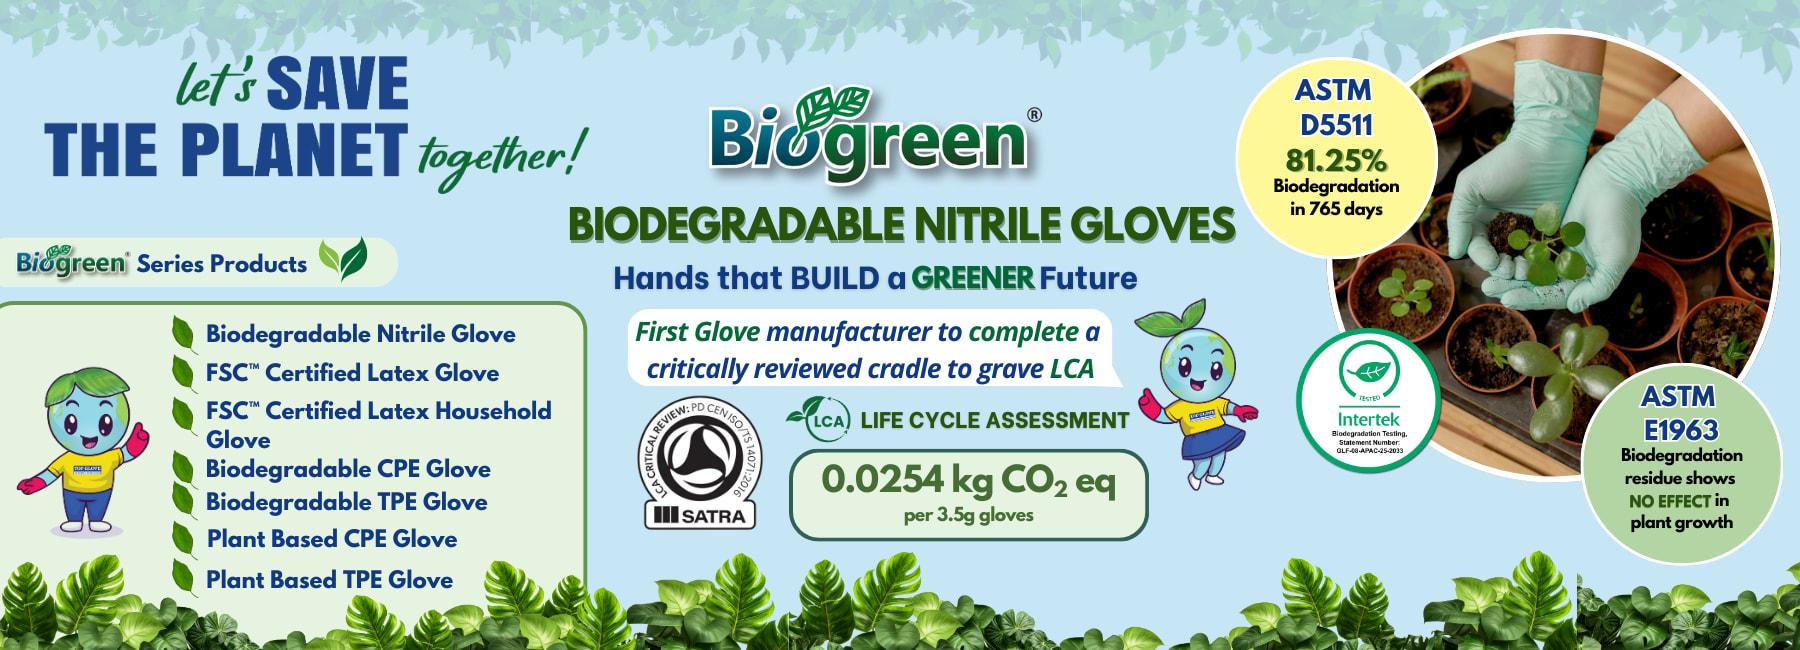
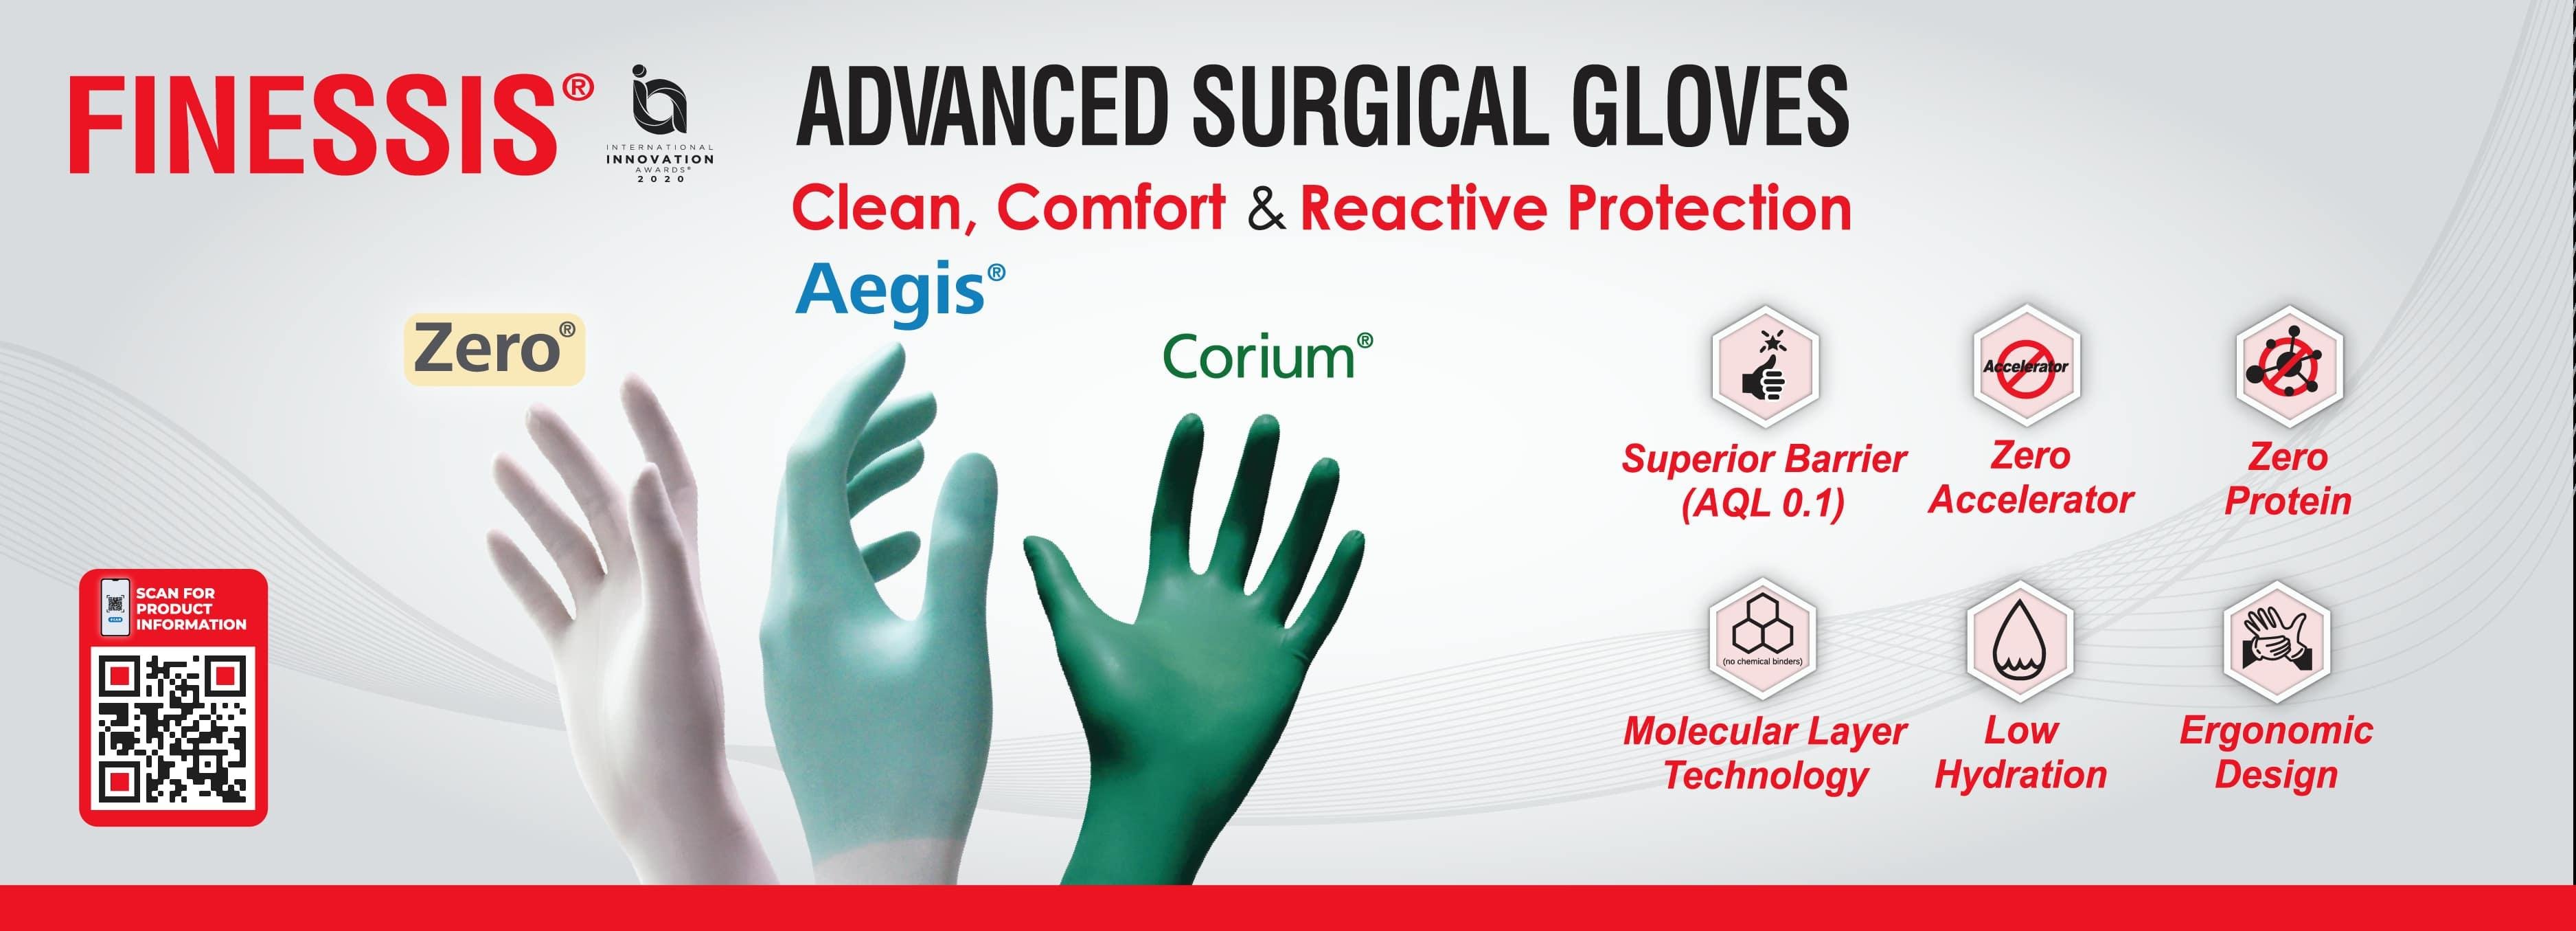
Top Glove Corporation Bhd is a manufacturer of disposable rubber gloves and related healthcare products. The company produces nitrile, natural latex, vinyl, surgical, and cleanroom gloves, along with non-glove items such as condoms, face masks, and exercise bands. Established in 1991, the group operates manufacturing facilities in Malaysia, Thailand, and Vietnam, serving customers globally. Top Glove supplies products for healthcare, industrial, and general applications, positioning itself as a comprehensive sourcing center for protective equipment. Summarised from the company's own disclosures, fiscal year ended Aug 2026 |
Industry Medical Instruments & Supplies | Homepage topglove.com |
| Sector Healthcare | IR page topglove.com/home | |
|
Tags
disposable gloves, nitrile gloves, latex gloves, vinyl gloves, surgical gloves, cleanroom gloves, healthcare products, industrial safety, protective equipment, condoms, face masks
|
Press page — |
Metrics
| Valuation | |
|---|---|
| Market cap | S$ 2.424B |
| Market cap (USD) | $ 1.88B |
| P/E | 24.52 |
| PEG | — |
| P/BV | 1.55 |
| P/S | 1.83 |
| P/OCF | 14.66 |
| P/FCF | — |
| Dividend yield | — |
| Turnover / mcap | — |
| Returns | |
|---|---|
| ROE | 6.3% |
| ROI | 6.1% |
| ROIC | 8.1% |
| Profit margin | 7.3% |
| Growth | |
|---|---|
| Revenue growing | Yes |
| Profits growing | Yes |
| Revenue up 3y | Yes |
| Revenue up 5y | No |
| Earnings growth 3y (net profit CAGR) | — |
| Quality | |
|---|---|
| Profitable | Yes |
| Margin expanding | Yes |
| Buying back stock | No |
| Diluting (TTM) | No |
| Debt/Equity | 0.78% |
| Podcast bulls (TTM) | Sign up |
| Podcast bears (TTM) | Sign up |
| Podcast sentiment (TTM) | Sign up |
| Podcast sentiment % (TTM) | Sign up |
| News sentiment (TTM) | 0 |
| Quality score | 18.8% |
| Insiders | |
|---|---|
| Buys, 1w | Sign up |
| Buys, 1m | Sign up |
| Buys, 1y | Sign up |
| Sells, 1w | Sign up |
| Sells, 1m | Sign up |
| Sells, 1y | Sign up |
Sign up to see this company's insider trades
| Figure | FY 2026 | FY 2025 | FY 2024 | FY 2023 | FY 2022 | FY 2021 | FY 2020 | FY 2019 | FY 2018 | FY 2017 | FY 2016 | FY 2015 |
|---|---|---|---|---|---|---|---|---|---|---|---|---|
| Revenue | 4.232B | 3.489B | 2.516B | 2.257B | 5.572B | 16.403B | 7.236B | 4.802B | 4.214B | 3.409B | 2.889B | 2.511B |
| Net profit | 307.962M | 109.067M | -61.809M | -925.218M | 275.728M | 7.871B | 1.867B | 370.564M | 433.618M | 332.704M | 361.051M | 279.781M |
Sign up to see institutional holdings
Sign UpPodcast Mentions
Sign up to see podcast mentions and sentiment
Sign UpAnnouncements made on SGXNet, newest first, routine notices (disclosures of interest, daily buy-backs, listing confirmations, coupons) included. The link opens the announcement on SGX. Press releases from the company's own website, newest first.














 Mr Lim Cheong Guan, Top Glove Managing Director
Prompts
Click prompts to add them under the company line, click again to take one out, then copy the result into your AI chat. Shared by Asian Century Stocks and Uncovered Thai Stocks. Thank you.
Company History
Name and ticker changes, and re-registrations under a new regulatory id. When a ticker stopped being used is not recorded, so former tickers are undated.
| Date | Change | Detail |
|---|---|---|
| Aug 31, 2015 | Reporting currency | Its SG reports are in MYR instead of SGD from this period. Earlier figures are shown in MYR, converted at each period end's exchange rate. |
ETFs Holding Top Glove Corporation Bhd
Exchange-traded funds whose newest published daily portfolio holds one of the company's listings, largest weight first.
| ETF | Weight in ETF | Shares | Market value | As of |
|---|---|---|---|---|
| AVEE | 0.08% | 453,000 | $ 103.972K | Nov 16, 2026 |
| DFEV | 0.04% | 3,432,900 | $ 778.579K | Nov 12, 2026 |
| DEXC | 0.02% | 276,900 | $ 62.801K | Nov 12, 2026 |
| AVEM | 0.02% | 19,249,400 | $ 4.418M | Nov 16, 2026 |
| AVXC | 0.02% | 367,600 | $ 84.371K | Nov 16, 2026 |
| DFEM | 0.02% | 6,983,900 | $ 1.584M | Nov 12, 2026 |
| DFAE | 0.01% | 4,465,000 | $ 1.013M | Nov 12, 2026 |
| NTSE | 0.01% | 34,500 | $ 5,795.83 | Jun 30, 2026 |
| DFAX | 0.01% | 3,912,900 | $ 887.442K | Nov 12, 2026 |
| AVSE | 0.00% | 32,000 | $ 7,344.62 | Nov 16, 2026 |