NOTICE OF TRANSFER AND USE OF TREASURY SHARES
Bull 0
Bear 0
Routine
|
CapitaLand Investment Limited is a global real asset manager with a strong presence in Asia. The company operates through core business segments including Listed Funds Management, Private Funds Management, Operating Platforms, and Legacy Investments. Its services encompass commercial management, lodging management, and real estate investments. CLI connects institutional capital to real asset opportunities through integrated fund management platforms. The company serves markets in Southeast Asia, China, and Australia. Notable entities within its ecosystem include CapitaLand Development, CapitaStar, and Ally Logistic Property. CapitaLand Investment Limited was listed on the Singapore Exchange in 2021 following a restructuring of CapitaLand Group. Summarised from the company's own disclosures, fiscal year ended Jun 2026 |
Industry Asset Management | Homepage capitaland.com |
| Sector Financial Services | IR page capitaland.com/en/investment | |
|
Tags
real estate investment, fund management, commercial management, lodging management, institutional capital, private funds, listed funds, asset-light growth, CapitaLand Development, CapitaStar, Ally Logistic Property, OMEGA logistics infrastructure, Kris+
|
Press page — |
Metrics
| Valuation | |
|---|---|
| Market cap | S$ 11.58B |
| Market cap (USD) | $ 8.98B |
| P/E | 61.05 |
| PEG | — |
| P/BV | 0.86 |
| P/S | 5.49 |
| P/OCF | — |
| P/FCF | — |
| Dividend yield | — |
| Turnover / mcap | — |
| Returns | |
|---|---|
| ROE | 1.0% |
| ROI | 0.74% |
| ROIC | 2.4% |
| Profit margin | 6.8% |
| Growth | |
|---|---|
| Revenue growing | No |
| Profits growing | No |
| Revenue up 3y | No |
| Revenue up 5y | No |
| Earnings growth 3y (net profit CAGR) | -44.8% |
| Quality | |
|---|---|
| Profitable | Yes |
| Margin expanding | No |
| Buying back stock | — |
| Diluting (TTM) | No |
| Debt/Equity | 43.2% |
| Podcast bulls (TTM) | Sign up |
| Podcast bears (TTM) | Sign up |
| Podcast sentiment (TTM) | Sign up |
| Podcast sentiment % (TTM) | Sign up |
| News sentiment (TTM) | 0 |
| Quality score | -35.7% |
| Insiders | |
|---|---|
| Buys, 1w | Sign up |
| Buys, 1m | Sign up |
| Buys, 1y | Sign up |
| Sells, 1w | Sign up |
| Sells, 1m | Sign up |
| Sells, 1y | Sign up |
Sign up to see this company's insider trades
Operating KPIs — quarters
Business figures the company publishes beside its accounts (users, subscribers, same-store sales, production, occupancy ...), read from its results releases and reports, with the growth on the same period a year earlier beneath each: computed from the figures, and as the company states it where it does. Each figure links to its source; counts at a period end show under that period.
Operating KPIs — years
Business figures the company publishes beside its accounts (users, subscribers, same-store sales, production, occupancy ...), read from its results releases and reports, with the growth on the same period a year earlier beneath each: computed from the figures, and as the company states it where it does. Each figure links to its source; counts at a period end show under that period.
Sign up to see institutional holdings
Sign UpPodcast Mentions
Sign up to see podcast mentions and sentiment
Sign UpAnnouncements made on SGXNet, newest first, routine notices (disclosures of interest, daily buy-backs, listing confirmations, coupons) included. The link opens the announcement on SGX. Press releases from the company's own website, newest first.
3Q 2026 Business Updates
Bull 2
Bear 0
Results
CapitaLand Integrated Commercial Trust 3Q 2026 Business Updates 29 Oct 2026 Announcements
Bull 0
Bear 0
Not a release








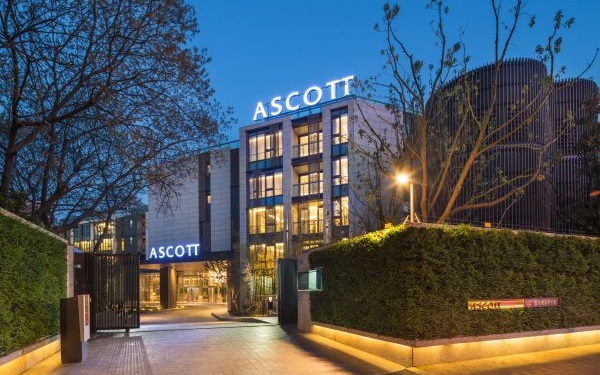
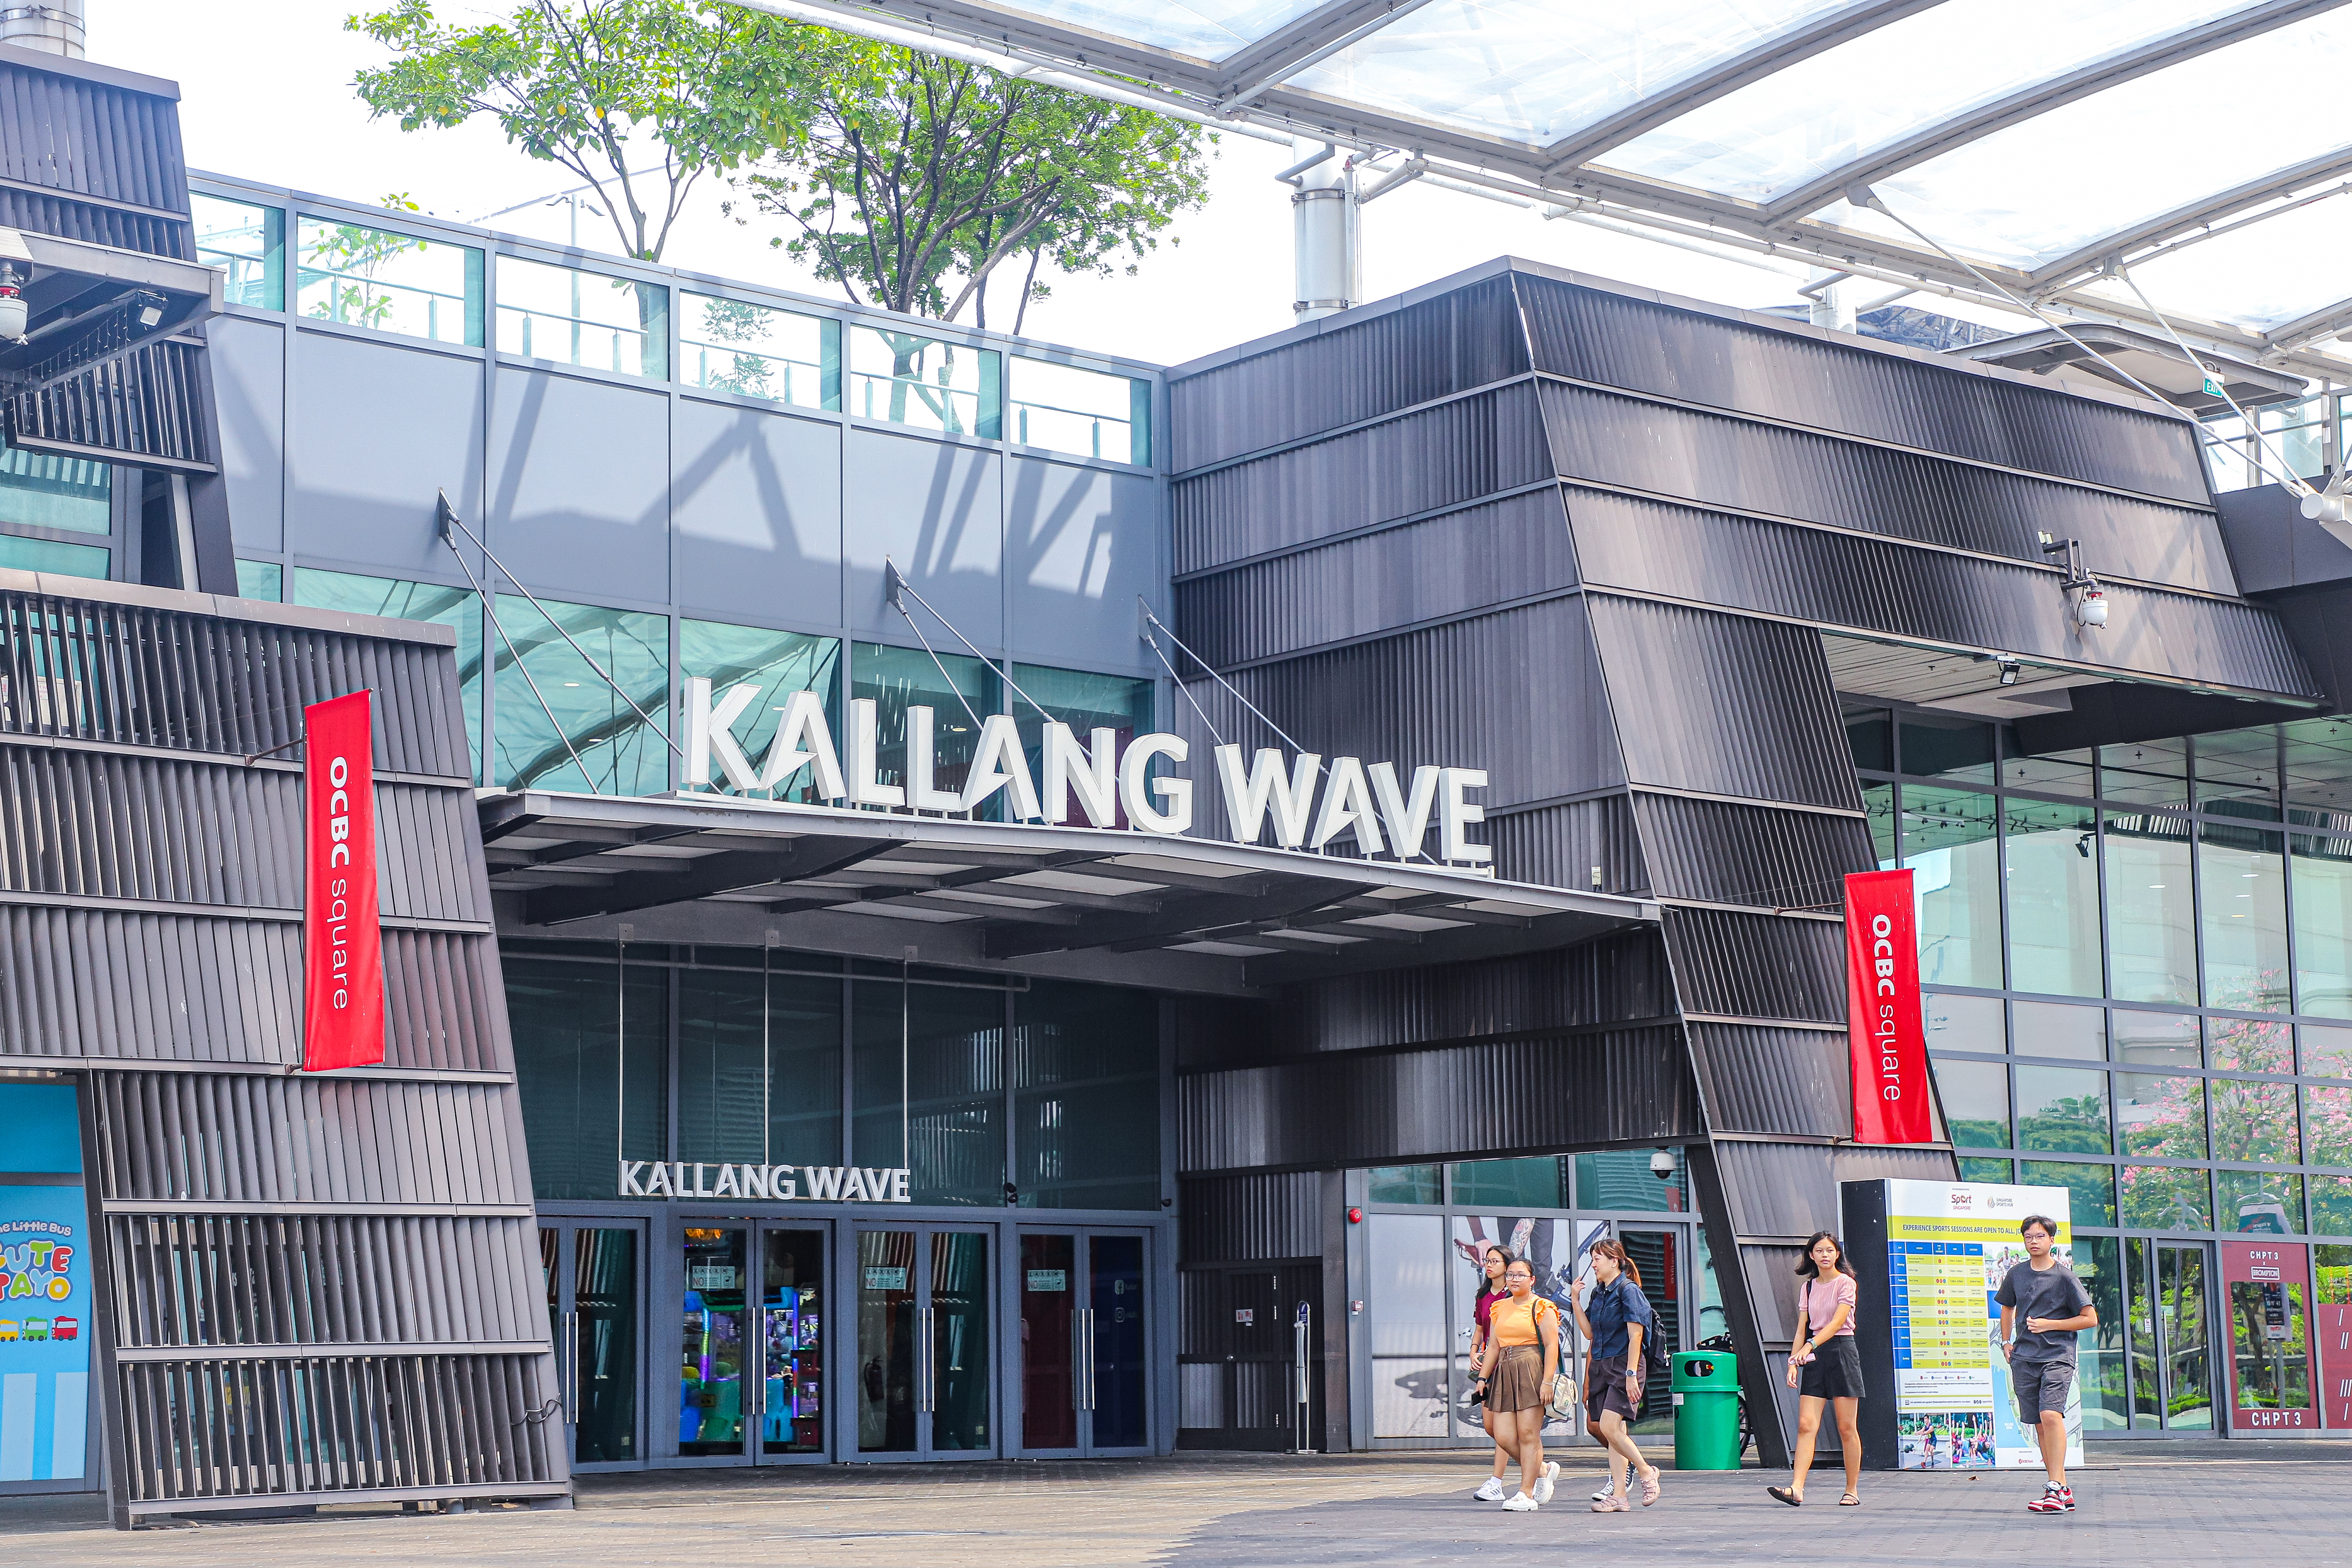






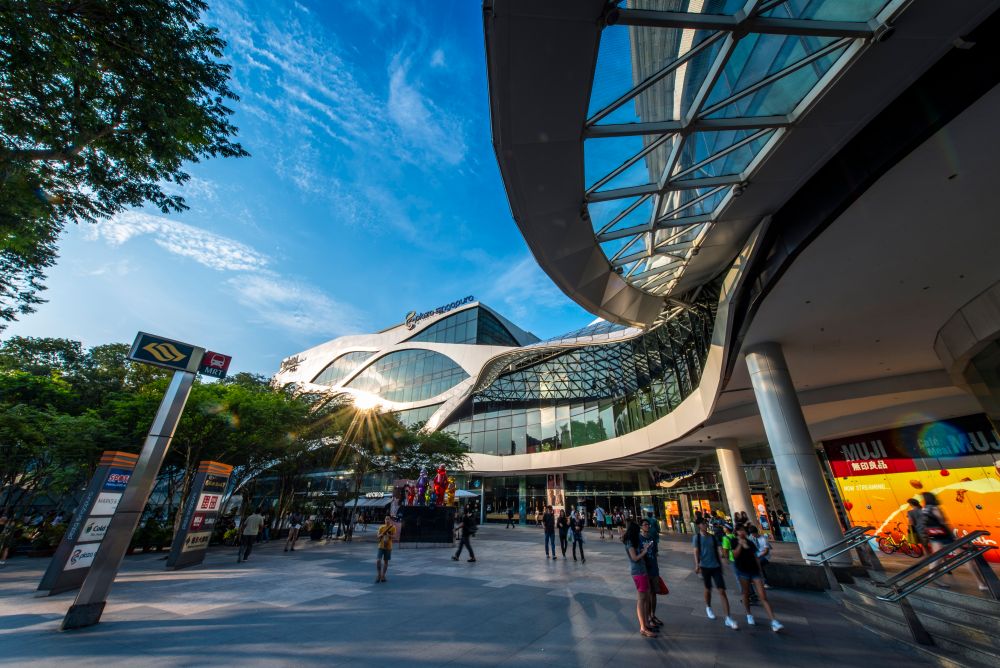










 lyf Funan Singapore

Prompts
Click prompts to add them under the company line, click again to take one out, then copy the result into your AI chat. Shared by Asian Century Stocks and Uncovered Thai Stocks. Thank you.
Capitaland Investment Limited (ticker 9CI), listed in Singapore.
Copied
ETFs Holding Capitaland Investment Limited
Exchange-traded funds whose newest published daily portfolio holds one of the company's listings, largest weight first.