Q3 Interim report 2026
2 Interim report Q3 2026
July 1 – September 30, 2026
Delivering on the plan with increasing margins and
record sales
• Net sales of SEK 2,498 million (1,883), an increase of 33
percent, of which organic growth of 17 percent.
• Adjusted EBITA of SEK 281 million (146), an increase of
93 percent.
1
• Adjusted EBITA margin of 11.3 percent (7.7), higher sequentially and compared to previous year. 1
• Fiber Solutions reported n et sales of SEK 1,414 million
(1,236), an organic growth of 13 percent driven by strong
performance in the US market. Adjusted EBITA grew
102 percent to SEK 133 million (66) driven primarily by
higher net sales and the performance improvement
program which now has full effect. Adjusted EBITA
margin increased to 9.4 percent (5.4).
• Harsh Environment reported net sales of SEK 393
million (314), an organic growth of 6 percent driven by
connectivity solutions. Adjusted EBITA grew 24 percent
to SEK 43 million (35) driven by the acquisition of JOWO
Systemtechnik. Adjusted EBITA margin of 11.0 percent
(11.1).
• Data Center reported net sales of SEK 692 million (334),
an organic growth of 44 percent driven by strong
performance in the US market. Adjusted EBITA grew
108 percent to SEK 117 million (56) driven by higher
organic net sales and acquisitions. Adjusted EBITA
margin of 16.9 percent (16.9).
• Profit for the period amounted to SEK 180 million (-123).
• Cash flow from operating activities amounted to SEK
228 million (154).
• Adjusted leverage reduced to 1.3x, a decrease of 0.4x
compared to Q2 2026, driven primarily by positive cash
flow from operating activities.
1
• EBITA includes net non-recurring effects of SEK 71 million related to the performance improvement program, of which SEK 67 million related to the reversal of a previously recognized impairment of tangible assets associated with the planned capacity adjustment of the Clinton facility in Q4 2025. The effect was excluded from adjusted EBITA.
Significant events in the quarter
• Oscar Wärme was appointed acting Head of Data
Center and member of the Executive Management
Team.
• Hexatronic held an Extraordinary General Meeting to
adopt the long-term performance-based share savings
program.
• Pernilla Lindén will transition from Group CFO to the
newly created role President Fiber Solutions as of
November 1, 2026.
Net sales, SEK m Organic growth +% Adjusted EBITA margin % 1
2,498 17% 11.3%
Figures for the third quarter 2026
Key figures
1
Definitions and calculations of alternative performance measures are provided on pages 26-28.
Amounts in millions of Swedish kronor are based on whole kronor, and percentages are calculated using rounding to two decimal places.
202620252026202525/262025
SEK mQ3Q3∆%Jan-Sep Jan-Sep∆%R12Full-year
Net sales
2,4981,88333%6,4415,67114%8,2897,519
Adjusted EBITA¹
2811469
3%65149930%
784632
Adjusted EBITA margin¹
11.3%7.7%10.1%8.8%9.5%8.4%
EBITA
352-56n.a.722297143%759334
EBITA margin
14.1%-3.0%11.2%5
.2%9.
2%4.4%
Operating profit (EBIT)
328-82n.a.651215203%663226
Profit for the period
180-123n.a.40241886%346-16
Earnings per share after dilution, SEK
0.81-0.59n.a.1.
8
80.20848%1.63-0.07
Cash flow from operating activities
22815449%43823587%788584
Adjusted leverage, (x)¹
1.32.01.32.01.31.9
Leverage, (x)¹
1.32.31.32.31.32.2
3 Interim report Q3 2026
Hexatronic delivered a strong Q3, with organic growth across
all three business areas and improved profitability for the
group. Net sales increased by 33 percent (of which 17 percent
organic) to SEK 2,498 million which was the highest quarterly
sales in the company’s history.
Adjusted EBITA grew 93 percent to SEK 281 million,
corresponding to an adjusted EBITA margin of 11.3 percent up
from 7.7 percent Q3 last year. The improvement was supported
by all three business areas. Data Center delivered another
record quarter, Harsh Environment achieved its highest
quarterly EBITA to date, and Fiber Solutions reported improved
margins and organic growth driven by North America and
APAC.
The development during the quarter validates our strategy and
the strength of Hexatronic’s diversified business model. The
performance improvement program in Fiber Solutions has been
instrumental in restoring profitability. Our business in North
America continued to grow rapidly and has now surpassed
Europe as the largest region. We continue to enjoy compelling
growth opportunities from our positioning as an important
solution provider to data centers, defense and communications
infrastructure around the world.
Fiber Solutions shifting to growth, driven by the US market
Fiber Solutions continues to solidify the business turnaround. This
was the third consecutive quarter with sequentially improving
adjusted EBITA margin, now at 9.4 percent approaching our
target of 10 percent over a cycle. The performance improvement
program launched last year is of course an important driver and
has delivered the expected benefits.
We are therefore now increasingly shifting the business focus
back towards growth, with organic net sales growth of 13 percent
during the quarter. In particular, the US business is growing faster
than anticipated and we have therefore decided to reverse the
earlier decision to down-size one of our facilities in South Carolina.
APAC is also experiencing robust growth with increasing
opportunities arising in emerging markets. This development
complements our strong progress in North America and provides
further opportunities for Fiber Solutions to expand its presence in
attractive growth markets. We also saw material orders from
submarine cables being shipped in the quarter. Our European
FTTH business on the other hand, continues to face challenging
market conditions, especially in the UK and DACH regions.
Record earnings in Harsh Environment
Harsh Environment is moving in the right direction with net sales
growth of 25 percent, of which 6 percent organic. We saw record
earnings in the quarter with an adjusted EBITA of SEK 43 million,
corresponding to a margin of 11.0 percent.
The Connectivity business developed particularly well, supported
by strong demand from the defense sector. We continue to enjoy a
strong order book in this segment which further underlines the
growth potential. Dynamic cables delivered modest organic
growth with continued subdued demand in the energy sector.
Momentum in Data Center continues
Our Data Center business area had an exceptionally strong
quarter. Net sales increased by 107 percent, including organic
growth of 44 percent, with an adjusted EBITA margin of 16.9
percent. This was the business area’s first quarter with EBITA
exceeding SEK 100 million and rolling 12-month net sales have
now passed SEK 2 billion. It is particularly pleasing to see our two
latest acquisitions, Communication Zone and Superior Fiber and
Data Services performing well with Communication Zone
delivering a material project for a large customer and Superior
Fiber and Data Services cementing its strong position in the
education segment.
Demand in the data center market remains strong, supported by
continued investment in digital infrastructure and increased
computing capacity. However, this was an exceptionally strong
quarter with tailwinds from both seasonal effects and timing of
certain projects, positively impacting net sales in the quarter.
Strong cash flow and materially lower leverage
Cash flow from operating activities amounted to SEK 228 million,
corresponding to a cash conversion rate of 72 percent. The
positive cash flow, together with improved earnings, contributed
to a reduction in adjusted leverage to 1.3x at the end of Q3,
compared with 1.7x at the end of Q2.
Priorities going forward and outlook Hexatronic enters the final quarter of the year with good momentum across the Group. We remain focused on creating growth in North America and driving demand for digital infrastructure across different sectors, while continuing to lift the performance of Fiber Solutions and Harsh Environment. At the same time, our strong financial position gives us flexibility to pursue growth through acquisitions.
Some segments are beginning to see growth restrictions, limiting our ability to grow faster than current levels. This applies in particular to glass fiber and some types of connectors. Input costs show some divergence with certain costs, mainly fiber and transportation increasing. On the other hand, resin costs have stabilized at lower levels during the quarter. We are responding to the cost increases by validating new suppliers and increasing prices. However, increasing backlogs and lead times are sometimes unavoidable. For Fiber Solutions, North America remains the key growth priority driven both by market growth in fiber-to-the-home and transport networks as well as opportunities to take market share.
Comments from the CEO Delivering on the plan with increasing margins and record sales
4 Interim report Q3 2026
We expect the European market to remain subdued in the near
term as transport network upgrades have not yet materialized to
the same extent as in North America. We also foresee a normal
seasonal pattern with lower activity in Q4 and Q1 compared to Q2
and Q3.
Demand for submarine cables remains strong and we expect a
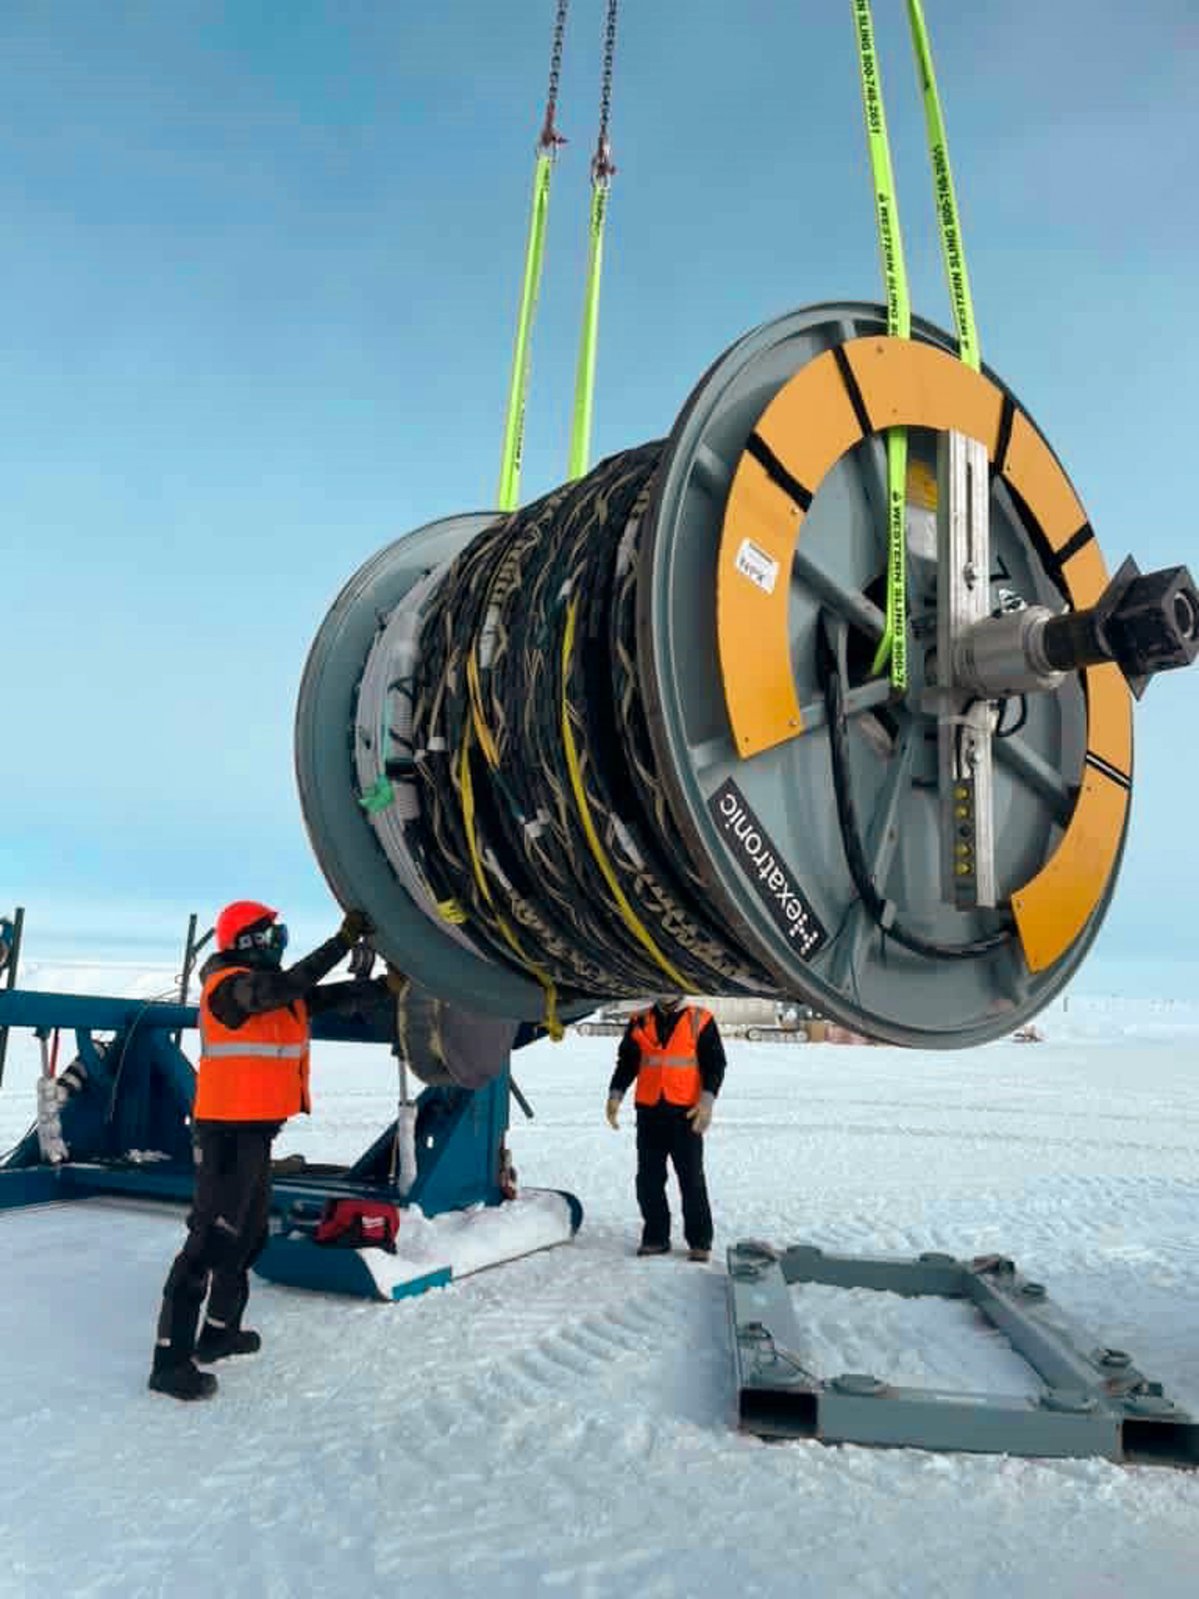
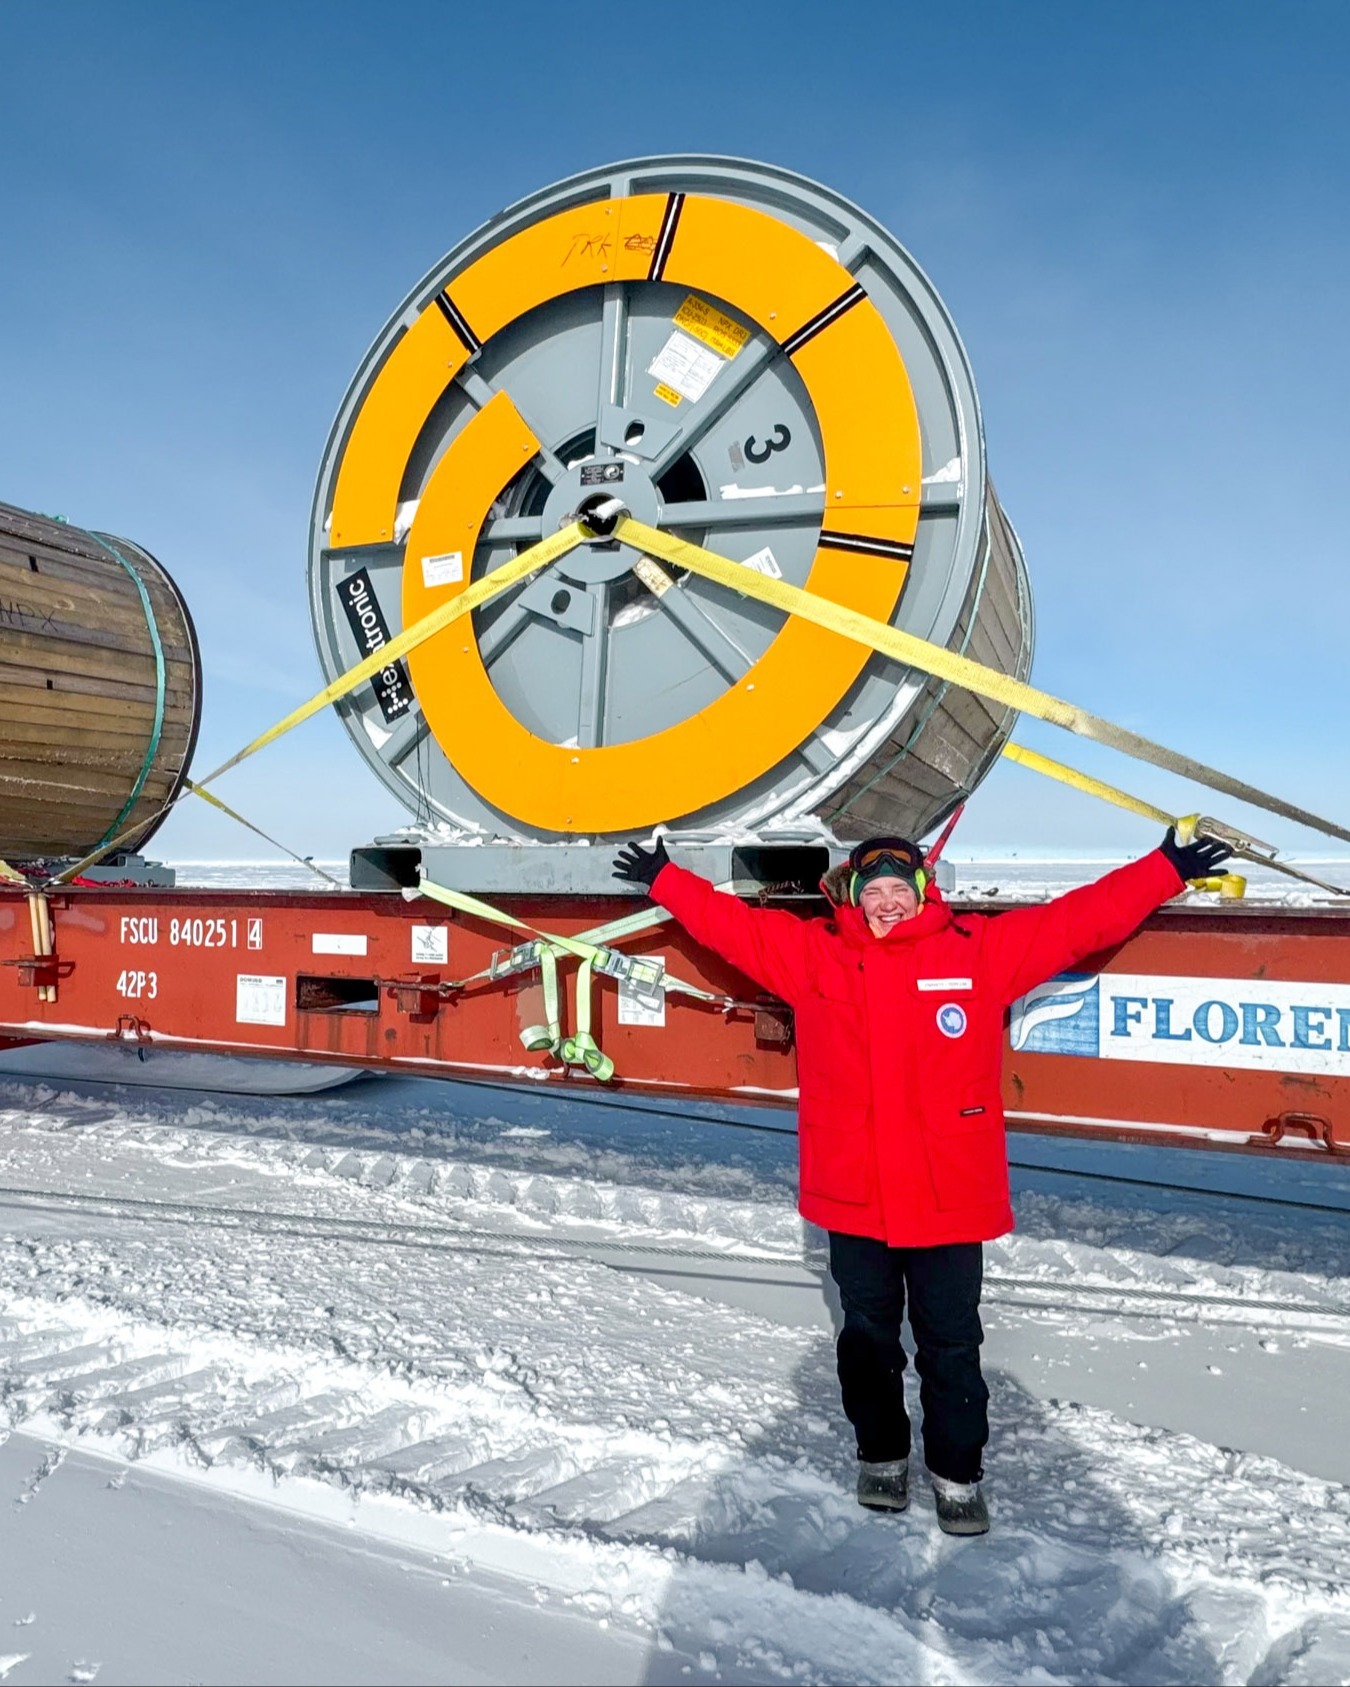
similar level of deliveries in Q4 as in Q3. Our capacity expansion in
Sweden, supported by the long-term partnership with NKT, is
progressing according to plan.
Harsh Environment continues to see strong long-term trends.
Very strong demand in defence is offset by a more muted
sentiment in oil and gas. This dynamic is expected to persist in Q4
and thus we expect a similar trend as in Q3 with modest margin
improvement compared to H1 2026.
Within Data Center, we see no signs of the underlying momentum
to slow down. This quarter was an exceptionally strong quarter
though, with tailwinds from both timing of certain projects and
favourable seasonality. We expect a normalization of activity in
Q4, reflecting normal project timing and the typical seasonality.
The order book at the end of Q3 2026 for the group remained on
similar levels as the previous quarter with around 4 months of net
sales.
In conclusion, I am pleased to see strong results across all three
business areas, illustrating that our strategy is delivering results.
The progress we have made since launching our financial targets
a year ago demonstrates that we are well on our way towards
achieving them. With a solid financial structure, we are well
positioned to capture both organic and non-organic growth
opportunities as demand for fast and reliable digital infrastructure
continues to increase.
Finally, I would like to thank all our employees for their continued
commitment and hard work. These strong results are a reflection
of the dedication and drive demonstrated across our entire
organisation.
Rikard Fröberg
President and CEO
5 Interim report Q3 2026
Net sales and growth
Third quarter July 1 – September 30, 2026
The Group’s net sales in the third quarter increased by 33 percent to SEK 2,498 million (1,883).
Organically, net sales increased by 17 percent in the quarter, driven by all business areas.
Growth from acquisitions amounted to 14 percent and is attributable to Communication Zone,
JOWO Systemtechnik AG and Superior Fiber & Data Services. Currency effects during the
quarter amounted to 1 percent, primarily due to a stronger USD, GBP and AUD.
During the quarter, net sales in Fiber Solutions amounted to SEK 1,414 million (1,236),
corresponding to 56 percent (65) of the Group's net sales and a growth of 14 percent compared
to the corresponding quarter last year. Net sales in Harsh Environment increased by 25 percent
to SEK 393 million (314) in the quarter, corresponding to 16 percent (17) of the Group's total net
sales. Data Center reported net sales of SEK 692 million (334), which represents growth of 107
percent compared with the corresponding quarter last year, and accounting for 28 percent (18)
of total net sales.
For the Group, net sales in Europe increased by 2 percent compared to last year, driven by Data
Center and Harsh Environment. Net sales in North America increased by 80 percent, driven by
Fiber Solutions and Data Center. In APAC, net sales in the quarter increased by 37 percent,
driven by Fiber Solutions and Harsh Environment.
The period January 1 – September 30, 2026 The Group’s net sales for the period increased 14 percent to SEK 6,441 million (5, 671). Organically, net sales increased by 9 percent in the period, driven by all business areas. Growth from acquisitions amounted to 8 percent and is attributable to Communication Zone, JOWO Systemtechnik AG and Superior Fiber & Data Services. Currency effects during the period amounted to -3 percent, primarily due to a weaker USD, GBP, KRW and EUR.
During the period, net sales in Fiber Solutions amounted to SEK 3,743 million (3,700),
corresponding to 58 percent (65) of the Group's net sales and an increase of 1 percent
compared to the corresponding period last year. Net sales in Harsh Environment increased by
11 percent to SEK 1,036 million (931) in the period, corresponding to 16 percent (17) of the
Group's total net sales. Data Center reported net sales of SEK 1,665 million (1,040), which
represents growth of 60 percent compared with the corresponding period last year, and
accounting for 26 percent (18) of net sales.
For the Group, net sales in Europe decreased by 6 percent compared to last year, driven by
weak performance in Fiber Solutions. Net sales in North America increased by 44 percent,
driven by Fiber Solutions and Data Center. In APAC, net sales in the period increased by 20
percent, mainly driven by Fiber Solutions and Harsh Environment.
Analysis of change in net sales
Q3Q3Jan-SepJan-Sep SEK m2026(%)2025(%)2026(%)2025(%) Previous year’s period1,883 1,9515,6715,757 Organic growth 32817%302%5009%381% Acquisitions and structural changes 263 14%241%4538%1162% Exchange-rate effects 231%-122-6%-183-3%-240-4% Current period2,49833%1,883-3%6,44114%5,671-1% Net sales (SEK m) and growth per quarter
Sales by business area Q3
Sales by geographical area Q3
1,883 1,848 1,698 2,245 2,498 -3% 1% -10% 18% 33% Q3Q4Q1Q2Q3 2025 2026 Fiber Solutions, 56% Harsh Environment, 16% Data Center, 28% Europe, 43% North America, 48% APAC, 9%
6 Interim report Q3 2026
EBITA
Third quarter July 1 – September 30, 2026
Adjusted EBITA amounted to SEK 281 million (146), corresponding to a margin of 11.3 percent
(7.7) and a growth of 93 percent. The higher adjusted EBITA was primarily driven by higher net
sales and acquisitions. The higher EBITA margin was primarily driven by Fiber Solutions
through the performance improvement program launched in Q3 2025, which now has full
effect, and higher net sales in relation to the cost base.
EBITA amounted to SEK 352 million (-56), corresponding to a margin of 14.1 percent (-3.0).
EBITA includes net non-recurring effects of SEK 71 million related to the performance
improvement program, of which SEK 67 million related to the reversal of a previously
recognized impairment of tangible assets associated with the planned capacity adjustment of
the Clinton facility in Q4 2025. The decision to reverse the earlier decision to down-size the
Clinton facility reflects both stronger than anticipated growth in the US market and
expectations of continued favorable market development. The effect is excluded from adjusted
EBITA.
The period January 1 – September 30, 2026
Adjusted EBITA amounted to SEK 651 million (499), corresponding to a margin of 10.1 percent
(8.8), and a growth of 30 percent. The higher adjusted EBITA was primarily driven by higher net
sales and acquisitions. The higher EBITA margin was primarily driven by Fiber Solutions
through the performance improvement program launched in Q3 2025.
EBITA amounted to SEK 722 million (297), corresponding to a margin of 11.2 percent (5.2).
EBITA includes net non-recurring effects of SEK 71 million related to the performance
improvement program, of which SEK 67 million related to the reversal of a previously
recognized impairment of tangible assets associated with the planned capacity adjustment of
the Clinton facility in Q4 2025. The decision to reverse the earlier decision to down-size the
Clinton facility reflects both stronger than anticipated growth in the US market and
expectations of continued favorable market development. The effect is excluded from adjusted
EBITA.
Financial items
Third quarter July 1 – September 30, 2026
Financial items
for the quarter amounted to SEK -73 million (-9), of which net interest
amounted to SEK -26 million (-31), realized and unrealized exchange rate differences amounted
to SEK -18 million (3) and other financial items amounted to SEK -29 million (19). Other financial
items include revaluation of additional purchase price and acquisition option of SEK -28 million
(20), attributable to both currency effects and changed assumptions.
The period January 1 – September 30, 2026
Financial items for the period amounted to SEK -102 million (-71), of which net interest
amounted to SEK -81 million (-101), realized and unrealized exchange rate differences
amounted to SEK -5 million (0) and other financial items amounted to SEK -15 million (30).
Other financial items include revaluation of additional purchase price and acquisition option of
SEK -10 million (35), attributable to both currency effects and changed assumptions.
Profit for the period
Third quarter July 1 – September 30, 2026
Profit for the period amounted to SEK 180 million (-123), and earnings per share after dilution
amounted to SEK 0.81 (-0.59). Tax for the quarter amounted to SEK -75 million (-32), resulting
in an average effective tax rate of 29.6 percent (-35.1).
The period January 1 – September 30, 2026
Profit for the period amounted to SEK 402 million (41), and earnings per share after dilution
Adjusted EBITA (SEK m) and adjusted EBITA
margin (%)
Adjusted EBITA by business area Q3
Earnings per share (SEK)
146 133 146 224 281 7.7% 7.2% 8.6% 10.0% 11.3% Q3Q4Q1Q2Q3 2025 2026 Fiber Solutions, 45% Harsh Environment, 15% Data Center, 40% -0.59 -0.27 0.45 0.61 0.81 Q3Q4Q1Q2Q3 20252026
7 Interim report Q3 2026
amounted to SEK 1.88 (0.20). Tax for the period amounted to SEK -147 million (-103), resulting in an average effective tax rate of 26.7 percent (71.6 ). The tax rate for the period was positively impacted by the assessment of deferred tax assets, supported by available deferred tax liabilities in the same jurisdiction.
Cash flow and investments Third quarter July 1 – September 30, 2026 Cash flow from operating activities amounted to SEK 228 million (154). Higher accounts receivables and lower accounts payables impacted working capital negatively which was partly offset by positive contributions from operating receivables and operating liabilities, resulting in change in working capital of SEK -88 million (22). During the quarter, cash flow from the Group's investing activities amounted to SEK -42 million (-27). Investments in intangible and tangible fixed assets amounted to SEK -38 million (-27). Cash flow effect related to business combinations after deduction of acquired cash and cash equivalents amounted to SEK -3 million (0), mainly attributable to payment of earnout attributable to DCS.
During the quarter, cash flow from the Group’s financing activities amounted to SEK -246
million (-33), mainly explained by loan repayments of SEK -212 million (-1) and amortization of
lease liabilities of SEK -34 million (-34).
Total cash flow for the quarter amounted to SEK -60 million (93).
The period January 1 – September 30, 2026 Cash flow from operating activities during the period amounted to SEK 438 million (235). Higher accounts receivable and inventory negatively impacted working capital, partly offset by positive contributions from accounts payable and operating liabilities, resulting in a change in working capital of SEK -205 million (-215).
During the period, cash flow from the Group’s investing activities amounted to SEK -619 million (-81). Investments in intangible and tangible fixed assets amounted to SEK -91 million (-71). Cash flow effect related to business combinations after deduction of acquired cash and cash equivalents amounted to SEK -527 million (-10), mainly attributable to the acquisitions of JOWO Systemtechnik AG and Superior Fiber & Data Services, as well as payments of additional purchase price related to KNET, DCS and an acquisition option related to Qubix. Cash flow from the Group’s financing activities amounted to SEK 134 million (-1 34), mainly explained by net proceeds from new share issues of SEK 583 million. This was partly offset by loan repayments of SEK -712 million (-42) and amortization of lease liabilities of SEK -99 million (-101), while new issued loans amounted to SEK 362 million (8). Total cash flow for the period amounted to SEK -47 million (20).
Operating cash flow (SEK m)
Investments (SEK m)
154 349 29 181 228 Q3Q4Q1 Q2Q3 20252026 27 27 22 30 38 Q3Q4Q1Q2Q3 20252026
8 Interim report Q3 2026
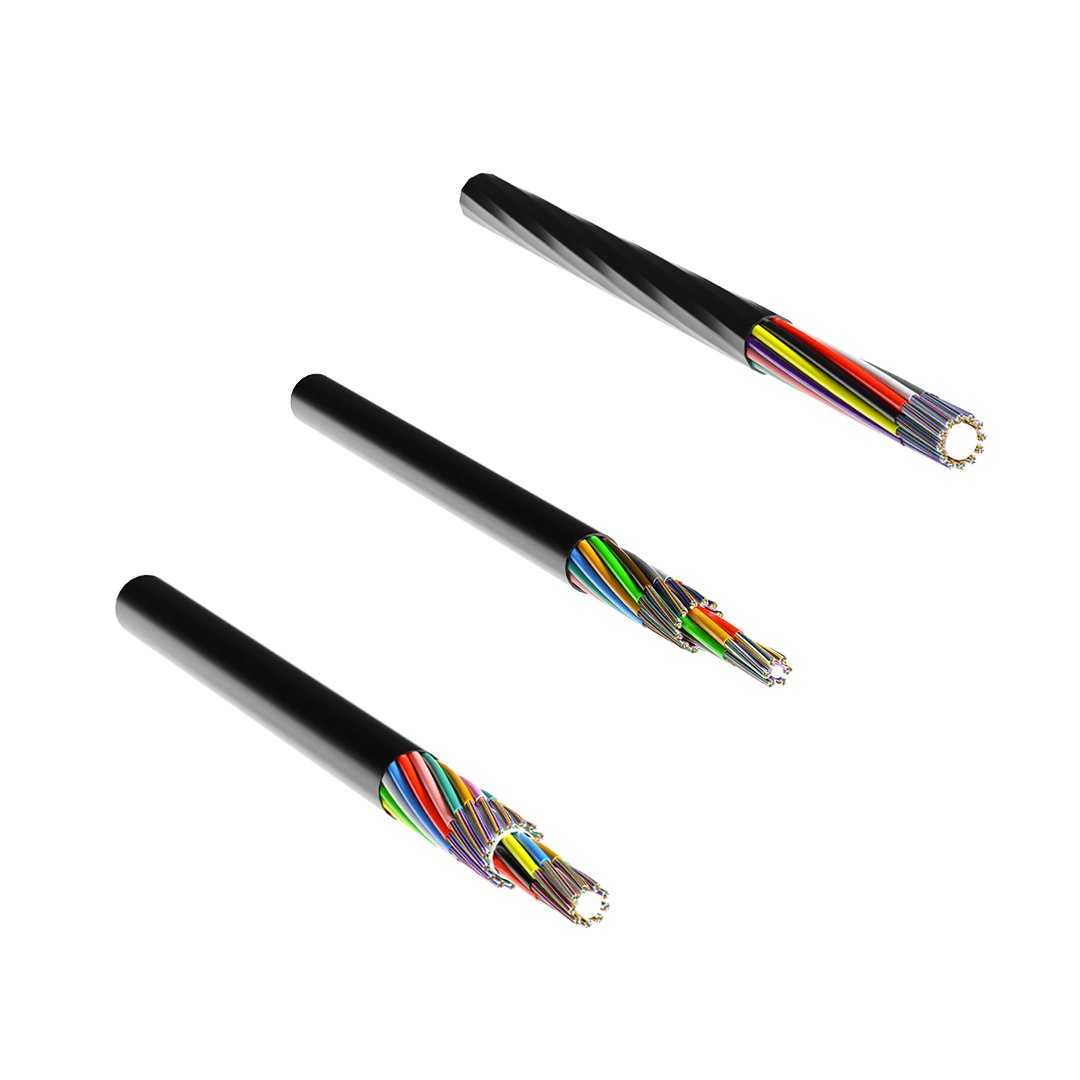
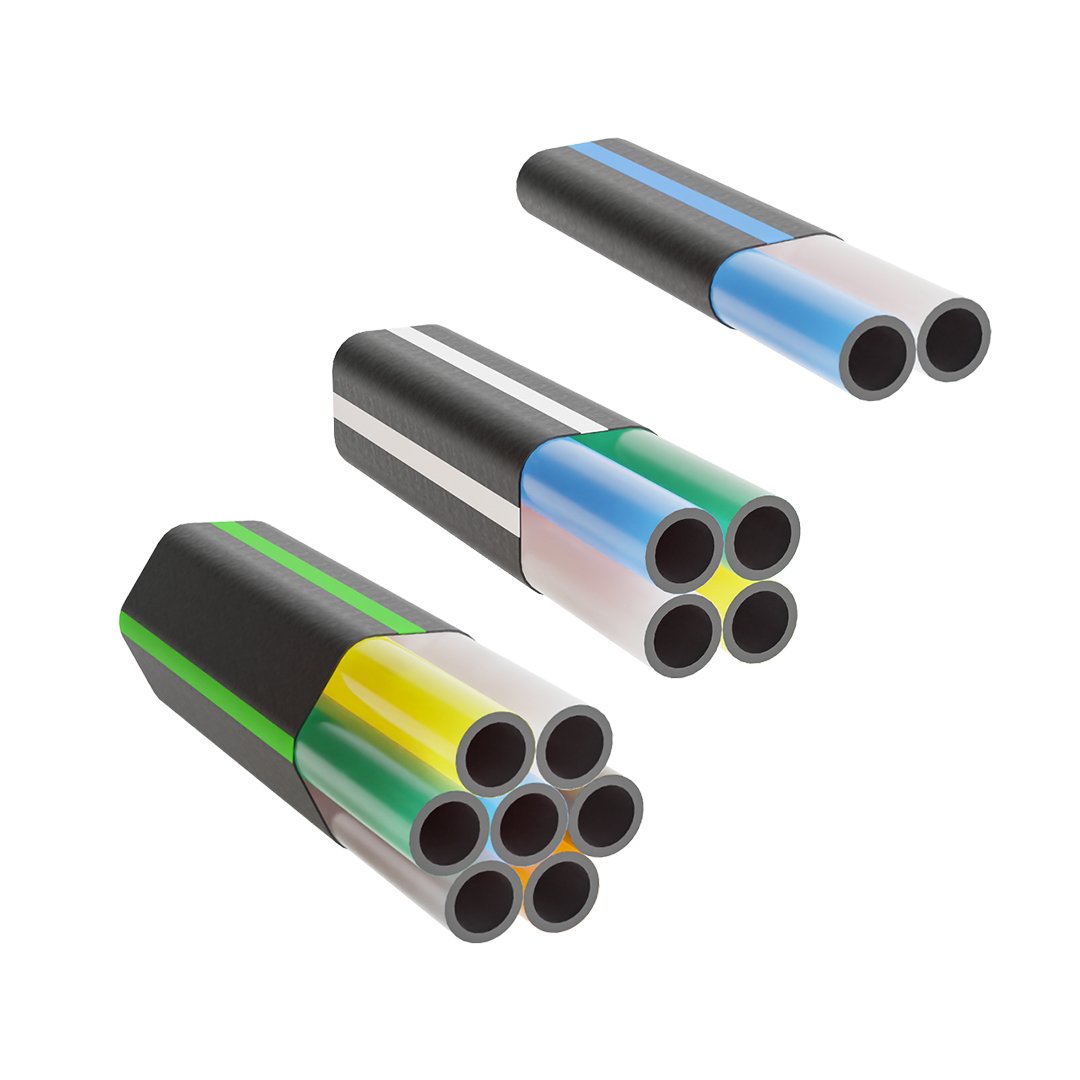
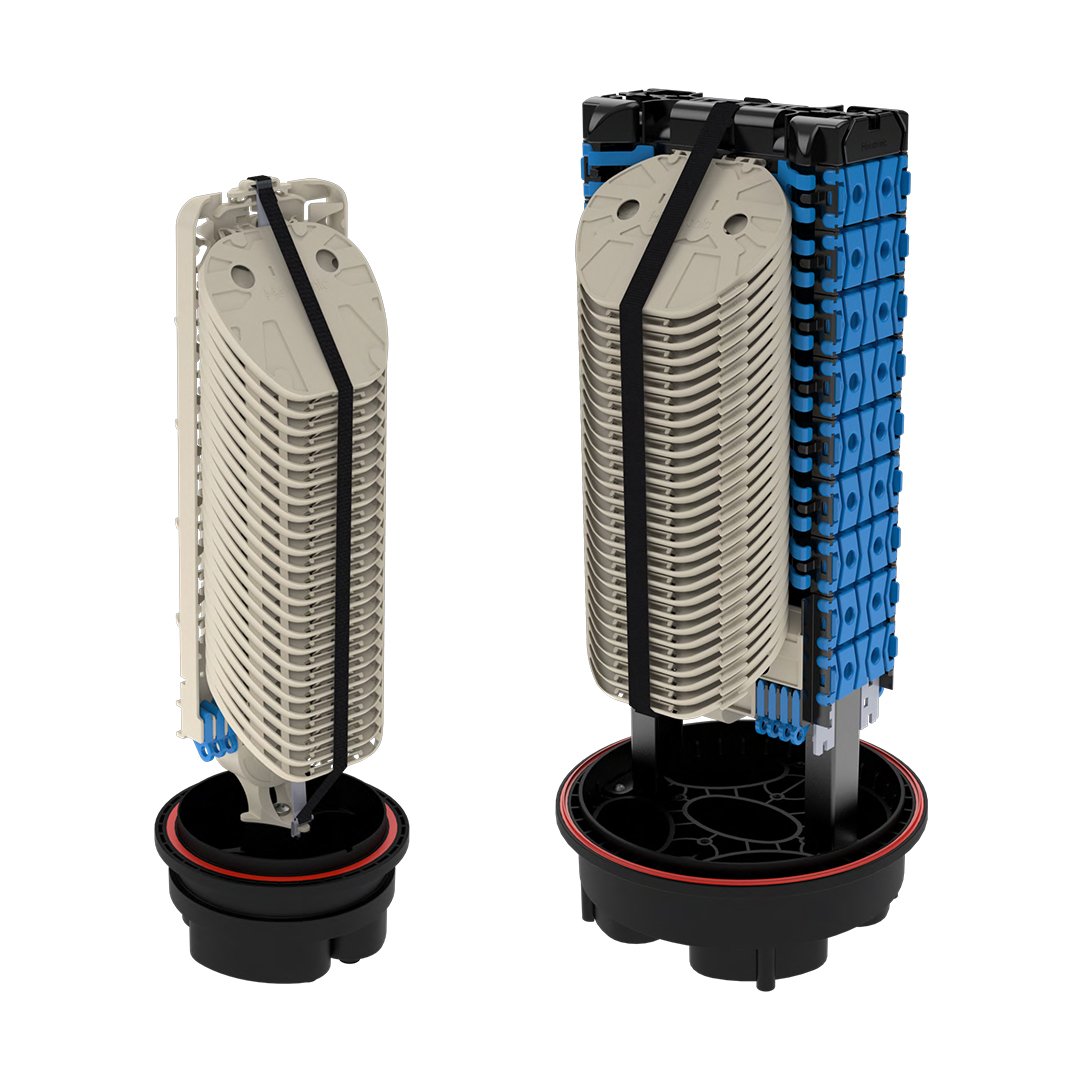
Fiber Solutions Fiber optic cables, ducts, and network products for broadband deployment.
Net sales and profit Net sales increased by 14 percent to SEK 1,414 million in the third quarter, driven by strong growth in the US. Organically, net sales increased by 13 percent, a difference of 1 percentage points compared to net sales growth driven by currency effects. Net sales in Europe decreased by 9 percent. In North America, net sales increased by 51 percent. In the APAC region, net sales increased by 28 percent. Adjusted EBITA amounted to SEK 133 million, corresponding to an adjusted EBITA margin of 9.4 percent. An increase compared to last year due to the performance improvement program, which now has full effect and higher net sales in relation to the cost base.
EBITA includes net non-recurring effects of SEK 71 million related to the performance improvement program, of which SEK 67 million related to the reversal of a previously recognized impairment of tangible assets associated with the planned capacity adjustment of the Clinton facility in Q4 2025. See page 6 for more information.
Sales by Geography Q3
Net sales and adjusted EBITA margin
Harsh Environment Advanced, dynamic cables and solutions for connectivity in challenging environments.
Net sales and profit Net sales increased by 25 percent to SEK 393 million in the third quarter, driven by organic growth and the acquisition of JOWO Systemtechnik. Organic growth was 6 percent primarily driven by connectivity solutions. As previously communicated, the companies within Harsh Environment have an international customer base and a majority of revenues from larger projects, which means that sales per geography can fluctuate between quarters. Adjusted EBITA amounted to SEK 43 million, corresponding to an adjusted EBITA margin of 11.0 percent. In-line with same period previous year.
202620252026202525/262025 SEK mQ3Q3∆%Jan-Sep Jan-Sep∆%R12Full-year Net sales1,4141,23614%3,7433,7001%4,9134,870 Adjusted EBITA13366102%31724927%378310 Adjusted EBITA %9.4%5.4%8.5%6.7%7.7%6.4% EBITDA20424740%49232949%596433 EBITDA %14.5%2.0%13.1%8.9%12.1%8.9% EBITA204-124n.a.38860551%35426 EBITA %14.5%-10.0%10.4%1.6%7.2%0.5% Investments271052306240 – % of net sales1.9%0.8%1.4%0.8%1.3%0.8% Europe, 45% North America, 42% APAC, 13% 1,236 1,169 982 1,347 1,414 5.4% 5.2% 6.2% 9.1% 9.4% Q3Q4Q1Q2Q3 20252026
Sales by Geography Q3
Net sales and adjusted EBITA margin
202620252026202525/262025 SEK mQ3Q3∆%Jan-Sep Jan-Sep∆%R12Full-year Net sales39331425%1,03693111%1,3461,241 Adjusted EBITA433524%103104-1%138139 Adjusted EBITA %11.0%11.1%9.9%11.1%10.3%11.2% EBITDA554423%1361323%182178 EBITDA %14.0%14.2%13.1%14.2%13.5%14.3% EBITA433332%1031021%138137 EBITA %11.0%10.4%9.9%10.9%10.3%11.0% Investments71328324347 – % of net sales1.7%4.2%2.7%3.4%3.2%3.8% Europe, 54% North America, 35% APAC, 11% 314 310 283 361 393 11.1% 11.4% 8.5% 10.0% 11.0% Q3Q4Q1Q2Q3 20252026
9 Interim report Q3 2026
Data Center Customized products and services for data center companies and other fiber intense businesses such as financial institutions, schools and hospitals, as well as adjacent services such as audio-visual installations and security and access solutions.
Net sales and profit Net sales increased by 107 percent to SEK 692 million in the third quarter driven by strong organic growth and the acquisitions of Communication Zone and Superior Fiber & Data Services. Organic net sales increased by 44 percent. Net sales in Europe increased by 12 percent. In North America, net sales increased by 281 percent. Adjusted EBITA amounted to SEK 117 million, a 108 percent increase driven by higher organic net sales and acquisitions. The adjusted EBITA margin of 16.9 percent was in-line with the same period last year.
Sales by Geography Q3
Net sales and adjusted EBITA margin
Corporate/Elimination Corporate functions/Elimination mainly refers to central functions such as corporate staff, as well as other non-core activities within the respective segments, including elimination of internal transactions between segments. Adjusted EBITA amounted to SEK ‑12 million (-11) in the quarter.
202620252026202525/262025 SEK mQ3Q3∆%Jan-Sep Jan-Sep∆%R12Full-year Net sales692334107%1,6651,04060%2,0341,409 Adjusted EBITA11756108%27319639%329252 Adjusted EBITA %16.9%16.9%16.4%18.8%16.2%17.9% EBITDA12360105%29020840%352269 EBITDA %17.8%18.0%17.4%20.0%17.3%19.1% EBITA11756110%27319540%329252 EBITA %16.9%16.7%16.4%18.8%16.2%17.8% Investments441091211 – % of net sales0.6%1.1%0.6%0.8%0.6%0.8% Europe, 35% North America, 65% APAC, 0% 334 369 434 538 692 16.9% 15.3% 16.8% 15.5% 16.9% Q3Q4Q1Q2Q3 20252026 202620252026202525/262025 SEK mQ3Q3∆%Jan-Sep Jan-Sep∆%R12Full-year Net sales-10-3-1-4-1 Adjusted EBITA-12-11-6%-42-5016%-61-70 Adjusted EBITA %------ EBITDA-12-2042%-40-5729%-60-77 EBITDA % EBITA-12-2142%-42-5930%-63-80 EBITA % Investments10101 0 – % of net sales------
10 Interim report Q3 2026
Financial position
The Group's net debt amounted to SEK 1,305 million as of September 30, 2026, compared to
SEK 1,582 million as of December 31, 2025. Leverage was 1.3x as of September 30, 2026,
compared with 2.2x at year‑end 2025. Adjusted leverage was 1.3x as of September 30, 2026,
compared with 1.9x at year‑end 2025.
Available funds as of September 30, 2026, including unutilized credit facilities, amounted to
SEK 2,090 million compared to available funds of SEK 1,797 million as of December 31, 2025.
Equity
Equity amounted to SEK 4,896 million as of September 30, 2026, corresponding to SEK 22.11
per outstanding share at the end of the reporting period before dilution, compared with equity
of SEK 3,468 million, corresponding to SEK 16.87 per outstanding share, as of December 31,
2025.
Employees
The number of employees in the Group as of September 30, 2026, was 2,133, compared to 2,011
employees as of December 31, 2025, an increase mainly due to acquisitions.
Parent company The Parent Company’s principal activity is the provision of Group‑wide services. During the period January-September, revenue amounted to SEK 115 million (104), while profit before tax was SEK 49 million (346), impacted by dividends from subsidiaries of SEK 150 million (470). The Parent Company’s short‑term liabilities, which mainly comprise internal cash pool balances, are currently financed through the internal cash pool. Over time, an increasing share of this funding is expected to be provided through dividends and group contributions.
1.3x Adjusted leverage
2,133 Number of employees
11 Interim report Q3 2026
Other information
Seasonal variations
Hexatronic's sales of products and services within Fiber Solutions
are affected by seasonal variations, which means that sales during
the first and fourth quarters of the year are usually slightly lower
than during the summer months when weather conditions are
more favorable for groundwork. Sales in harsh environment are
unaffected by seasonal variations, while Data Center often has
slightly higher activity during the first half of the year and slightly
lower during the second half.
Significant risks and uncertainties
Hexatronic's operations, like all business activities, are associated
with risks of various kinds. Identifying and evaluating risks is a
natural and integral part of the business to control, limit, and
proactively manage prioritized risks. The Group's ability to identify
and prevent risks minimizes the risk of unpredictable events
harming the company. Risk management aims not necessarily to
eliminate risk, but rather to secure our business objectives with a
balanced risk portfolio.
Risks related to business development and long-term strategic
planning, as well as the Group's work with sustainability issues and
related risks, are managed by Group Management and ultimately
prioritized by the Board of Directors.
Hexatronic has divided identified risks into market-related,
operational, regulatory, and financial risks. Sustainability risks are
integral to all risk areas and are described in more detail in the
Group's sustainability report.
A more detailed description of the Group's risks and risk
management is provided in Hexatronic Group's Annual Report
and Sustainability Report 2025, on pages 32-35.
Current geopolitical uncertainty, uncertainty about trade barriers
and tariffs, and a generally uncertain macroeconomic situation
affect Hexatronic. The Group's strategy of local manufacturing
helps to reduce these risks.
The expansion of fiber optic infrastructure is supported by private
players and government investment programs, such as the
Gigabit Strategy in Germany, the Project Gigabit in the UK, and the
BEAD program in the US. Similar programs exist in most
countries. Should the willingness to invest decrease, for example,
due to increased costs and/or reduced government investment
programs, this could affect Hexatronic's business and thus future
revenues. In recent years, Hexatronic has diversified its business
by expanding into new geographic markets, market segments,
and applications, and therefore has limited exposure to
developments in individual markets.
Transactions with related parties
There were no significant transactions with related parties during
the period.
Review This interim report has been subject to review by the company's auditor. Gothenburg, October 22, 2026
Rikard Fröberg
CEO and President
Hexatronic Group AB (publ)
12 Interim report Q3 2026
Consolidated income statement
Consolidated statement of comprehensive income
20262025202620252025 SEK mNoteQ3Q3Jan-SepJan-SepFull-year Revenue Net sales 2 2,4981,8836,4415,6717,519 Other operating income1815535871 Total2,5161,8986,4945,7297,590 Operating expenses Raw materials and goods for resale-1,503-1,216-3,876-3,457-4,625 Other external costs-278-218-710-645-847 Personnel costs-346-350-993-987-1,285 Other operating expenses-18-5-37-28-29 Depreciation and impairment of tangible assets-19-165-156-315-469 Earnings before amortisation of intangible assets (EBITA) 352-56722297334 Amortisation of intangible assets-24-26-71-83-108 Operating profit (EBIT)328-82651215226 Result from financial items Financial items, net-73-9-102-71-105 Result after financial items255-91549144121 Income taxes-75-32-147-103-137 Profit for the period180-12340241-16 Attributable to: Parent Company shareholders180-12240442-14 Non-controlling interest-10-1-1-2 Profit for the period180-12340241-16 Earnings per share Earnings per share before dilution (SEK)0.81-0.591.880.20-0.07 Earnings per share after dilution (SEK)0.81-0.591.880.20-0.07 20262025202620252025 SEK mQ3Q3Jan-SepJan-SepFull-year Profit for the period180-12340241-16 Items which can later be recovered in the income statement Translation differences294-107505-614-745 Hedging of net investments-3119-87179206 Tax attributable to items that can be returned to the income statement 6-418-37-43 Other comprehensive income for the period269-92436-472-581 Comprehensive income for the period449-215839-431-597 Attributable to: Parent Company shareholders449-214839-428-593 Non-controlling interest0-10-2-4 Comprehensive income for the period449-215839-431-597
13 Interim report Q3 2026
Consolidated balance sheet
SEK mNote2026-09-302025-09-302025-12-31 Assets Non current assets Intangible fixed assets 3,4622,6942,835 Property plant and equipment 2,0642,0401,908 Financial assets 594537 Total non-current assets 5,5854,7804,780 Current assets Inventories 1,5361,3861,202 Accounts receivable 1,6861,2751,184 Other receivables 30918 Prepaid expenses and accrued income 314236211 Cash and cash equivalents 678596661 Total current assets 4,2443,5013,277 TOTAL ASSETS 9,8298,2808,057 Equity 4,8963,6333,468 Non-current liabilities Liabilities to credit institutions 71,9192,2392,181 Deferred tax 275240236 Non-current lease liabilities 346333330 Other non-current liabilities 833787181 Total non-current liabilities 2,8782,8992,928 Current liabilities Liabilities to credit institutions 7646362 Current lease liabilities 127121119 Accounts payable 962722696 Provisions 618869 Current tax liabilities 392217 Other liabilities 8145295294 Accrued expenses and deferred income 655437405 Total current liabilities 2,0551,7491,661 TOTAL EQUITY, PROVISION AND LIABILITIES 9,8298,2808,057
14 Interim report Q3 2026
Consolidated statement of changes in equity
Share
Capital
Other
capital
contri-
butions
Reserves
Hedging
reserve
Result
brought
forward,
including
result for
the period
Total
Non-
controlling
interests
Total
equity
Balance brough forward as of 1 January,
2025
21,027428-582,6244,022354,057
Profit for the period-----14-14-2-16
Other comprehensive income---743164--579-2-581
Total comprehensive income00-743164-14-593-4-597
New shares related to employee stock option
programme
Employee stock option programme-4---4-4
Share-based remuneration0---33-3
Sale of shares linked to incentive programme----11-1
Total transactions with shareholders,
reported directly in equity
04004808
Balance carried forward as of 31 December,
2025
21,031-3161062,6143,437313,468
Balance brough forward as of 1 January,
2026
21,031-3161062,6143,437313,468
Profit for the period404404-1402
Other comprehensive income504-694352436
Total comprehensive income00504-694048390839
Employee stock option programme-3---3-3
Share-based remuneration----33-3
New share issue0583---584-584
Total transactions with shareholders,
reported directly in equity
05870035900590
Balance carried forward as of September 30,
2026
21,618188373,0204,865314,896
15 Interim report Q3 2026
Consolidated statement of cash flow
20262025202620252025 SEK mNoteQ3Q3Jan-SepJan-SepFull-year Operating profit328-82651215226 Items not affecting cash flow674273203459673 Interest received44101013 Interest paid-25-30-79-97-125 Income tax paid-64-35-141-137-188 Cash flow from operating activities before changes in working capital 316132643450599 Increase (-)/decrease (+) in inventories068-99-12024 Increase (-)/decrease (+) in accounts receivable-83-22-299-260-166 Increase (-)/decrease (+) in operating receivables254-4-20-22 Increase (+)/decrease (-) in accounts payable-63-731346932 Increase (+)/decrease (-) in operating liabilities334664116118 Cash flow from changes in working capital-8822-205-215-14 Cash flow from operating activities228154438235584 Investing activities Acquisition of tangible and intangible assets -38-27-91-71-98 Acquisition of subsidiaries after deduction of cash and cash equivalents -3–-527-10-174 Change in financial assets-1–-1–– Cash flow from investing activities-42-27-619-81-272 Financing activities Borrowings––36288 Amortisation of loans-212-1-712-42-74 Amortisation of lease liabilities-34-34-99-101-133 New share issues for the period––583–– Sale of shares–1–11 Cash flow from financing activities-246-33134-134-199 Cash flow for the period-6093-4720114 Cash and cash equivalents at the start of the period694518661633633 Exchange rate difference in cash and cash equivalents44-1565-57-86 Cash and cash equivalents at the end of the period678596678596661
16 Interim report Q3 2026
Key metrics for the Group
For definition of key metric, see the section Definition alternative key metrics. The key metrics presented are deemed essential to describing the Group’s development as they both constitute the Group’s financial objectives (growth in net sales and EBITA margin) and are the key metrics by which the Group is governed. Several key metrics are considered relevant to investors, such as earnings per share and the number of shares. Other key metrics are presented in order to provide different perspectives on how the Group is developing and are therefore deemed to be of benefit to the reader.
202620252026202525/262025
SEK mQ3Q3Jan-SepJan-SepR12Full-year
Growth in net sales33%-3%14%-1%11%-1%
EBITA margin14.1%-3.0%11.2%5.2%9.2%4.4%
Adjusted EBITA margin11.3%7.7%10.1%8.8%9.5%8.4%
EBITA margin, 12 months rolling9.2%6.4%9.2%6.4%9.2%4.4%
Adjusted EBITA margin, 12 months rolling9.5%9.1%9.5%9.1%9.5%8.4%
Operating margin13.1%-4.3%10.1%3.8%8.0%3.0%
Equity asset ratio49.8%43.9%49.8%43.9%49.8%43.0%
Earnings per share before dilution (SEK)0.81-0.591.880.201.63-0.07
Earnings per share after dilution (SEK)0.81-0.591.880.201.63-0.07
Net sales per employee (SEK thousand)1,1809413,1662,8384,0923,762
Result per employee (SEK thousand)85-6119921171-7
Quick asset ratio132%121%132%121%132%125%
Cash flows from operating activities228 154438 235 788 584
Leverage, x1.32.31.32.31.32.2
Adjusted leverage, x1.32.01.32.01.31.9
Average number of employees2,117 2,001 2,035 1,998 2,026
1,999
Number of shares at period end before dilution221,448,661205,673,228221,448,661205,673,228221,448,661205,637,228
Average number of shares before dilution221,448,661205,637,228214,416,478205,527,551212,221,665205,554,969
Average number of shares after dilution221,528,980205,637,228214,496,796205,527,551212,301,984205,554,971
17 Interim report Q3 2026
Parent Company income statement
Total comprehensive income is the same as profit for the period in the parent company since there is nothing accounted for as other comprehensive income.
20262025202620252025 SEK mQ3Q3Jan-SepJan-SepFull-year Revenue Net sales3934115104139 Total3934115104139 Operating expenses Other external costs-35-22-96-84-122 Personnel costs-20-30-62-72-79 Other operating expenses00000 Depreciation of tangible assets00000 Earnings before amortisation of intangible assets (EBITA)-16-18-43-53-63 Amortisation of intangible assets-00-2-2 Operating profit (EBIT)-16-19-43-54-64 Result from financial items Financial items, net-28-12193401425 Result after financial items-44-14049346361 Appropriations----81 Result before tax-44-14049346442 Income taxes-64-10-13-19 Net result for the period-50-13540334423
18 Interim report Q3 2026
Parent Company balance sheet
SEK m2026-09-302025-09-302025-12-31 Assets Intangible assets 110 Tangible assets 100 Financial assets 7,0766,3346,493 Total non-current assets 7,0786,3356,493 Current receivables Receivables from Group companies 310201319 Current tax receivables -33 Other receivables 011 Prepaid expenses and accrued income 7910 Total current receivables 316214333 Cash and bank balances 39973 Total current assets 319313406 TOTAL ASSETS 7,3976,6486,899 Equity 4,3073,5903,681 Untaxed reserves 242924 Non-current liabilities Liabilities to credit institutions 1,9122,2332,176 Other non-current liabilities 1014451 Total non-current liabilities 2,0132,2772,227 Current liabilities Liabilities to credit institutions 646362 Accounts payable 91517 Provisions 054 Liabilities to Group companies 896416651 Current tax liabilities 6-- Other liabilities 38215200 Accrued expenses and deferred income 393733 Total current liabilities 1,053751966 TOTAL EQUITY, PROVISIONS AND LIABILITIES 7,3976,6486,899
19 Interim report Q3 2026
Notes
Note 1. Accounting principles
The consolidated financial statements for Hexatronic Group
(“Hexatronic”) have been prepared in accordance with
International Financial Reporting Standards (IFRS) as adopted by
the EU, RFR 1 Supplementary Accounting Rules for Groups and
the Swedish Annual Accounts Act. This interim report has been
prepared in accordance with IAS 34 Interim Reporting; the
Swedish Annual Accounts Act and RFR 1 Supplementary
Accounting Rules for Groups.
The Parent Company’s financial statements have been prepared in
accordance with the Swedish Annual Accounts Act and the
Swedish Financial Reporting Board’s recommendation RFR 2
Accounting for Legal Entities. The application of RFR 2 means that
in its interim report for the legal entity, the Parent Company
applies all IFRS, and statements adopted by the EU as far as
possible within the framework of the Swedish Annual Accounts
Act and the Swedish Insurance Act and regarding the relationship
between accounting and taxation.
For full accounting policies, see the Annual Report for 2025.
Note 2. Revenue
Note 3. Segment overview
The Group's reportable operating segments have been identified
from a management perspective. The segment information is
based on internal reporting to the chief operating decision maker,
which at Hexatronic has been equated with Group Management.
The Group ́s operations are managed and reported by three
business segments:
Fiber Solutions is the Group 's business in fiber optic cables, ducts
and network products for FTTH connectivity, 5G, transport
networks, local city networks and submarine cables. Customers
are mainly telecom operators, network owners, and distributors.
Harsh Environment provides advanced cables and solutions
adapted to withstand connectivity in the most challenging
environments. Customers are mainly companies in the energy
sector (offshore), marine technology, defense, and aerospace. The
business area also includes the business of advanced fiber optic
sensor systems.
Data Center offers a broad range of specialist services for the data
center market, as well as adjacent services such as audio-visual
installations and security and access solutions. Hexatronic
designs infrastructure and cable solutions, plans installations and
provide support and operational services — all to ensure that
installations are carried out safely and efficiently.
In addition to the mentioned segments, central functions are
reported under Corporate/Elimination. This mainly includes Group
staff, central departments, and other activities outside the core
Jan-Sep 2026
Geographical markets
Fiber Solutions
1,7251,5214973,743
Harsh Environment
5333791241,036
Data Center
73892061,665
Corporate/Elimination
-2-10-3
Total
2,9942,8196286,441
Category
Goods
2,5292,1636215,314
Services
46565671,127
Total
2,9942,8196286,441
Total APAC
North
America
Europe
Jan-Sep 2025
Geographical markets
Fiber Solutions
2,0651,2264093,700
Harsh Environment
440382109931
Data Center
68035551,040
Corporate/Elimination
-10--1
Total
3,1841,9635245,671
Category
Goods
2,7151,7185174,950
Services
4692458721
Total
3,1841,9635245,671
Europe
North
America
APAC Total
20 Interim report Q3 2026
operations of each segment, including the elimination of internal transactions between segments. Consolidation of the business segments is carried out in accordance with the same accounting principles applied to the Group as a whole. Transactions between business segments are conducted on market terms. The segments are managed and reported based on key financial metrics: net sales, EBITDA, EBITA, and investments (acquisitions of tangible and intangible fixed assets), which are presented below. Summary of key performance indicators for the Group's segments:
20262025202620252025 Net salesQ3Q3Jan-SepJan-SepFull-year Fiber Solutions1,4141,2363,7433,7004,870 Harsh Environment3933141,0369311,241 Data Center6923341,6651,0401,409 Corporate/Elimination-10-3-1-1 Total net sales2,4981,8836,4415,6717,519 EBITDA Fiber Solutions20414.5%242.0%49213.1%3298.9%4338.9% Harsh Environment5514.0%4414.2%13613.1%13214.2%17814.3% Data Center12317.8%6018.0%29017.4%20820.0%26919.1% Corporate/Elimination-12-20-40-57-77 Total EBITDA37114.9%1095.8%87813.6%61310.8%804 10.7% Non-recurring items (EBITDA)01150115134 Adjusted EBITDA Fiber Solutions20414.4%12710.3%49113.1%43111.7%55411.4% Harsh Environment5514.0%4714.9%13613.1%13414.4%18014.5% Data Center12317.8%6118.2%29017.4%20920.1%27019.2% Corporate/Elimination-12-10-40-47-66 Total adjusted EBITDA 371 14.9%22411.9%87813.6%72712.8%93712.5% Depreciation and impairment of tangible assets -19-165-156-315-469 EBITA Fiber Solutions 20414.5%-124-10.0%38810.4%601.6%260.5% Harsh Environment 4311.0%3310.4%1039.9%10210.9%13711.0% Data Center 11716.9%5616.7%27316.4%19518.8%25217.8% Corporate/Elimination -12-21-42-59-80 Total EBITA 352 14.1%-56 -3.0%72211.2%2975.2%3344.4% Non-recurring items (EBITA)-71202-71202298 Adjusted EBITA Fiber Solutions 1339.4%665.4%3178.5%2496.7%3106.4% Harsh Environment 4311.0%3511.1%1039.9%10411.1%13911.2% Data Center 11716.9%5616.9%27316.4%19618.8%25217.9% Corporate/Elimination -12-11-42-50-70 Total adjusted EBITA 281 11.3% 1467.7%65110.1%4998.8%6328.4% Amortisation of intangible assets -24-26-71-83-108 Financial items, net -73-9-102-71-105 Result after financial items 255-91549144121 Investments (Capex) Fiber Solutions 2710523040 Harsh Environment 713283247 Data Center 4410911 Corporate/Elimination 10100 Total investments (Capex) 3827917198
21 Interim report Q3 2026
Growth and share by segment
Sales growth per segment, adjusted for currency effects and acquisitions
Growth and share by geography
2026 2025 SEK mQ3 Q3 Fiber Solutions1,41456%14%1,23665%-14% Harsh Environment39316%25%31417%8% Data Center69228%107%33418%43% Other-10%-00%- Total2,498100%33%1,883100%-3% Allocation % Growth % Allocation % Growth % 2026202520262025 Yearly growth (%) Q3Q3Jan-SepJan-Sep Fiber Solutions 13%-7%4%-6% Harsh Environment 6%15%3%10% Data Center 44%39%30%29% Other
Total Group 17%2%9%1% 20262025 SEK mQ3Q3 Europe1,08543%2%1,05956%4% North America1,19048%80%66235%-13% APAC2239%37%1639%-7% Total 2,498100%33%1,883100%-3% Growth % Allocation % Growth % Allocation %
22 Interim report Q3 2026
Note 4. Business acquisitions Acquisitions 2026 On 1 April 2026, the Group acquired JOWO Systemtechnik AG for a purchase consideration of estimated SEK 177 million, consisting of fixed purchase consideration of EUR 11.7 million and contingent purchase consideration measured at present value of EUR 4.4 million. On 1 June 2026, the Group acquired Superior Fiber & Data Services Inc through Hexatronic Data Center Group Inc. The purchase consideration for Superior amounted to estimated SEK 374 million and consisted of cash of USD 33.7 million, of which USD 2.8 million is deferred, contingent consideration measured at present value of USD 2.2 million, and a financial liability related to the sellers’ 4 percent shareholding in Hexatronic Data Center Group Inc. The shares are subject to a call/put option and are therefore classified as a financial liability. At the acquisition date of Superior Fiber & Data Services Inc, there were also existing minority shareholders whose holdings are subject to call/put options. As all minority interests are considered likely to be redeemed, the acquisition is accounted for without any non-controlling interest. The contingent consideration and the redeemable minority interests are measured at fair value at each reporting date, with changes reported in the income statement. The acquisition analysis below summarizes the preliminary purchase price for the acquisitions and the fair value of acquired assets and assumed liabilities reported on the acquisition date.
Acquisition-related costs of SEK 6 million are included in other external costs in the Group's statement of comprehensive income for the 2026 financial year. Total cash flow, excluding acquisition-related costs, attributable to the business combinations amounted to SEK 364 million. Goodwill is attributable to the future earning capacity that the companies are expected to generate. According to the respective agreements on contingent consideration, the Group shall pay a maximum of EUR 7.6 million for JOWO based on EBITDA for the period 2026–2030, and a maximum of USD 3 million for Superior based on accumulated EBITDA for the period 2026– 2029. The fair value of accounts receivable from the acquisitions amounts to SEK 107 million. No account receivables are considered doubtful. Net sales from the acquisitions included in the Group's income statement since the acquisition dates in 2026 amounted to SEK 272 million. The acquired companies contributed EBITDA of SEK 42 million to the Group since the acquisition dates. If the acquired companies had been consolidated from 1 January 2026 until 30 September 2026, the Group's income statement for the period would have increased by net sales of SEK 478 million and EBITDA of SEK 70 million.
Acquisitions 2025 On November 25, 2025, the Group acquired Communication Zone through Hexatronic Data Center Group Inc. The purchase price consisted of cash of USD 21.8 million, a contingent consideration calculated at present value of USD 2.6 million, and 6.4 percent of the shares in Hexatronic Data Center Group Inc. issued to the sellers. The issued shares are subject to a call/put option and are therefore classified as a financial liability. At the time of acquisition, there were also two minor existing minority shareholders in Hexatronic Data Center Group Inc., whose holdings are also subject to call/put options. As all minority interests are considered likely to be redeemed, the acquisition is reported without any non-controlling interest. Both the contingent consideration and the redeemable minority interests are measured at fair value on an ongoing basis, with changes reported in the income statement. Preliminary purchase price Cash and cash equivalents 414 Holdback purchase consideration (not paid) 26 Liability relating to redeemable minority (put option) 42 Contingent purchase price (not paid) 69 Total purchase price 551 Reported amounts of identifiable acquired assets and assumed liabilities Cash and cash equivalents 51 Property plant and equipment 11 Customer relations 77 Other intangible assets 0 Accounts receivable 107 Inventories 99 Other receivables 56 Other liabilities -181 Deferred tax -20 Total identifiable net assets 200 Non-controlling interests
Goodwill 351
23 Interim report Q3 2026
The acquisition analysis below summarizes the preliminary purchase price for the acquisitions and the fair value of acquired assets and assumed liabilities reported on the acquisition date.
Acquisition-related costs of SEK 2 million are included in other external costs in the consolidated statement of comprehensive income for the 2025 financial year. Total cash flow, excluding acquisition-related costs, attributable to the business combination amounted to SEK 164 million. According to the agreement on conditional purchase price, the Group shall pay a maximum of USD 3.5 million. The fair value of accounts receivable amounts to SEK 23 million. No doubtful accounts receivable were identified at the time of acquisition. Net sales included in the Group's income statement for the 2025 financial year since the acquisition date amounted to SEK 12 million. The acquired companies have contributed an EBITDA of SEK 2 million to the Group since the acquisition date. If the acquired companies had also been included in the Group during the period January 1 to December 31, the Group's net sales for the full year 2025 would have increased by a total of SEK 184 million and EBITDA by SEK 39 million. Note 5. Incentive programs Employee stock option programs active at the time of this publication are:
In addition to above warrant programs, there are three ongoing long-term, performance-based incentive plans (LTIP 2024, 2025 and 2026)
for 40 senior executives and other key employees in the Group who are resident in Sweden. The participants have bought 295,786 savings
shares in total.
Under the LTIP, for each acquired Hexatronic share (savings share), participants can receive 2–6 shares in Hexatronic (performance
shares) free of charge, assuming achievement of certain performance targets. To qualify for performance shares, participants must acquire
and retain a number of Hexatronic shares for the whole of the three-year vesting period and must, with some exceptions, remain in
employment during the same period. In addition to the above conditions, performance shares also require certain performance targets to
be met, linked to the development of the earnings per share after dilution, the Group’s growth, EBITA margin and certain sustainability
targets.
The targets relate to the 2024-2028 financial years. Hexatronic has judged that all the above conditions are non-market-related conditions
under IFRS 2.
Preliminary purchase price as of November 25, 2025
Cash and cash equivalents
208
Liability relating to redeemable minority (put option)
52
Contingent purchase price (not paid)
25
Total purchase price
285
Reported amounts of identifiable acquired assets and assumed liabilities
Cash and cash equivalents
44
Property plant and equipment
3
Customer relations
45
Other intangible assets
2
Accounts receivable
23
Other liabilities
-19
Deferred tax
-9
Total identifiable net assets
89
Non-controlling interests
Goodwill 196 Outstanding warrant programme Number of warrants Corresponding number of shares Proportion of total shares Exercise priceExpiration period Warrant programme 2024/2027330,500 330,500 0.1%55.30 13 May - 13 Jun 2027 Warrant programme 2025/2028635,000 635,000 0.3%34.60 13 May - 13 Jun 2028 Warrant programme 2026/2029645,000 645,000 0.3%60.38 13 May - 13 Jun 2029 Total1,610,500 1,610,500 0.7%
24 Interim report Q3 2026
Note 6. Items not affecting cash flow
Note 7. Liabilities to credit institutions
Note 8. Financial liabilities valued at fair value via the income statement
20262025202620252025 (SEK m)Q3Q3Jan-SepJan-SepFull-year Depreciation, amortisation and impairment116191300398577 Reversal of impairment-73--73-- Revaluation of incentive programmes43857 Work in progress, accrued but not invoiced0-24-26-38-7 Change obsolescence reserve inventory441-183950 Other provisions176445539 Exchange rate differences4-25-12 Other20315 Total 74273203459673 SEK m2025-12-31 Borrow- ings Amortisa- tion of loan Acquis- tions Reclass- ification Change in exchange rate Cost of financing 2026-09-30 Non-current liabilities to credit institutions 2,181 362 - 4 -712 85 0 1,919 Current liabilities to credit institutions 62 - -712 - 712 2 - 64 Total2,243 362 -712 4 - 87 0 1,984
SEK m2024-12-31 Borrow- ings Amortisa- tion of loan Acquis- tions Reclass- ification Change in exchange rate Cost of financing 2025-09-30 Non-current liabilities to credit institutions 2,361 8 - - 42 -174 2 2,239 Current liabilities to credit institutions 152 - -42 - -42 -5 - 63 Total2,513 8 -42 - - -179 2 2,301 Cash flowItems not affecting cash flow Items not affecting cash flowCash flow SEK m2025-12-31 Acquisi- tion Reclass- ification Translation differences Revaluation2026-09-30 Additional purchase price / Acquistion option 378 137 - 1710 379
SEK m2024-12-31 Acquisiti on Reclass- ification Translation differences Revaluation2025-09-30 Additional purchase price / Acquistion option 352 4 - -5-35 307 Items not affecting cash flowCash flow -163 Payment -10 Payment Items not affecting cash flowCash flow
25 Interim report Q3 2026
Quarterly overview Segment reporting by quarter
202420252026 Q4Q1Q2Q3Q4Q1Q2Q3 Fiber Solutions Net sales1,2991,2341,2301,2361,1699821,3471,414 Adjusted EBITA13510578666161122133 Adjusted EBITA %10.4%8.5%6.4%5.4%5.2%6.2%9.1%9.4% EBITDA19516713824104112175204 EBITDA %15.0%13.5%11.2%2.0%8.9%11.4%13.0%14.5% EBITA13510578-124-3461122204 EBITA %10.4%8.5%6.4%-10.0%-2.9%6.2%9.1%14.5% Investments7241610 1091627 Harsh Environment Net sales296286331314310283361393 Adjusted EBITA2429403535243643 Adjusted EBITA %8.0%10.3%12.0%11.1%11.4%8.5%10.0%11.0% EBITDA3439494446344755 EBITDA %11.4%13.6%14.7%14.2%14.7%12.1%13.1%14.0% EBITA2429403335243643 EBITA %8.0%10.3%12.0%10.4%11.5%8.5%10.0%11.0% Investments1299131510117 Data Center Net sales233362344334369434538692 Adjusted EBITA30687256567383117 Adjusted EBITA %12.7%18.8%20.8%16.9%15.3%16.8%15.5%16.9% EBITDA34727660617889123 EBITDA %14.7%20.0%22.0%18.0%16.6%18.0%16.5%17.8% EBITA30687256567383117 EBITA %12.7%18.8%20.8%16.7%15.3%16.8%15.5%16.9% Investments11442334 Corporate/Elimination Net sales-30000-1-1-1 Adjusted EBITA-6-18-20-11-20-12-17-12 Adjusted EBITA %-------- EBITDA-6-17-19-20-20-12-17-12 EBITDA %-------- EBITA-6-18-20-21-21-12-17-12 EBITA %-------- Investments00000001 Total Net sales 1,8241,8821,9061,8831,8481,6982,2452,498 Adjusted EBITA 182184169146133146224281 Adjusted EBITA % 10.0%9.8%8.9%7.7%7.2%8.6%10.0%11.3% EBITDA 258261243109191213294371 EBITDA % 14.1%13.9%12.7%5.8%10.3%12.5%13.1%14.9% EBITA 182184169-5637146224352 EBITA % 10.0%9.8%8.9%-3.0%2.0%8.6%10.0%14.1% Investments 8514302727223038
26 Interim report Q3 2026
Reconciliation between IFRS and key metrics used In this interim report, Hexatronic presents certain financial parameters that are not defined in IFRS known as alternative key metrics. The Group believes that these parameters provide valuable supplementary information for investors as they facilitate an evaluation of the company’s results and position. Since not all companies calculate financial parameters in the same way these metrics are not always comparable with those used by other companies. Investors should see the financial parameters as a complement to rather than a replacement for financial reporting in accordance with IFRS.
202620252025 Organic growth, SEK m, %Q3Q3Full-year Net sales2,4981,8837,519 Exchange-rate effects-23122402 Acquisition driven-263-24-128 Comparable net sales 2,2121,9827,794 Net sales corresponding period previous year1,8831,9517,581 Organic growth 32830213 Organic growth %17%2%3% 202620252025 Annual growth, rolling 12 months, %Q3Q3Full-year Net sales rolling 12 months8,2897,4957,519 Annual growth, rolling 12 months11%-2%-1% Quick asset ratio, %2026-09-302025-09-302025-12-31 Current assets4 2443 5013 277 Inventories-1 536-1 386-1 202 Current assets - inventories 2 7082 1152 075 Current liabilities2 0551 7491 661 Quick asset ratio132%121%125% Core working capital, SEK m2026-09-302025-09-302025-12-31 Inventories1,5361,3861,202 Accounts receivable 1,6861,2751,184 Accounts payable-962-722-696 Core working capital2,2591,9381,691 Net debt, SEK m2026-09-302025-09-302025-12-31 Non-current liabilities to credit institutions1,9192,2392,181 Current liabilities to credit institutions646362 Cash and cash equivalents-678-596-661 Net debt1,3051,7051,582
27 Interim report Q3 2026
202620252025 EBITDA and EBITDA (proforma) R12, SEK mQ3Q3Full-year Operating profit (EBIT), R12663365226 Amortisation of intangible fixed assets, R1297114108 EBITA, R12759479334 Depreciation of tangible fixed assets, R12310391469 EBITDA, R121,069870804 EBITDA (proforma), R121,113870841 Leasing effect (IFRS 16) on EBITDA, R12-132-135-133 EBITDA exclusive IFRS16 (proforma), R12982735707 202620252025 LeverageQ3Q3Full-year Net debt1,3051,7051,582 EBITDA exclusive IFRS16 (proforma), R12982735707 Net debt / EBITDA exclusive IFRS 16 (proforma), R121,32,32,2 202620252025 Adjusted EBITDA and adjusted EBITA Q3Q3Full-year EBITA, R12 759479334 Non-recurring items 25202298 Adjusted EBITA, R12 784681632 EBITDA, R12 1,069870804 Non-recurring items 19115134 Adjusted EBITDA, R12 1,088985937 Acquired EBITDA before closing (R12) 45-37 EBITDA (proforma), R12 1,133985974 Leasing effect (IFRS 16) on EBITDA, R12 -132-135-133 Adjusted EBITDA exclusive IFRS16 (proforma), R12 1,001850841 202620252025 Adjusted leverage Q3Q3Full-year Net debt 1,3051,7051,582 Adjusted EBITDA exclusive IFRS16 (proforma), R12 1,001850841 Net debt / adjusted EBITDA exclusive IFRS 16 (proforma), R12 1.32.01.9
28 Interim report Q3 2026
Definition of alternative key metrics
Acquisition-driven growth
Net sales from acquired businesses during the following twelve
months after the acquisition date.
Adjusted EBIT
Operating profit, revenue minus all costs related to operations,
excluding non-recurring items, net financial items and tax.
Adjusted EBIT margin
Adjusted EBIT as a percentage of net sales.
Adjusted EBITA
Operating profit, excluding non-recurring items, before
amortization of intangible assets.
Adjusted EBITA margin
Adjusted EBITA as a percentage of net sales.
Adjusted EBITDA (pro forma), R12
Operating profit, excluding non-recurring items, before
depreciation, amortization, impairment and pro forma adjusted
acquired EBITDA (before takeover) for the last twelve months
(R12).
Adjusted leverage
Net debt to adjusted EBITDA pro forma, excluding IFRS16, R12.
Annual growth
Average annual growth is calculated as the Group's total net sales
during the period compared with the corresponding period last
year.
Average number of outstanding shares
Weighted average of the number of outstanding shares during the
period.
Average number of outstanding shares after dilution
Weighted average of the number of shares outstanding during the
period plus a weighted number of shares that would be added if all
potential shares were converted into shares.
Cash conversion
Cash flow from operating activities to cash flow from operating
activities before changes in working capital.
Core-working capital
Calculated as inventory plus accounts receivable minus accounts
payable.
Earnings per share before dilution
Profit for the period attributable to parent company shareholders
divided by the average number of outstanding shares before
dilution.
Earnings per share after dilution
Profit for the period attributable to parent company shareholders
divided by the average number of outstanding shares after
dilution.
EBITDA
Operating profit before amortization and impairment of intangible
assets.
EBITDA (proforma), R12
Operating profit before depreciation and amortization plus pro
forma acquired EBITDA, before closing, for the last twelve months.
EBITA
Operating profit before amortization of intangible non-current
assets.
EBITA margin
EBITA as a percentage of net sales.
EBIT
Operating profit. Revenue minus all costs related to operations,
but excluding net financial items and income tax.
EBIT margin
Operating profit as a percentage of net sales.
Equity asset ratio
Total equity as a percentage of total assets.
Equity per share
Total equity is divided by the number of shares outstanding.
Gross profit
Net sales minus costs for raw materials and goods for resale.
Gross profit margin
Gross profit as a percentage of net sales.
Investments (Capex)
Acquisitions of tangible and intangible assets.
Leverage
Net debt to EBITDA (pro forma), excluding IFRS16, R12.
Net debt
Interest-bearing liabilities, excluding lease liabilities, minus cash
and cash equivalents.
Non-recurring items
Non-recurring items affecting comparable results.
Number of employees
Number of employees at the end of the period.
Number of shares
Number of outstanding shares at the end of the period.
Organic growth
Organic growth is calculated as net sales adjusted for exchange
rate effects and acquired businesses in relation to the previous
year's net sales adjusted for acquired businesses.
Quick asset ratio
Calculated as current assets minus inventories divided by current
liabilities.
29 Interim report Q3 2026
This is a translation of the Swedish language original. In the event of any differences between this translation and the Swedish language original, the latter shall prevail.
Auditor’s report
To the Board of directors in Hexatronic Group AB (publ), corporate identity number 556168-6360
Introduction
We have conducted a limited review of the condensed interim financial information (interim report) for Hexatronic Group AB (publ) as of
September 30, 2026, and the nine-month period ending on that date. The board of directors and the managing director are responsible for
preparing and presenting this interim report in accordance with IAS 34 and the Swedish Annual Accounts Act. Our responsibility is to
express a conclusion on this interim report based on our limited review.
The focus and scope of the limited review
We have conducted our limited review in accordance with the International Standard on Review Engagements ISRE 2410, "Review of Interim
Financial Information Performed by the Independent Auditor of the Entity." A limited review consists of making inquiries, primarily of
persons responsible for financial and accounting matters, performing analytical procedures, and other review procedures. A limited review
has a different focus and a significantly smaller scope compared to the focus and scope of an audit conducted in accordance with ISA and
generally accepted auditing standards. The review procedures taken in a limited review do not enable us to obtain the assurance that we
would become aware of all significant matters that might have been identified in an audit. Therefore, the conclusion expressed based on a
limited review does not have the assurance that a conclusion expressed based on an audit has.
Conclusion
Based on our limited review, nothing has come to our attention that causes us to believe that the interim report is not, in all material
respects, prepared for the group in accordance with IAS 34 and the Annual Accounts Act and for the parent company in accordance with
the Annual Accounts Act.
Gothenburg, date as of our digital signature Öhrlings PricewaterhouseCoopers AB
Johan Malmqvist Patrik Resebo
Auditor in charge Authorized Public Accountant
Authorized Public Accountant
Presentation
Hexatronic will present the interim report at a webcast
conference call today, Thursday, October 22, 2026, at 10.00
CEST. CEO Rikard Fröberg, CFO Pernilla Lindén and Head of
Investor Relations Patrik Johannesson will participate.
Link to the webcast:
https://hexatronic-group.events.inderes.com/q3-report-
2026
For registration and participation via the teleconference:
https://events.inderes.com/hexatronic-group/q3-report-
2026/dial-in
Webcast and presentation materials will be available on the
Hexatronic website.































 Your browser does not support the video tag.