ENGCON-B

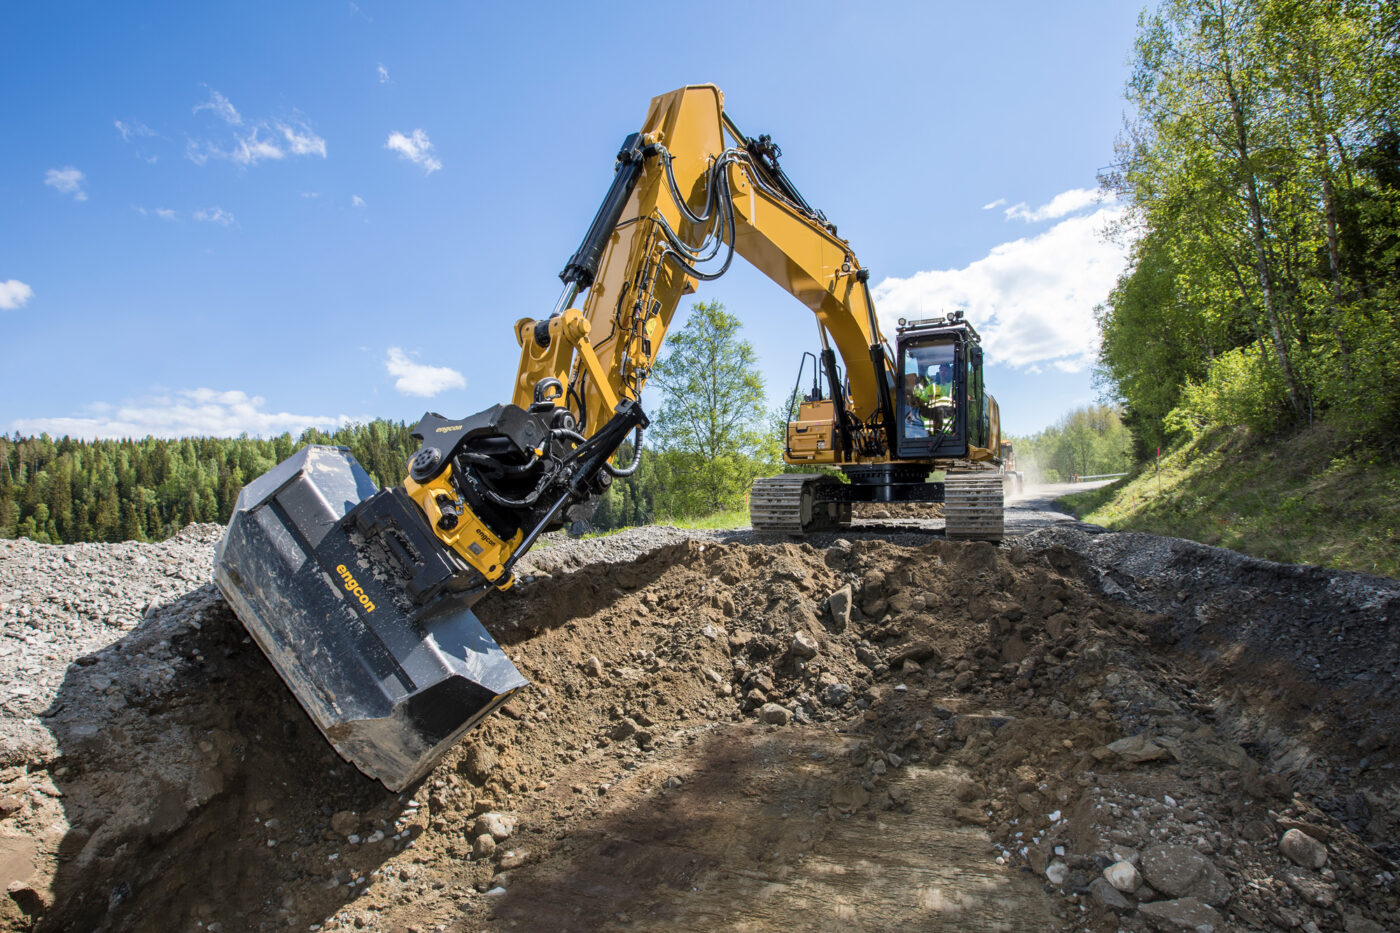
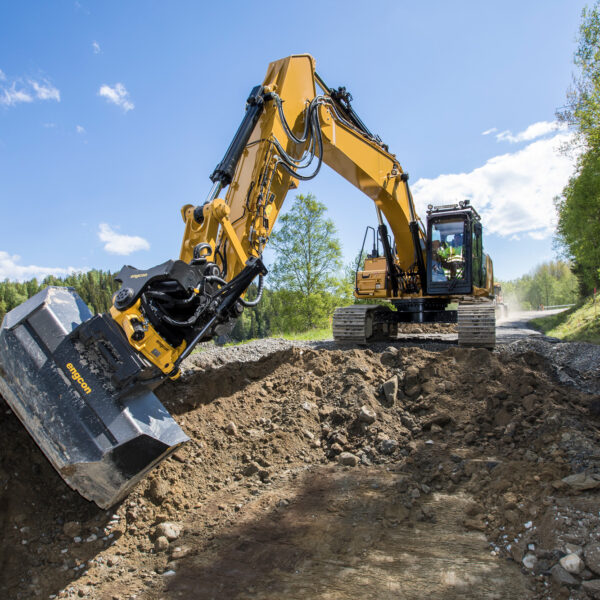
engcon is a global developer and manufacturer of tiltrotators, quick hitches, hydraulic and mechanical attachments, and control systems for excavators. The company offers a complete tiltrotator system that transforms excavators into multi-purpose tool carriers, enhancing flexibility, precision, and safety in excavation work. Products are manufactured in Strömsund, Sweden, and Niepruszewo, Poland, with components sourced from suppliers in Sweden and Northern Europe. engcon serves end-users in the construction and infrastructure sectors across four geographic regions: Nordics, Europe, the Americas, and Asia/Oceania. The company sells through local sales companies and a global network of resellers. Notable OEM partnerships include Komatsu, Develon, and Hitachi, which integrate engcon's technology into excavator ecosystems. Founded in 1990, the company operates under its own brand.

Summarised from the company's own disclosures, fiscal year ended Dec 2025

Industry Farm & Heavy Construction Machinery Homepage engcongroup.com
Sector Industrials IR page engcongroup.com/investors
Tags
tiltrotators, excavator attachments, quick hitches, control systems, construction equipment, hydraulic tools, oem partnerships, System engcon, EC319, EC309, DC3, EC-Oil, Komatsu, Develon, Hitachi, TM Benne
Press page engcongroup.com/release

Metrics

Valuation  
Market cap kr 14.344B
Market cap (USD) $ 1.419B
P/E 65.63
PEG —
P/BV 19.07
P/S 7.59
P/OCF 150.99
P/FCF —
Dividend yield —
Turnover / mcap —
Returns  
ROE 31.0%
ROI 30.4%
ROIC 33.7%
Profit margin 11.8%
Growth  
Revenue growing No
Profits growing No
Revenue up 3y No
Revenue up 5y No
Earnings growth 3y (net profit CAGR) -10.6%
Quality  
Profitable Yes
Margin expanding No
Buying back stock No
Diluting (TTM) No
Debt/Equity 2.8%
Podcast bulls (TTM) Sign up
Podcast bears (TTM) Sign up
Podcast sentiment (TTM) Sign up
Podcast sentiment % (TTM) Sign up
News sentiment (TTM) 56
Quality score -18.8%
Insiders  
Buys, 1w Sign up
Buys, 1m Sign up
Buys, 1y Sign up
Sells, 1w Sign up
Sells, 1m Sign up
Sells, 1y Sign up

Sign up to see this company's insider trades

Figure FY 2025 FY 2024 FY 2023 FY 2022 FY 2021 FY 2020
Revenue 1.889B 1.649B 1.898B 1.938B 1.488B 1.077B
Net profit 223M 229M 285M 325M 293M 163M

Figure FY 2025 FY 2024 FY 2023 FY 2022 FY 2021 FY 2020
Share price 94.5 107.2 93.5 59.99 — —
Price performance 12m -0.12 0.15 0.56 — — —

Filed figures

Figure Dec 2020 Dec 2021 Dec 2022 Dec 2023 Dec 2024 Dec 2025
Balance sheet detail
Trade receivables (SEK) — 208M 347M 193M 227M 257M
↳ YoY growth +66.8% -44.4% +17.6% +13.2%
Borrowings, current (SEK) — 67M 52M 41M 33M 25M
Borrowings, non-current (SEK) — 8M 4M 0.00 0.00 0.00
Lease liabilities (SEK) — 47M 72M 96M 88M 85M
Cash and deposits (SEK) 209M 228M 30M 101M 132M 42M
Intangible assets (SEK) — 0.00 35M 63M 87M 98M
Right-of-use assets (SEK) — 49M 69M 93M 79M 81M
Net debt (borrowings + leases - cash) (SEK) — -106M 98M 36M -11M 68M
Cash flow detail
Operating cash flow (SEK) — 175M 216M 486M 239M 95M
Purchases of property, plant and equipment (SEK) — -12M -12M -27M -19M -21M
Purchases of intangible assets (SEK) — 0.00 -35M -31M -25M -16M
Change in receivables (cash effect) (SEK) — -69M -165M 172M -28M -32M
Change in inventories (cash effect) (SEK) — -132M -140M 140M -36M -138M
Change in payables (cash effect) (SEK) — 45M 72M -100M 27M -31M
Dividends paid (cash effect) (SEK) — -163M -448M -143M -149M -153M
Share buybacks (cash effect) (SEK) — — — — 0.00 -12M
Interest paid (cash effect) (SEK) — -4M -17M -16M -30M -9M
Income taxes paid (cash effect) (SEK) — -48M -55M -156M -72M -63M
Operating cash flow before change in receivables (SEK) — 244M 381M 314M 267M 127M
Free cash flow (OCF - PPE - intangibles) (SEK) — 163M 169M 428M 195M 58M
Income detail
Research and development expense (SEK) — 63M 28M 44M 47M 55M
Total comprehensive income (SEK) — 316M 336M 284M 238M 201M
Comprehensive income to owners (SEK) — 295M 314M 274M 225M 196M
Reported — — — — — —

Sign up to see institutional holdings

Sign Up

Podcast Mentions

Sign up to see podcast mentions and sentiment

Sign Up

engcon’s interim report Q3 2026 Bull 3 Bear 0 Results

View all press releases

Auto-translate

Original German French Korean Japanese

engcon’s interim report Q3 2026

29 October 2026, 08:00 CET Regulatory
engcon’s interim report Q3 2026 engcon’s interim report Q3 2026

Translated automatically by DeepL. In case of discrepancies, the original version prevails.

Third quarter 2026

  • Order intake decreased 9 per cent to SEK 424 million (467); organic order growth was -10 per cent.
  • Net sales increased 5 per cent to SEK 435 million (415); organic net sales growth was 4 per cent.
  • Operating profit (EBIT) increased 23 per cent to SEK 86 million (70).
  • The operating margin amounted to 19.9 per cent (16.9).
  • Profit for the quarter increased 32 per cent to SEK 69 million (52).
  • Basic and diluted earnings per share amounted to SEK 0.45 (0.33) and SEK 0.45 (0.33), respectively.

January – September 2026

  • Order intake increased 2 per cent to SEK 1,468 million (1,441); organic order growth was 3 per cent.
  • Net sales increased 13 per cent to SEK 1,567 million (1,391); organic net sales growth was 14 per cent.
  • Operating profit (EBIT) increased 9 per cent to SEK 272 million (248). Operating profit (EBIT), adjusted for items affecting comparability, amounted to SEK 285 million (248) and increased by 15 per cent.
  • The operating margin amounted to 17.4 per cent (17.8). The operating margin, adjusted for items affecting comparability, amounted to 18.2 per cent (17.8).
  • Profit for the period increased 25 per cent to SEK 219 million (175).
  • Basic and diluted earnings per share amounted to SEK 1.44 (1.12) and SEK 1.43 (1.11), respectively.

CEO Stig Engström comments:

“The recovery is taking its time, and I am far from satisfied. Developments in our markets are mixed, and feature both stable and unexpectedly weak markets. Sweden is driving growth in the Nordic region. The Netherlands continued to grow in Europe, while the performance in France was unexpectedly poor. Operating profit increased to SEK 86 million, corresponding to an operating margin of 19.9 per cent. Favourable currency effects played a big part, while a slight improvement in cost efficiency in the rest of the organisation also contributed. But our direction stays the same and the work towards our financial targets continues. We are focusing on growing sales and adapting products, at the same time, we have chosen to retain the necessary capacity and expertise to be able to meet demand when it picks up.”
says Stig Engström, President and CEO.

Q3 presentation today at 10.00 CEST

The report will be presented by Stig Engström, CEO, and Marcus Asplund, CFO. The presentation will be held in English and will be followed by a Q&A session.

Follow the webcasted presentation and conference call live at:
https://events.inderes.com/engcon/q3-report-2026

If you wish to participate via teleconference please register on the link below. After registration you will be provided phone numbers and a conference ID to access the conference. You can ask questions verbally via the teleconference.
https://events.inderes.com/engcon/q3-report-2026/dial-in

The presentation material and a recorded version of the conference will be available at
https://www.engcongroup.com/investors/reports-and-presentations/
engcons delårsrapport tredje kvartalet 2026 Bull 3 Bear 0 Results

Visa alla pressmeddelanden

Auto-translate

Original German French Korean Japanese

engcons delårsrapport tredje kvartalet 2026

29 oktober 2026, 08:00 CET Regulatorisk

engcons delårsrapport tredje kvartalet 2026 engcons delårsrapport tredje kvartalet 2026

Översatt automatiskt av DeepL. Vid avvikelser har den engelska originalversionen företräde.

Tredje kvartalet 2026

  • Orderingången minskade med 9 % till 424 (467) MSEK, den organiska ordertillväxten var -10 %.
  • Nettoomsättningen ökade med 5 % till 435 (415) MSEK, den organiska nettoomsättningstillväxten var 4 %.
  • Rörelseresultatet ökade med 23 % till 86 (70) MSEK.
  • Rörelsemarginalen uppgick till 19,9 (16,9)%.
  • Kvartalets resultat ökade med 32 % till 69 (52) MSEK.

Resultat per aktie, före och efter utspädning, uppgick till 0,45 (0,33) SEK respektive 0,45 (0,33) SEK.
Januari – September 2026

  • Orderingången ökade med 2 % till 1 468 (1 441) MSEK, den organiska ordertillväxten var 3 %.
  • Nettoomsättningen ökade med 13 % till 1 567 (1 391) MSEK, den organiska nettoomsättningstillväxten var 14 %.
  • Rörelseresultatet ökade med 9 % till 272 (248) MSEK. Rörelseresultatet justerat för jämförelsestörande poster uppgår till 285 (248) MSEK och ökade med 15 %.
  • Rörelsemarginalen uppgick till 17,4 (17,8)%. Rörelsemarginalen justerat för jämförelsestörande poster uppgick till 18,2 (17,8)%.
  • Periodens resultat ökade med 25 % till 219 (175) MSEK.
  • Resultat per aktie, före och efter utspädning, uppgick till 1,44 (1,12) SEK respektive 1,43 (1,11) SEK.

VD Stig Engström kommenterar:

”Uppgången låter vänta på sig, och jag är långt ifrån nöjd. Utvecklingen på våra marknader är tudelad, med både stabila och oväntat svaga marknader. Sverige driver utvecklingen i Norden och i Europa fortsätter Nederländerna att växa, medan Frankrike går oväntat dåligt. Rörelseresultatet ökade till 86 MSEK, vilket motsvarar en rörelsemarginal på 19,9 procent. Positiva valutaeffekter räddade upp mycket, samtidigt som en något bättre kostnadseffektivitet i övriga organisationen bidrog. Men riktningen ligger fast och arbetet mot våra finansiella mål fortsätter. Vi fokuserar på att öka försäljningen och anpassa produkterna, samtidigt väljer vi att behålla den kapacitet och kompetens som behövs när efterfrågan åter tar fart” säger Stig Engström, VD och koncernchef.

Q3 presentation idag kl. 10.00

Rapporten presenteras av Stig Engström, VD, och Marcus Asplund, CFO. Presentationen hålls på engelska och följs av en frågestund.

Följ den webbsända presentationen och konferensen live på:
https://events.inderes.com/engcon/q3-report-2026

Om du önskar delta via telefonkonferens registrerar du dig via länken nedan. Efter registreringen får du telefonnummer och ett konferens-ID för att logga in till konferensen. Via telefonkonferensen finns möjlighet att ställa muntliga frågor.
https://events.inderes.com/engcon/q3-report-2026/dial-in

Presentationsmaterialet och en inspelad version av konferensen kommer att finnas tillgängliga på
https://www.engcongroup.com/se/investerare/rapporter-och-presentationer/

Visa alla pressmeddelanden

Auto-translate

Original German French Korean Japanese

Inbjudan till presentation av engcons rapport för tredje kvartalet 2026

21 oktober 2026, 08:00 CEST

Översatt automatiskt av DeepL. Vid avvikelser har den engelska originalversionen företräde.

engcons delårsrapport för det tredje kvartalet 2026 kommer att publiceras torsdagen den 29 Oktober 2026 cirka kl. 08.00. En webbsänd telefonkonferens hålls samma dag kl. 10.00.

Rapporten presenteras av Stig Engström, VD, och Marcus Asplund, CFO. Presentationen hålls på engelska och följs av en frågestund.

Följ den webbsända presentationen och konferensen live på:
https://events.inderes.com/engcon/q3-report-2026

Om du önskar delta via telefonkonferens registrerar du dig via länken nedan. Efter registreringen får du telefonnummer och ett konferens-ID för att logga in till konferensen. Via telefonkonferensen finns möjlighet att ställa muntliga frågor.
https://events.inderes.com/engcon/q3-report-2026/dial-in

Presentationsmaterialet och en inspelad version av konferensen kommer att finnas tillgängliga på
https://www.engcongroup.com/se/investerare/rapporter-och-presentationer/

Prompts

engcon (ticker ENGCON-B), listed in Sweden.

ETFs Holding engcon

ETF Weight in ETF Shares Market value As of
AVDV 0.01% 302,823 $ 1.608M Nov 16, 2026
AVDS 0.01% 5,308 $ 28.194K Nov 16, 2026
DFIS 0.01% 60,203 $ 329.57K Nov 12, 2026
DFIC 0.00% 34,201 $ 187.227K Nov 12, 2026
DFAX 0.00% 10,278 $ 56.265K Nov 12, 2026
DFAI 0.00% 8,291 $ 45.387K Nov 12, 2026
DFSI 0.00% 150 $ 821.15 Nov 12, 2026
DXIV 0.00% 27 $ 147.81 Nov 12, 2026
AVDE 0.00% 8,421 $ 44.729K Nov 16, 2026
AVSD 0.00% 355 $ 1,885.60 Nov 16, 2026