Tillsammans med andra aktörer inom initiativet #HusförHus lyfter Catena fastighetssektorns roll i Sveriges framtida energisystem. I en artikel i Fastighetsnytt pekar branschen på hur byggnader kan bidra till ökad energiberedskap, lägre belastning…
Tillsammans med andra aktörer inom initiativet #HusförHus lyfter Catena fastighetssektorns roll i Sveriges framtida energisystem. I en artikel i Fastighetsnytt pekar branschen på hur byggnader kan bidra till ökad energiberedskap, lägre belastning på elsystemet och en snabbare energiomställning.
Publicerad 2026-09-03
De senaste årens energikris har tydliggjort hur nära sammanlänkade energifrågor, konkurrenskraft och beredskap är. Samtidigt finns en stor potential i Sveriges befintliga fastighetsbestånd som ännu inte tas till vara fullt ut.
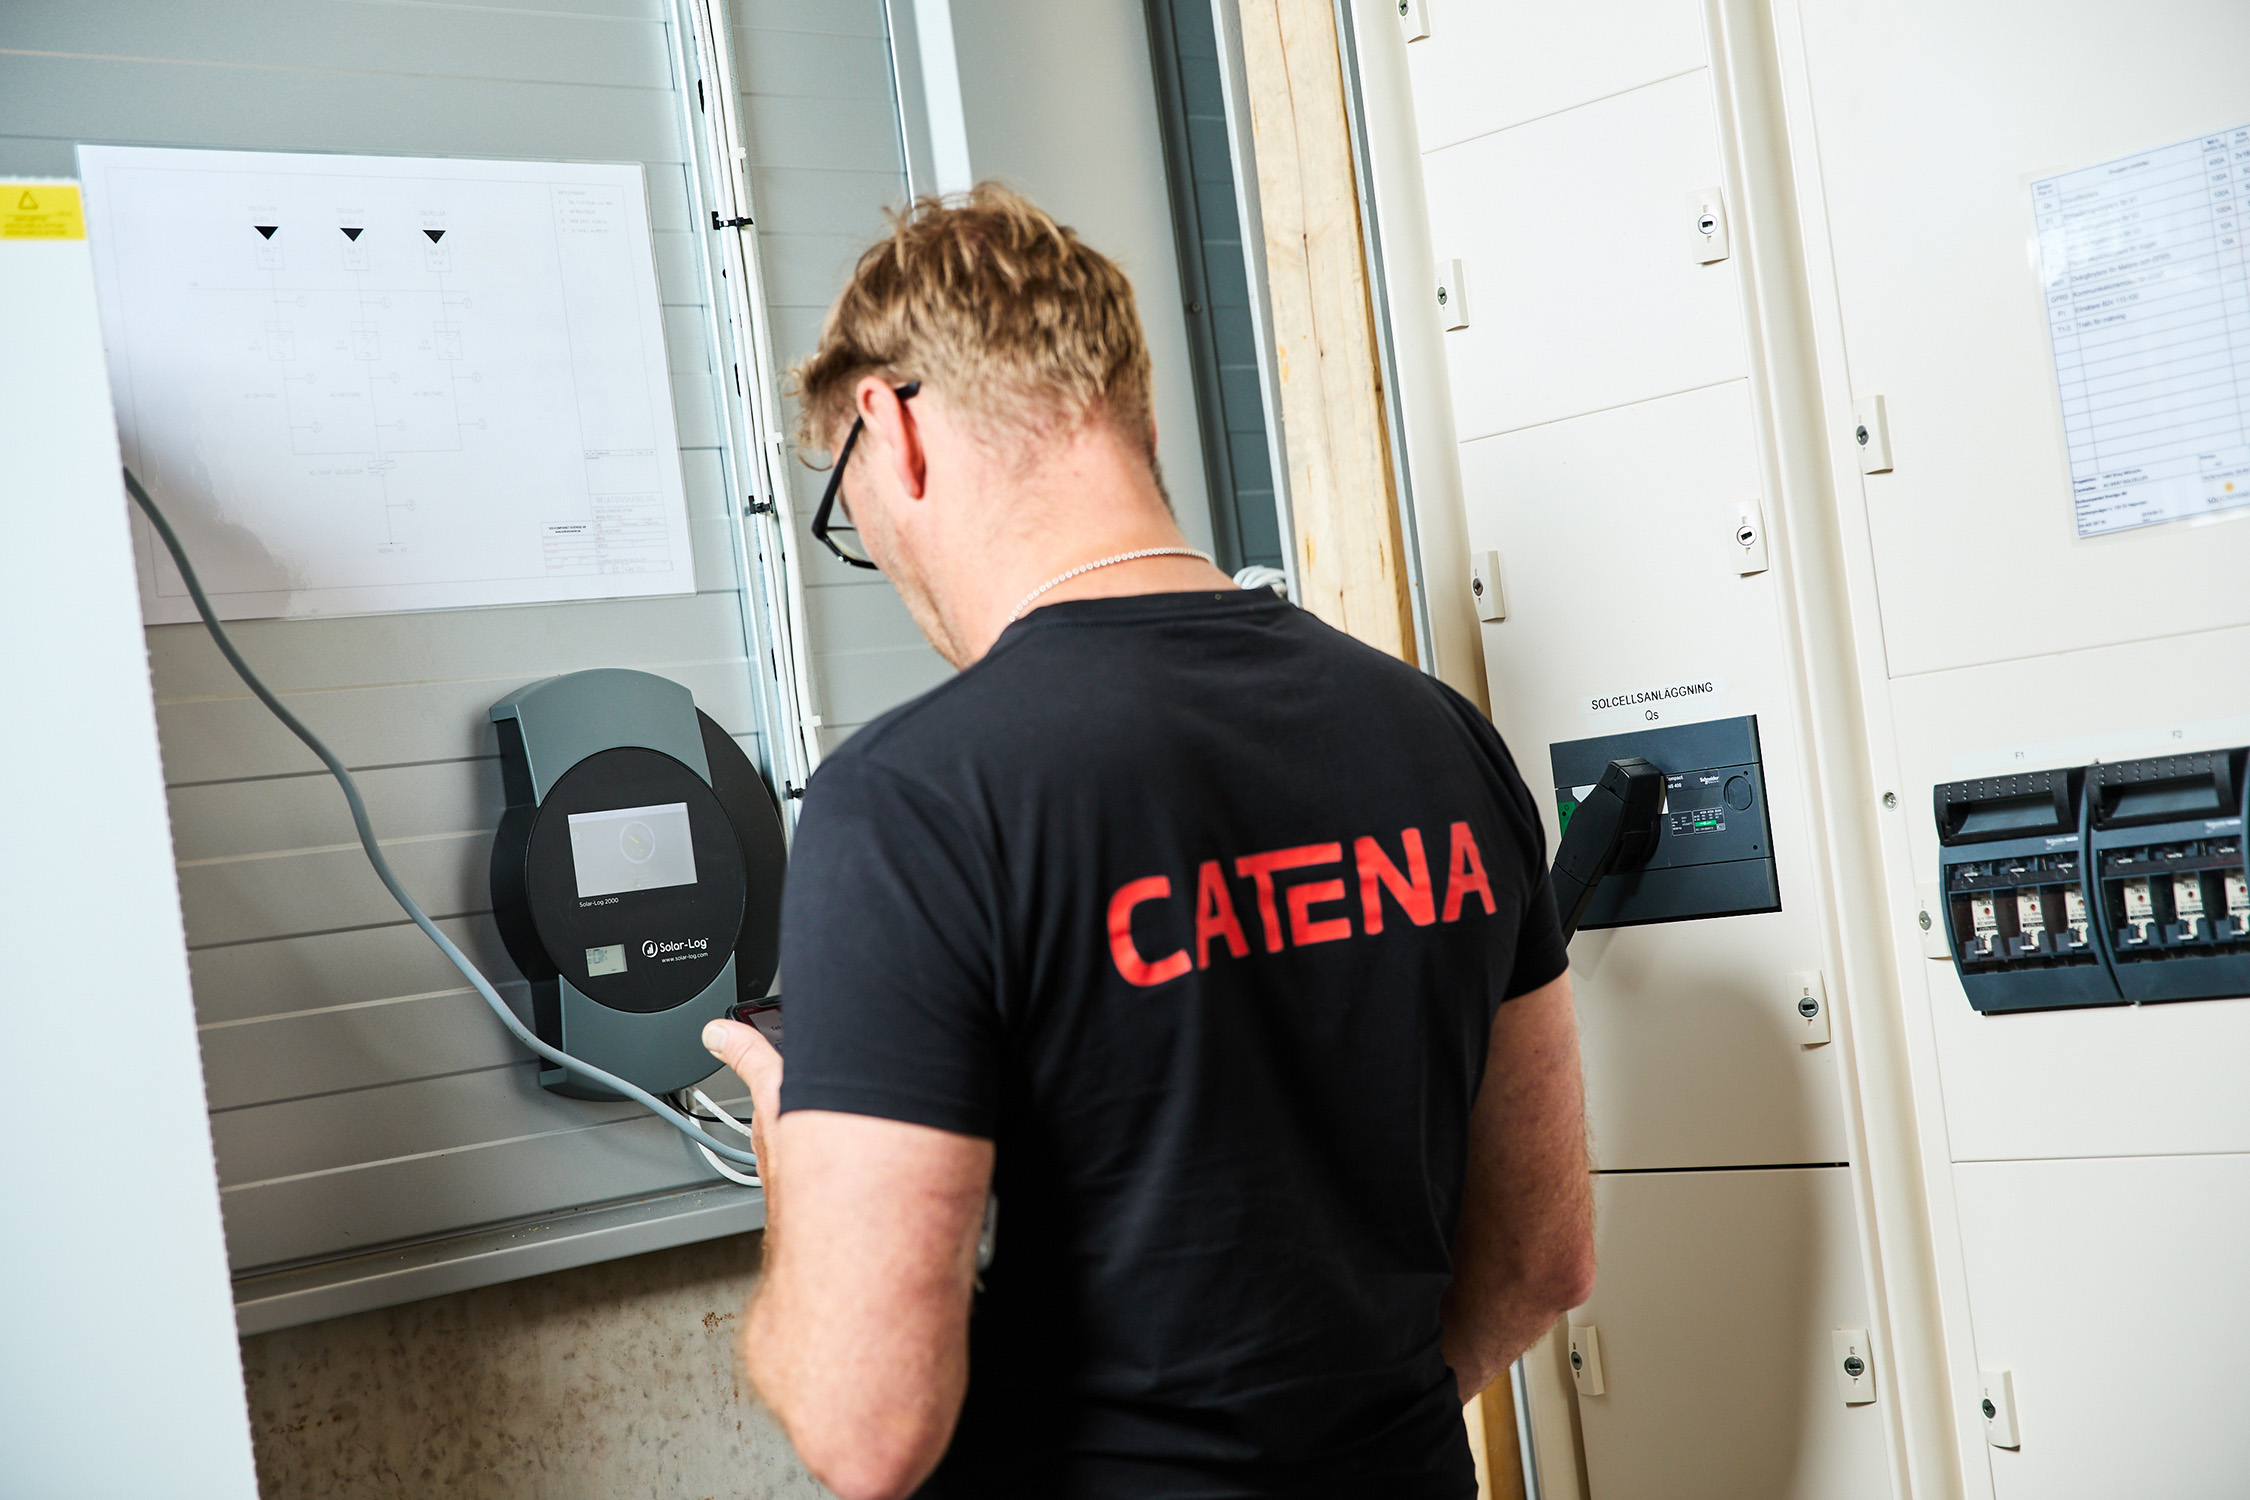
Catena har tillsammans med övriga bolag inom initiativet #HusförHus skrivit under en artikel i Fastighetsnytt som lyfter fastighetssektorns möjligheter att bidra med energieffektivisering, lokal energiproduktion och flexibilitet i energisystemet. Genom att använda den kapacitet som redan finns i byggnader kan sektorn bidra till ett mer robust och motståndskraftigt samhälle.
För Catena är frågan en naturlig del av det långsiktiga hållbarhetsarbetet. Logistikfastigheter har goda förutsättningar att bidra till omställningen genom såväl effektiv energianvändning som investeringar i lösningar som stärker elsystemet och minskar klimatpåverkan.
När energisystemet ställs inför nya utmaningar behöver fler aktörer bidra till lösningarna. Därför fortsätter Catena att driva på för förutsättningar som gör det möjligt att använda fastigheternas fulla potential, både för energiomställningen och för Sveriges energiberedskap.
Läs artikeln i Fastighetsnytt här
#HusförHus
----------
Läs mer om initiativet HusförHus här.
Fler lästips
[
\
Nyheter\
2026-02-12
\
Catena driver på för att skapa framtidens förutsättningar för energidelning\
Vi utforskar framtidens lösningar för smart och resurssnål energidelning på våra logistikanläggningar i Morgongåva.
Läs mer](https://www.catena.se/om-oss/pressrum/artiklar/catena-driver-pa-framtidens-forutsattningar-for-energidelning/)
[
\
Nyheter\
2026-06-11
\
Olofsson Bygg vinner Catenas återbruksjakt för Boozt-projekt i Ängelholm\
Olofsson Bygg vinner Återbruksjakten för tillbyggnaden för Boozt i Ängelholm, där de har utmärkt sig genom ett brett och systematiskt arbete med återbruk.
Läs mer](https://www.catena.se/om-oss/pressrum/artiklar/olofsson-bygg-vinner-catenas-aterbruksjakt-for-boozt-projekt-i-angelholm/)
[
\
Nyheter\
2026-06-22
\
EAB vinner Catenas återbruksjakt med banbrytande stållösning\
Genom återbruk av bärande stålkonstruktioner visar EAB nya möjligheter för cirkulärt byggande.
Läs mer](https://www.catena.se/om-oss/pressrum/artiklar/eab-vinner-catenas-aterbruksjakt-med-banbrytande-stallosning/)

 Serviceanmälan
 Press
 Kontakt
 Sök
 En
 Meny
 Stäng
 Kontakta oss
 042-449 22 00](tel:042-449 22 00)
 Karriär
 Lediga lokaler


 Kontakt
 Engelska


